Journal of Chemical and Pharmaceutical Research, 2014, 6(7):1042-1049
Research Article
CODEN(USA) : JCPRC5
ISSN : 0975-7384
Study on the keep-right-except-to-pass rule
Xiaoqiang Guo
1, Aimin Yang
1, Shumei Zhang
2, Lu Wang
3, Wei Ku
3and Zewei Wang
31
College of Science, Hebei United University, Tangshan, Hebei Province, China
2
College of Foreign Languages, Hebei United University, Tangshan, China
3
Qinggong College, Hebei United University, Tangshan, China
_____________________________________________________________________________________________
ABSTRACT
In most countries the traffic rule of keeping right is observed, multi-lane freeways often employ a rule that requires drivers to drive in the right-most lane unless they are passing another vehicle, in which case they move one lane to the left, pass, and return to their former lane. In order to know whether this rule can effectively promote a smooth traffic in both light and heavy traffic, we mainly consider four factors that are traffic flow, safety, rate of lane changing and limited speed. According to car following theory, modified and piecewise segment fixed-end-beam (FEB) model and hydrodynamic model of mixed traffic, we established highway traffic flow models. According to the deflection curve of segment fixed-end-beam, we imitate the overtaking and following process of a vehicle, stretch this process to the whole traffic flow system, imitate traffic flow by fluid motion, and then create the freeway model
of traffic flow. We gain the solution to the model through the analysis of characteristic lines, the relations of flow
q
, designed limit speeduf, densityk
and rate of lane changing are showed in the following formula:a
ce bk q= + ,
where b=µfm,c=µfkf(1−m),
m
is coefficient of wave velocity, kjis the block density if the speed is zero. Wereach a conclusion that the keeping right rule except overtaking can effectively improve a smooth traffic in a light traffic, but it doesn’t in a heavy traffic. But traffic jams often happen in freeways; in this case, the keeping right rule cannot improve a smooth traffic. To enlarge traffic flow in unit road and enhance safety, we put forward a new rule of limit line and lane after the consideration of safety distance and maximum traffic. Take a four-lane freeway as an example, regulations as follows:
1) Limit line: we record the total number of vehicles running in freeways timely. When the total number reaches the
maximum number
N
, the rule of limit line is employed in the entrances of freeways, and vehicles are not allowed to enter until the total number of vehicles is less than N. This rule can guarantee enough safety distance between vehicles.2) Driving in different lanes: the leftmost lanes are fast lanes, which allow the driving of vehicles with a speed of100 ~120km /h. The two middle lanes are ordinary lanes, which allow the driving of vehicles with a speed of
h km /
100 ~
80 .The rightmost lanes are slow lanes, which allow the driving of vehicles with a speed of 60~80km /h.
This rule can enlarge the traffic flow of freeways.
Key words: modified and piecewise segment fixed-end-beam (FEB), hydrodynamic of mixed traffic, analysis of
characteristic lines, keeping right rule
_____________________________________________________________________________________________
INTRODUCTION
We analyze sparse traffic and congestion, traffic flows, safety, above or below the speed limit or other factors which are not explicitly stated, in addition, it explores, except overtaking, whether the traffic rules of driving on the right are able to effectively promote traffic or not. If the rule of driving on the right cannot promote the smooth flow of traffic, the paper suggests and analyzes other feasible ways to weigh the traffic flow, safety or other factors considered important, proposes new rules which can effectively promote the smooth flow of traffic [4-6].
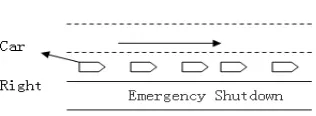
According to the rules of driving on the right, the vehicles should travel on the right-most lane (Emergency road is not allowed to use except emergencies) [7-9]. The statement of driving is as the following Figure1.
Figure1: The most the right side of the road
[image:2.595.224.382.181.239.2]Overtaking is as Figure2.
Figure 2: overtake
First, the paper, by conversion factor, translates the number of vehicles passing the highway into standard vehicle equivalent. It studies the four factors including traffic flow, traffic safety, and lane change rate and lane speed limit. According to the concept of car-following, the establishment of traffic flow model with deflection curve of segment fixed-end-beam (FEB) simulates with the car and overtaking process , this process will be extended to any traffic flow throughout the system, and used to simulate the transport of fluid motion flow , thereby freeway traffic flow system will be established [10, 11].
With the development of economy, the country's motorization level has been rapidly enhanced, and naturally, the traffic jam appears. In the traffic jam, in addition to overtaking, traffic rules that driving on the right can not effectively solve the traffic problems. In order to improve the traffic and safety, we establish the new rules of limit line and lane.
TRAFFIC FLOW SYSTEM ON THE FREEWAY UNDER THE RULES OF KEEPING RIGHT
When the drivers keep right traveling on the freeway, following and overtaking is the most common phenomenon between vehicles. Therefore, we can build traffic flow model with the rules of keeping right through studying vehicle overtaking process. In the paper we simulate vehicles’ overtaking and following process employing beam deflection curve of segment fixed-end-beam (FEB), moreover, this process will be extended to the whole traffic flow, and then simulate the traffic flow according to the fluid movement, and thus build the traffic flow system under the rules of keeping right.
Modified and piecewise segment fixed-end-beam (FEB)
Suppose the number of vehicles on some section of freeway is
n
, their maximum speed is respectively) ( max )
2 ( max ) 1 (
max
,
,
,
nv
v
v
L
their original location are respectively
(
0
),
(
0
),
,
(
0
)
) ( )
2 ( ) 1
( n
s
s
s
L
moreover,their relationis
) ( max )
2 ( max )
1 ( max
n
v
v
v
>
>
L
>
, (1)(
0
)
(2)(
0
)
(n)(
0
)
s
s
s
<
<
L
<
i) The time required for the process of overtaking
By analyzing the process of vehicle
i
overtaking vehiclei
+
1
, the position diagram 3 is made as follows.Figure3: position
First calculate the car’s average speed of overtaking:
2
) ( max ) ( mini i
v
v
v
=
+
(1)
Write
t
0as reaction lag time[5] ofi
in the course of overtaking, in this paper,t
0=
3
s
, the effective time ofi
:0
2
t
T
t
e=
−
.Then calculate the actual distance of
i
overtaking in the whole process:)
2
(
2
0) ( max ) ( min
t
T
v
v
S
i i
i
−
+
=
(2)
Then calculate the actual distance of
i
+
1
overtaking in the whole process:T
v
S
i i) 1 ( 1
+
+
=
(3)According to the Figure3:
1 )
1 ( 0 )
( max ) (
min
(
2
)
2
++
+
+
=
−
+
i i i
i i
h
h
T
v
t
T
v
v
(4)
By simplification:
) ( min ) ( max
0 ) 1 ( ) ( max
1
2
(
)
2
2
i i
i i i
i
v
v
t
v
v
h
h
T
−
+
+
+
=
+ +(5)
Note:
h
i,
h
i+1 are respectively referring to the safety distance ofi
followingi
+
1
and that ofi
+
1
following thevehicle ahead, and
) ( max
2
ii
v
h
=
,
) 1 ( max 1
2
+
+
=
ii
v
h
.
ii)The instantaneous speed of
i
in the process of overtaking) ( max
i
v
: the maximum speed of
i
,) 1 (i+
v
: the speed ofi
+
1
when passed byi
,t
ˆ
ii+1: the overtaking time according
to the model,
t
ˆ
i\i+1: the starting time of overtaking,t
ˆ
i/i+1: the ending time of overtaking.When
i
is besidei
+
1
, the speed ofi
:(
)
() () ( 1) max) ( )
( 1 ) (
1
++
=
−
+
=
i i i i ii i i
v
v
v
v
β
β
From starting overtaking to the moment when they are racing neck by neck, the time spent by
i
:α
(i)T
(i), and thenthe instantaneous speed of
i
in the process of overtaking:(
)
(
)
≥ ≤ ≤ − − − ⋅ − − ≤ ≤ − ⋅ − − ≤ = + + + + + + + + 1 / ) ( max 1 / 1 3 ) ( ) ( 2 ) ( ) ( 1 ) ( ) ( max ) ( max 1 1 \ 3 ) ( ) ( 2 ) ( ) ( 1 ) ( ) ( max ) ( max 1 \ ) ( max ) ( ˆ , ˆ ˆ , 1 2 1 3 )) ˆ ( ( ˆ ˆ , 2 3 )) ˆ ( ( ˆ , i i i i i i i i i i i i i i i i i i i i i i i i i i i i i i i i i t t v t t t T T t v v v t t t T T t v v v t t v v α τ α τ α τ α τ (7)iii)The instantaneous position of
i
in the process of overtakingAccording to formula (7), speed curve of
i
is similar to beam deflection curve of segment fixed-end-beam. Supposethe length of this segment fixed-end-beam is
L
; the time of overtaking isT
(i) compared toL
, this segmentfixed-end-beam is affected by co-work of a transverse concentrated load and a concentrated torque , the result is that segment fixed-end-beam is reaching the maximum deflection.
According to the formula of beam deflection curve of segment fixed-end-beam, the instantaneous position of
i
inthe process of overtaking is:
=
)
(
ˆ
()t
S
iS
(i)(
0
)
+
v
max(i)t
. (
t
≤
t
ˆ
i\i+1)=
)
(
ˆ
()t
S
i(
)
(
) (
)
− − −
+ + () ()3
4 2 ) ( ) ( 3 1 ) ( ) ( max ) ( max )
( 0.5
) ˆ ( ) 0 ( i i i i i i i i i i T T t v v t v S
α
τ
α
τ
(
)
( )(
)
(
)
− − − − − ⋅ − + − − + = + + 3 ) ( ) ( 4 ) ( 2 ) ( 3 ) ( 1 ) ( ) ( max ) ( 1 ) ( ) ( max ) ( max ) ( ) ( ) ) 1 (( ) ( 5 . 0 1 )) ˆ ( ( )) ˆ ( ( 5 . 0 ) 0 ( ) ( ˆ i i i i i i i i i i i i i i i i i i T T T T t v v T t v v t v S t Sα
τ
α
τ
1 / 1ˆ
ˆ
++
<
≤
i ii
i
t
t
t
(8)
Hydrodynamic model
According to the knowledge of hydrodynamics, the vehicle’s traveling is simulated as fluid motion, thereby; hydrodynamic model of traffic flow rules under the traffic rule of keeping on the right can be established.
Vehicle density:
k
, traveling time:t
, traffic flow:q
, velocity:u
w, maximum velocity:u
m.s=dr dSˆ(i)(t),r
istraffic flow of lane change, when vehicles move out of the lane,
r
<
0
,
s
<
0
; when vehicles move into the lane,0
,
0
>
>
s
r
; when no vehicles move,r
=
0
,
s
=
0
.The result of modified and sectioned segment fixed-end-beam (FEB) model is introduced into hydrodynamic model of mixed traffic, the result is:
(
)
(
)
=
−
−
∂
∂
−
+
∂
−
∂
+
∂
∂
+
∂
∂
=
∂
∂
+
∂
∂
0
]
/
)
[(
)
(
ˆ
/
*
/
)
[(
/
)]
(
ˆ
/
[
)
(
ˆ
/
/
)
(
ˆ
/
/
) ( ) ( ) ( ) ( ) ( ) ( ) ( ) ( ) (k
v
u
t
S
q
k
u
u
k
t
S
v
u
q
t
S
v
v
t
v
s
t
S
q
t
k
i w i m w i i m i i i i i (9)
−
−
+
−
+
=
−
]
)
/
(
[
4
/
]
)
1
(
[
]
)
1
(
[
2 a
j f
a j f
a f f
a f f
e
k
k
k
mu
e
k
mu
e
k
m
mk
u
e
k
m
mk
u
q
0
1
,
5
.
0
0
1
,
5
.
0
0
1
,
1
0
,
'' '
' ''
≤
≤
−
≤
≤
≤
≤
−
≤
≤
≤
≤
−
≤
≤
≤
<
≤
≤
a
k
k
e
k
a
e
k
k
e
k
a
e
k
k
e
k
a
k
k
e
k
a f
a j a
a a
f a f
(10)
f
u
is free stream velocity, i.e. road design speed;
k
f is the maximum density at the speed of free stream velocity;m
is velocity factor;k
f is the density of congestion;m
k
m
k
k
j/
4
(
1
)
f/
'
=
−
−
×
,
k
k
m
k
e
m
a f j
/
4
(
1
)
/
''
=
−
−
;
a
is the frequency of changing lane, i.e. the ratioof the overtaking flow and lane traffic.
Set
b
=
µ
fm
,c
=
µ
fk
f(
1
−
m
)
, simplify the traffic flow formula:,
0
1
''
<
≤
≤
≤
k
k
a
e
k
f a :q
=
bk
+
ce
aIntroduce the related number into formula (10), in the three limiting case: frequency of changing lane
1
,
0
,
1
=
=
−
=
a
a
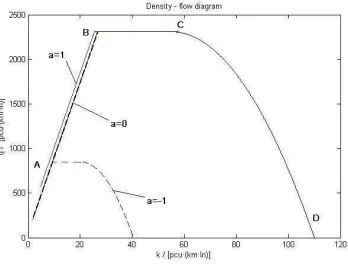
[image:5.595.217.391.350.485.2]a
, employ the software MATLAB and make the diagram of density-flow, as the followingFigure 4:
Figure 4: Density-flow diagram
Observing Figure 4, curve a=1is on top of curvea=0 in the density range of curve
AB
, when the traffic issparse, traveling on the right, the whole road traffic flow is enhanced compared with traffic flow when the traffic
rules are absent. Curve a=1 is coincided with the axis
k
, that is to say, in the case of congestion the rules ofkeeping on the right cannot promote the traffic.
With the lower density and the same traffic flow, curve
a
=
1
is on the left of curve a=0, the driving safety isenhanced under the rules of keeping on the right compared with no traffic rules; with the higher density, curve a=1
is coincided with axis
k
; if there exists curve a=0, in the section BC, the traffic flow will not change with thedensity, in the sectionCD, with the increasing of density
k
, the traffic will decrease gradually to zero.In summary, the rules of keeping on the right can effectively enhance the traffic in the sparse freeway, while in the congestion the rules of keeping on the right cannot enhance it.
THE NEW RULES OF LIMIT LINE AND LANE
The rules of limit line
At the exit and entrance of freeway, the number of running vehicles can be totaled. When the total number reaches
the maximum safety
N
, at the entrance the rules of limit line should be used and the vehicles should be forbiddenuntil the number is less than
N
. By simulating the braking process, the safety distance between the two vehicles iscalculated:
g
v
vt
l
µ
2
2
1
+
=
(11)
v
is the speed of the vehicle behind,t
1 is the driver’s reaction time:1
.
5
s
,µ
is the friction factor between dryasphalt concrete road and wheels:
0
.
7
,g
is local acceleration of gravity.The maximum density under the condition of keeping the safety distance:
0
1
l
l
k
+
=
(12)
0
l
is the length of the usual vehicle:
4
.
5
m
.The maximum safety capacity on the freeway:
L
k
N
=
⋅
(13)L
is the distance between the exit and the entrance on the freeway.Introduce formula(12)into formula(13),the result is
0
l
l
L
N
+
=
(14) Introduce formula(11)into formula(14),the result is
(
0 1)
22
2
vt
l
g
v
gL
N
+
+
=
µ
µ
(15) Introduce the related number into formula(15), the result is
74
.
61
58
.
20
72
.
13
2
+
+
=
v
v
L
N
(16)
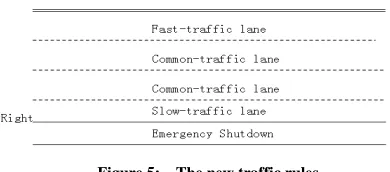
rules of lane
Take four lanes freeway as an example, the left lane is the fast one which only allows the automobiles to run at the
speed of100~120km /h, the middle lane is ordinary one which only allows the automobile at the rate of80~100km /h,
the right lane is the slow lane which only allows the automobile at the speed of 60~80km /h. Rules of lane is
[image:6.595.202.397.553.639.2]shown as the following Figure 5:
Figure 5: The new traffic rules
As is known to all, Lane change will take up more road space, following the limit line, the number of changing lane
during
t
:(
s) (
k)
c Q Q akt l
Q = −
(17)
s
Q
is the traffic decrease;
(
Q
−
Q
s)
is the traffic flow after changing lane;a
is frequency of changing lane;k
The extra space the vehicle occupies when it changes lane:
(
Q
Q
s) (
q
ikt
l
k)
V
t
cl
∆=
−
∆
(18)
V
∆
is the difference between the speed of changing lane and its maximum speed.In order to get the total extra occupied space due to the lane change, we just need to get every vehicle’s space; the traffic decrease can be calculated due to extra s occupied pace. Theoretically the result of every vehicle’s space is
Q
k
l
z=
(19)
And then the decrease traffic can be calculated:
(
)
c k
c
c k i s z s
t V Qa l
t V a Q
Q kt
t V l kt q Q Q
l l Q
∆ +
∆ =
∆
− =
= ∆
2
(20)
Set Q=Kjk 4, and introduce it into formula (20),the result is:
c j k
c j
S
t V ka K l
t V a k K Q
∆ +
∆ =
4 16
2 2
(21)
Other variables held constant, the rate is proportional to the linear relationship between decrease traffic
Q
sin unittime and lane-changing frequency
a
. Sincea
under the speed limit is less thana
under the right line of trafficrules, so traffic decrease is reduced by the rule of lane. Therefore, the rules of lane can improve the traffic lane capacity.
CONCLUSION
flow model not only use the kinetic model of engineering, but also take into consideration the influence of various factors on traffic rules under light or heavy traffic. After a serious deduction of math formula, we gain a mock system of traffic flow under the rule of keeping right in freeways. The parameters are actually genuine and reliable. After the solving of sectioned segment fixed-end-beam (FEB) model, the future whole process sequence and its parameters can be determined. As for a vehicle, after knowing its process sequence, we can calculate its location according to the formula, if the time is given. Because the rolling friction cannot be ascertained in the setting of safety distance when a vehicle is braked, the maximum rolling friction is supposed as the sliding friction.
According to advanced segment fixed-end-beam (FEB) model, we can calculate a vehicle speed and location at any time when it is passing other vehicles. A designed program enables a computer to deduct a formula, simulating the whole overtaking process of a vehicle. This model can be applied to automobile driving of intelligence vehicles, and let intelligence vehicles be equipped with the function of automobile overtaking.
Acknowledgements
This work was supported by the Natural Science Foundation of Hebei Province (No. A2014209083) and the Scientific Technology Research and Development Plan Project of Tangshan ( No. 121302001a ).
REFERENCES
[1]Liu Xiao-lan. China Sport Science and Technology. 1984, 29(13), 46-49.
[2]Luo Yang-chun. Journal of Shanghai Physical Education Institute. 1994, 23(12), 46-47. [3]Wan Hua-zhe. journal Of Nanchang Junior College. 2010, 3, 154-156.
[6]Pan Li. Journal of nanjing institute of physical education(natural science). 2004, 19(1), 54-55. [7]Li Yu-he; Ling Wen-tao. Journal of Guangzhou Physical Education Institute. 1997, 17(3), 27-31. [8] Xu Guo-qin. Journal Of Hebei Institute Of Physical Education. 2008, 22(2), 70-72.
[9] Chen Qing-hong. China Sport Science and Technology. 1990, 21(10), 63-65