OPTIMIZATION OF SUPPLY CHAIN MANAGEMENT BY SIMULATION BASED RFID WITH XBEE NETWORK
AFTAB AHMED SOOMRO
A thesis submitted in
fulfilment of the requirement for the award of the Degree of Doctor of Philosophy in Mechanical Engineering
FACULTY OF MECHANICAL AND MANUFACTURING ENGINEERING UNIVERSITI TUN HUSSEIN ONN MALAYSIA
v
ABSTRACT
vi
ABSTRAK
vii
viii
TABLE OF CONTENTS
DECLARATION ii
DEDICATION iii
ACKNOWLEDGEMENT iv
ABSTRACT v
TABLE OF CONTENTS viii
LIST OF TABLES xii
LIST OF FIGURES xiii
LIST OF ABBREVIATIONS xvi
LIST OF PUBLICATIONS xviii
CHAPTER 1 INTRODUCTION 1
1.1 Research Background 1
1.2 Problem Statement 3
1.3 Aim and objectives of research 4
1.4 Scope of the research 5
1.5 Summary 5
CHAPTER 2 REVIEW OF LITERATURE 7
2.1 Auto-ID Technology 9
2.2 Shrinkage 10
2.3 Radio Frequency Identification (RFID) Systems 10
2.3.1 Physical Layer 12
ix
2.3.7 Path loss propagation Model 23 2.3.8 Free space propagation Model 24
2.3.9 Two-ray propagation Model 25
2.3.10 Multipath propagation Model 26 2.3.11 Radar Cross Section propagation Model 27 2.3.12 Radiation Pattern of an Antenna 28
2.3.13 Antenna Gain 29
2.3.14 IT Layer 30
2.4 Application of wireless networks 32
2.5 RFID network planning (RNP) 32
2.5.1 Optimal tag coverage 33
2.5.2 Reader collision avoidance (Interference) 33
2.5.3 Economic efficiency 34
2.5.4 Load balance 34
2.6 Optimization 34
2.7 Basic concept of Particle Swarm Optimization 36 2.8 XBee (ZigBee) (Wireless Sensor Network) 39
2.9 Summary 42
CHAPTER 3 RESEARCH FRAMEWORK 44
3.1 Research Flow 44
3.2 RFID network parameters 47
3.2.1 Tags Coverage 47
3.2.2 Interference 51
3.2.3 Number of readers 52
3.3 Setting parameters of search space 53
3.4 Setting topology of search space 55
3.5 Reader representation 56
3.6 Coding of tags, readers and working area 57 3.7 Coding of objective functions and all variable parameters 59
3.8 Application of MC-GPSO 59
3.8.1 Initialization 60
x
3.8.3 Operating procedure 61
3.8.4 Simulation Results 62
3.9 Summary 63
CHAPTER 4 INTEGRATION OF RFID-XBEE NETWORK WITH
DATABASE CONNECTIVITY 64
4.1 System Development 65
4.2 Hardware Configuration 67
4.2.1 RFID Reader Connection and Testing 67 4.2.2 XBee Module Connection and communication 71
4.3 RFID-XBee Operating Module 74
4.4 Software architecture of the system 77 4.4.1 LabVIEW Database Connectivity Module 77 4.4.1.1 Database connection tools of LabVIEW
program 80
4.4.1.2 Creation of UDL file for LabVIEW
Database Connection 80
4.4.1.3 The construction of LabVIEW database
functional module 81
4.4.1.4 The LabVIEW Database Connectivity
Programming Model 85
4.4.1.5 Graphical User Interface (GUI) 87 4.4.1.6 LabVIEW developed system 91 4.4.1.7 Validation of RFID-XBee and
LabVIEW database system 94
4.5 Live video operating module 94
4.6 IoT Operating Module 96
4.7 Integrated Module 100
4.8 Summary 105
CHAPTER 5 RESULTS AND ANALYSIS 107
5.1 Implementation of MC-GPSO 107
xi
5.3 Integrated network of RFID-XBee, database connectivity
and IoT result 120
5.4 Summary 122
CHAPTER 6 CONCLUSION AND RECOMMENDATIONS 123
6.1 Contribution 124
6.2 Recommendation 125
REFERENCES 126
APPENDIX A MATALAB CODE OF MC-GPSO 133
xii
LIST OF TABLES
2.1: Tangible ROI as a bottom-line positive business benefits 8 2.2: Application of operating frequencies in RFID system 17
2.3: Power comparison in dBm and mW 18
2.4: Conditions of Near-field and far-field region 21 2.5: Path loss exponent n and σ measured in different buildings 27 2.6: Previous reaserch summary of RFID network planning 41 2.7: Previous RFID research works integrated with wireless
technologies 42
3.1: The different case studies 53
3.2: Dimension of each reader for PSO solution 57
4.1: Hardware wire connections 71
5.1: Comparison results of MC-GPSO algorithm at tags 30 109 5.2: Comparison results of MC-GPSO algorithm at tags 50 110 5.3: Comparison results of MC-GPSO algorithm at tags 100 111 5.4: Comparison results of MC-GPSO algorithm at tags 30 112 5.5: Comparison results of MC-GPSO algorithm at tags 50 114 5.6: Comparison results of MC-GPSO algorithm at tags 100 115 5.7: Comparison results of MC-GPSO algorithm at 50 and 100 tags
(TE) 116
5.8: Comparison results of MC-GPSO algorithm at 50 and 100 tags
xiii
LIST OF FIGURES
2.1: Important Auto-ID technologies 9
2.2: Typical RFID System 11
2.3: RFID system layers 12
2.4: Various RFID Tags 13
2.5: Electromagnetic wave propagation 15
2.6: Electromagnetic wave path loss in free space 16
2.7: Electromagnetic wave 16
2.8: Summary of worldwide UHF band allocations 17 2.9: Radiated field regions of an antenna having maximum
dimension D 22
2.10: Path Loss Propagation Models 24
2.11: Two-ray Path Loss 25
2.12: The graphical representation of the radar system 28 2.13: The 3D radiation pattern of an electrically short current
element 29
2.14: The E-plane and H-plane patterns of an electrically short
current element 29
2.15: RNP basic problems 33
2.16: Types of computational Intelligence 35
2.17: Particle Swarm Optimization flow diagram 38
3.1: Research flow chart 46
3.2: Randomly plotting of tags 48
3.3: Randomly deploy number of readers 49
3.4: Best location of readers in the network 49
3.5: Multiple readers interference 52
xiv
3.7: Randomly plotting of 100 number of tags in 50m × 50m
working area 58
3.8: Optimization criteria flow strategy 61
4.1: Sustainable Supply Chain Management Optimization Model 65 4.2: Optimal Green Supply Chain Management Model 66
4.3: System Development 66
4.4: Circuit diagram of RFID reader connection with Xbee
Router/End device 68
4.5: Snaps of physical devices network connection 69
4.6: Protocol of the RFID Reader 69
4.7: Tag ID 70
4.8: XBee configuration procedure 72
4.9: Configurations of set of XBees 74
4.10: RFID-XBee Operating Module 76
4.11: LabVIEW Database Connectivity Module 78
4.12: Database connectivity model 79
4.13: Simple LabVIEW Database Construction Model 79
4.14: Microsoft Access database tables 81
4.15: LabVIEW database functional module 82
4. 16: Data execution in sequential order 83
4.17: Data displayed by index array 83
4.18: Verification of data in the database 84
4.19: VISA Close operation 85
4.20: LabVIEW Database Connectivity Programming Model 85
4.21: Vehicle and Item information 88
4.22: Live Cam Tab 89
4.23: Parameter setting Tab 90
4.24: Address source file Tab 90
4.25: LabVIEW Algorithm 92
4.26: Monitoring by LabVIEW Control panel 92
4.27: Microsoft Access Database Report (a) & (b) 94
xv
4.29: Live video block diagram 95
4.30: Wireless connection between two computers via IoT 97
4.31: Data server.vi and Data client.vi 98
4.32: Optimal solution of supply chain management 101
4.33: Optimal position of RFID readers 102
4.34: Integrate module 103
4.35: Live monitoring 104
5.1: Simulation results of case study 1 with 30 tags 110 5.2: Simulation results of case study 1 with 50 tags 111 5.3: Simulation results of case study 1 with 100 tags 112 5.4: Simulation results of case study 2 with 30 tags (a), (b) and (c) 113 5.5: Simulation results of case study 2 with 50 tags (a), (b) and (c) 115 5.6: Simulation results of case study 2 with 100 tags (a), (b) and (c)
116 5.7: Simulation results of case study 3 with 50 and 100 tags (a) and
(b) 117
5.8: Simulation results of case study 3 with 50 and 100 tags (a) and
(b) 119
5.9: Physical model of RFID-XBee network 120
xvi
LIST OF ABBREVIATIONS
ABC Ant Bee Colony
ACO Ant Colony Optimization ADO Active X Data Object
AIDC Auto Identification and Data Capture BFO Bacterial Foraging Optimization COM Component Object Model DBMS Data Base Management System
DSN Data Source Name
EA Evolutionary Algorithm EPC Electronic Product Code GPS Global Positioning System
GSCM Green Supply Chain Management GUI Graphical User Interface
HF High Frequency
IZ Interrogation Zone JIT Just-In-Time
LabVIEW Laboratory Virtual Instruments Engineering Workbench
LF Low Frequency
MAC Medium Access Control MATLAB Matrix Laboratory NPV Net Present Value
OCR Optical Character Recognition ODBC Open Data Base Connectivity
OLEDB Object Linking and Embedded Data Base ONS Object Naming Service
xvii
POS Point Of Sale
PSO Particle Swarm Optimization RCS Radar Cross Section
RFID Radio Frequency Identifications
RNP Radio Frequency Identifications Network Planning ROI Return On Investment
RTLS Real Time Locating System SCM Supply Chain Management SI Swarm Intelligence
SMI Small and Medium Scale Industry
UART Universal Asynchronous Receiver Transmitter UDL Universal Data Link
UHF Ultra High Frequency UPC Universal Product Code
xviii
LIST OF PUBLICATIONS
Journal Articles
1 Integration of Value Stream Mapping with RFID, WSN and ZigBee Network
Aftab Ahmed, Khalid Hasnan, Badrul Aisham, Qadir Bakhsh
Applied Mechanics and Materials, Vol. 465 (2014) pp 769-773
(SCOPUS, EI and ISI Proceedings)
2 Optimization of RFID Real-time Locating System
Khalid Hasnan, Aftab Ahmed, Winardi Sani, Qadir Bakhsh
Australian Journal of Basic and Applied Sciences Vol. 8 (2014) pp 662-668
(ISI Indexed)
3 Optimization of RFID network planning using ZigBee and WSN (In Press) Khalid Hasnan, Aftab Ahmed, Badrul Aisham, Qadir Bakhsh
Applied Mechanics and Materials Vol. 1660 (2015) pp
(SCOPUS, EI and ISI Proceedings)
4 Impact of RFID and XBee Communication Network on Supply Chain Management
Aftab Ahmed, Khalid Hasnan, Badrul-aisham, Qadir Bakhsh
Applied Mechanics and Materials Vol. 660 (2014) pp983-987 (SCOPUS and ISI Indexed)
5 A novel optimal RFID network planning by MC-GPSO
Khalid Hasnan, Aftab Ahmed, Badrul-aishama, Qadir Bakhsh, Kashif Hussain
Indian Journal of Science and Technology Vol. 8(17) (2015) pp. 1-7 (SCOPUS Indexed)
6 RFID with XBee communication network enhance the visibility of supply chain management (Accepted)
Khalid Hasnan, Aftab Ahmed, Badrul-aishama and Qadir Bakhsh
Procedia CIRP ELSEVIER
7 A Novel Integration of RFID Network Planning With XBee Network (Accepted)
xix
ARPN Journal of Engineering and Applied Sciences (SCOPUS Indexed)
Conference Presentations
1 International Conference on Mechanical, Automotive and Aerospace Engineering (ICMAAE 2013). Organized by: IIUM at Kuala Lumpur Malaysia on July 2-4, 2013
2 2nd International Conference on Engineering and Technology ICET-2013 Organized by: TATIUC at Bali Indonesia on 12-13 December, 2013
3 2nd International Conference on Robotics, Automation Systems
ICoRAS-2013
Organized by: TATIUC at Bali Indonesia on 12-13 December, 2013
4 4th International Conference on Mechanical and Manufacturing
Engineering (ICME 2013)
Organised by: Faculty of Mechanical and Manufacturing Engineering, Universiti Tun Hussein Onn Malaysia, at Bangi, Putrajaya, Malaysia on 17-19 December 2013
5 International Conference on Mathematics, Engineering & Industrial Applications 2014 (ICoMEIA 2014)
Organised by: Institute of Engineering Mathematics, Universiti Malaysia Perlis Universiti Malaysia Perlis (UniMap) at The Gurney Resort Hotel & Residences, Penang, Malaysia on 28th ~ 30th May, 2014
6 12th Global Conference on Sustainable Manufacturing
Organized by: Unversiti Technology Malaysia (UTM), Malaysia at The Puteri Pacific Hotel Johor Bahru on 22-24 September 2014
7 5th International Conference on Mechanical and Manufacturing
Engineering (ICME 2014)
Organised by: Faculty of Mechanical and Manufacturing Engineering, Universiti Tun Hussein Onn Malaysia, at Grand Preanger Hotel, Bandung, Indonesia on 29-30 October 2014
8 International conference on Green Computing and Engineering Technology 2015 (ICGCET'15)
Organized by: Gyancity Laboratory at Radisson Royal Hotel Dubai, UAE on 25-26 July2015
xx
Organized by: Technische Universität Berlin (TU Berlin) Vietnamese-German University (VGU), at Ho Chi Minh City / Binh Duong, Vietnam on 16th - 18th September 2015
10 Malaysian Technical Universities Conference on Engineering and Technology (MUCET) 2015 (Accepted)
CHAPTER 1
INTRODUCTION
Radio Frequency Identification (RFID) is an Automatic Identification and Data Capture (AIDC) wireless technology is used for real time identification and data collection of entities. It has been used since more than half century. Currently the RFID technology is most commonly used in toll collection, logistics, asset tracking and supply chain management. It has great potential to use in various applications.
Currently the enterprises are going towards advance RFID technology in place of barcode system. However, RFID is an enabling and promising technology, even though it has challenging issues of the optimal deployment of RFID network are tags coverage, interference, economic efficiency and load balance (Chen et al., 2011b). RFID network has multi-objective optimization functions, which can be solved by optimization algorithm. However, the RFID reader has limited communication range and high cost. It has been found that the RFID reader can easily integrate with XBee (ZigBee) wireless mesh network to increase communication range. RNP-XBee network can integrate with database connectivity and Internet of Things (IoT) to enhance business benefits by data sharing among enterprises.
1.1 Research Background
2
companies for a decade or more. It quickly gained attention because of its ability to track moving objects. As technology is refined, RFID tags are used in different works tends to spreading throughout.
RFID and barcode technologies are used for the same purpose, but the principle of operation is different and has various advantages. The advantages of RFID over barcode are that it can track through human body and non-metallic materials. It does not require direct orientation to scan. Moreover it can detect large number of items at the same time and is able to read in harsh and dirty environment. RFID tags have longer read range and large storage data as compared to the barcode tag and it can be writable to update the data at any time (Lehpamer, 2008).
The implementation of RFID system based upon network configuration. The RFID network planning (RNP) has some challenging issues that includes coverage, interference, economic efficiency and load balance. Before deploying RFID readers consider the basic requirement for achieving the optimized network such as minimum number of readers deployed at strategic placement and best suitable parameter setting for each reader (Chen et al., 2011b, Gong et al., 2012).
In this research particle swarm optimization algorithm was used innovatively for solving RNP issues by using multi-colony global particle swarm optimization (MC-GPSO) algorithm.
3
This research focuses on novel approach to solve RFID network planning (RNP) and to integrate with XBee (ZigBee) wireless network devices, database connectivity and IoT. It enhances the efficiency of supply chain management.
The benefit of integrated system is to increase the range of communication of RFID system by low cost XBee (ZigBee) network. It can provide accurate real time visible picture of items flow status at single platform and update the database during running operation. This information can share among networked organizations and it is useful to forecast the business benefits at each level of supply chain. It could control product loss or shrinkage. The system also has ability to significantly reduce the wastage in terms cost, expenditure, time and services which makes the organizations in supply chain green and sustainable.
1.2 Problem Statement
Mostly organizations use optical barcode technology for items scanning process, because barcode system can easy to implement, less expensive/economic and it takes few minutes to train the operator for scanning items. However, the barcode scanning system has some drawbacks e.g. It needs proper orientation for scanning by human intervention. Each item scan individually takes longer time and might be human error happened by missing of an item during scanning activity. Currently business enterprises are going towards advance RFID auto-ID technology for collecting the object movement data, which can cut labor cost significantly (Kao & Lee, 2011). There are various advantages of RFID over barcode technology in terms of accuracy, speed, quality and flexibility of operational strategy and it can scan multiple items at longer distance (Ferrer et al., 2010).
The implementation of RFID system based upon network configuration. It is difficult to implementation in any specific area. The basic issues of RNP include coverage, economic efficiency, interference and load balance (Irfan et al., 2012, Tsai & Lin, 2013, Nawawi et al., 2014). Before deploying the optimal reader network following queries are raised.
4
iii. What parameters are to be set for each reader?
The RFID network planning (RNP) is a multi-objective optimization problem (Lee, 2010), need to solve innovatively using optimization techniques to achieve the goal of optimum RFID network planning for sustainable competitive business benefits of enterprise operations focus on green supply chain management.
Due the limited communication range and high cost of RFID reader, it has been found that the RFID reader can easily integrate with XBee (ZigBee) wireless mesh network devices. This can increase the number of node placement and enhance the communication range of RFID reader (Sumi et al., 2009, Bolic et al., 2008).
The RNP-XBee integrated system is used to identify and data collection of items at longer distance. The collected data can be monitored and updated on real time basis at single control platform of LabVIEW database connectivity program (Elshayeb
et al., 2009). This data can be shared among other organizations, which are connected in to the global network by using IoT to enhance the optimal business benefits.
1.3 Aim and objectives of research
The aim of this research was to develop an optimal RFID network and to integrate with XBee (ZigBee) wireless network devices, database connectivity and IoT module, to achieve the competitive business benefits of green supply chain management by real time data exchange into the network organization. The specific objectives of this research are included:
i. To develop and implement multi-colony global particle swarm optimization algorithm for RNP issues.
ii. To integrate RNP with XBee wireless network devices.
5
1.4 Scope of the research
The scope of this research is wide aimed at enhancing business profits by improved supply chain cycle through updated data on commodities on trade and in transit. However solution of integrated RFID and XBee network will help:
i. Developing and implementing multi-colony global particle swarm optimization (MC-GPSO) algorithm for the solution of RNP issues.
ii. Developing the physical RFID-XBee wireless communication module for data collection of items and to communicate at longer distance.
iii. Developing a database connectivity module for RFID-XBee applications to monitor the data collection of items at single control platform.
iv. Develop an Internet of Things (IoT) module, which is used for data exchange to the business related organizations connected into the network to enhance business benefits.
1.5 Summary
The outline of this research begins with the introduction of RFID and its application. The background study is focused on supply chain management. On the basis of background study the problem statement has to be identified and establish the aims and objectives of research. Finally followed by scope of research is outlined to achieve the target of research outcomes.
The literature review is explained in Chapter 2, which describe the Auto-ID technology, shrinkage, the basics of RFID wireless communication system and its type (near field & far field), link budget and read range, path loss propagation model, optimization of RFID network planning by PSO, XBee (ZigBee) wireless mesh network and its application are introduced. At the end the research gap is defined.
6
application of MC-GPSO its operating procedure and their simulation results are explained.
CHAPTER 2
REVIEW OF LITERATURE
The real time information is the back bone of every supply chain; this can be achieved by Radio Frequency Identification (RFID) auto-ID wireless technology to meet the target of real time information exchange of enterprise operations. The numbers of organizations produce, distribute, handle or sell various goods. These organizations are exploring what RFID can do to improve operating efficiency, product quality, reduce inventory, shrinkage and bullwhip effect also drive additional revenue opportunities in supply chain (Bottani et al., 2010). Decreasing of tag cost has been widely recognized as the important factor influencing the widespread usage of RFID technology (Lin & Ho, 2009). The wide adoption of RFID across the supply chain will bring significant benefits leading to reduce operational costs and increase profits (Mueller & Tinnefeld, 2008). Many experts in financial matters suggested that, this will happen in following basic areas.
i. Reduced inventory and shrinkage
ii. Reduce labor expenses in store, warehouse and on shop floor to get benefit. iii. Minimize out-of-stock items
iv. Bullwhip effect
Various scientists are believed that the application of RFID technology would not be failed; if following issues are to be resolved.
i. Tag prices and efficiencies
ii. RFID standards must be harmonize,
8
v. Modification or change of work and labor practices vi. cost of deployment properly shared
vii. Privacy issues
[image:25.595.114.536.338.711.2]According to Alinean research, the new RFID projects could cut supply chain costs by 3-5% and achieve 2-7% increase in revenue. RFID provides accurate and real time visibility of entities in the supply chain. This can make every project as sustainable to get benefits on long term basis. On average basis, over 90% of projects need a formal business case justification in order to get approval of projects. RFID wireless technology gives promise of bottom-line positive business benefits and a tangible ROI (Pisello, 2006, de Souza et al., 2011) as shown in Table 2.1.
Table 2. 1: Tangible ROI as a bottom-line positive business benefits (Pisello, 2006)
Goal Typical Savings Tangible Benefits with Manufacturing Case Study
Productivity improved
through automation 18% improvement productivity $3.5M annual recurring labor cost savings Reduce
production-related expectations 21% expectations reduce in $8.4M annual recurring labor and cost avoidance Reduce purchase order
processing costs 30% improvement productivity $860,000 annual recurring productivity improvements/potential labor cost savings Inventory savings 10% inventory reduction (safety stock) $500,000 one-time working capital savings $55,000 annual recurring carry-cost reduction
Reduce inventory
scrap 45% write-off avoidance $40,000 in annual savings
Reduce days sales outstanding
8% days sales
outstanding (DSO)
improvement
$5.7M one-time accounts receivable working capital improvement
Reduce accounts
receivable disputes 40% dispute avoidance $2.3M annual write-down cost avoidance Improve net fixed asset
utilization 2-3% NFA utilization improvement $2M one-time working capital improvement Lost asset recovery 40% reduction in loss assets $25,000 annual recurring savings
Improve plant asset
maintenance 48% cost avoidance $75,000 annual recurring savings
Improve customer
satisfaction* 1.5% improvement in customer retention $1.5M annual recurring customer attrition and replacement cost avoidance
Over all project summary
Total investment: $17M
Net Present Value (NPV) of benefits: $26M
Project time span: 3 years
Return On Investment (ROI): 188%
Payback period: 11 months
9
2.1 Auto-ID Technology
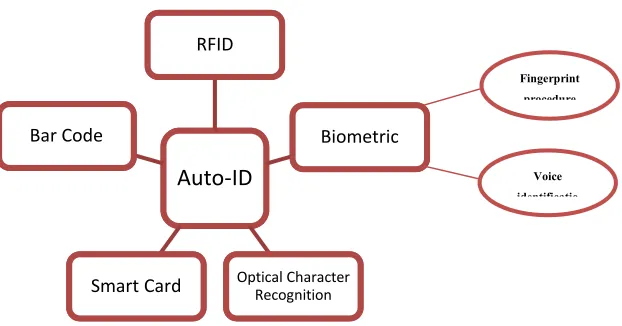
[image:26.595.181.492.273.436.2]Klaus, (2010), presented the Automatic Identification and Data Capture (AIDC) technologies are used for automatically identifying objects, data collection, and to transmit that data directly in to computer systems without human intervention. AIDC include the following technologies such as bar codes, biometrics, Optical Character Recognition (OCR), smart cards, and Radio Frequency Identification (RFID), (Su et al., 2007) as shown in Figure 2.1.
Figure 2.1: Important Auto-ID technologies (Klaus, 2010)
Automatic identification (Auto-ID) technologies are very popular at present; it provides information about, people, animals and items in transit. Among these identification technologies, barcode is the most widely used technology, because it has very low cost but it has some deficiencies i.e. (low storage capacity and cannot be reprogrammed and it need to be very close to optical reader for scanning).
However the RFID technology is superior to barcode technology because its user does not need to know where an object is and does not need to get close to scan it (Konsynski & Smith, 2003). Since RFID tags can be read at a distance and do not require line-of-sight, it can provide more applications across a supply chain; which holds a promise of significantly improving business operational efficiencies and increasing the visibility of business objects. It also reduces inventory and shrinkage.
10
Stanton, (2005) presented that the tags are just high-tech barcodes, attached to items to allow them to be tracked through the supply chain and make life easier at supermarket checkouts. The other technologies are either lack of automation capability or lack of ability to attach to business object.
A unified EPC and ISO, globally interoperable RFID standard is an ideal to earn the full benefits of RFID applications (Baars et al., 2008). But due to the lack of a complete security, privacy and unified RFID standard issues, it has caused many people and companies to hesitate in adopting the RFID system (Stanton, 2005, Jungbae
et al., 2009).
2.2 Shrinkage
The one of the major issues in the supply chain management is product loss or shrinkage. Radio-Frequency Identification (RFID) as an emerging technology has generated tremendous amount of interest in the supply chain domain to reduce the shrinkage. The shrinkage is the difference between recorded and actual inventory (Elshayeb et al., 2010). The loss of inventory is caused by some factors, including employee theft, shoplifting, administrative error, vendor fraud and damage in transit or in store and cashier errors that benefit the customer. According to the National Retail Security Survey, conducted by the University of Florida, shrinkage in the United States during 2009 represented 1.44% of retail sales (A. Kok et al., 2008). This percentage amounts to billions of dollars in lost inventory each year for U.S. retailers. Thus, security guards, security tags and cameras are used by retailers as an effort to reduce shrinkage.
2.3 Radio Frequency Identification (RFID) Systems
11
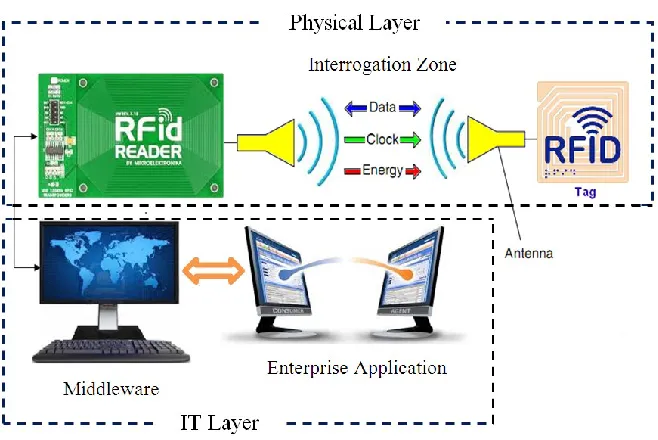
[image:28.595.156.485.368.588.2]tracking library books; to track assets in supply chain management (Landt, 2005, Sabbaghi & Vaidyanathan, 2008) describing the modality of this system. Dressen, (2004) mentioned that this system works on different radio frequencies such as LF, HF, UHF and Microwave based on its nature of utility. RFID has five basic components such as tag, reader, antenna, middleware and application software (Chuang & Shaw, 2007, Ahsan et al., 2010). The working principle of an RFID system as an electronic data carrier device “tag” is physically attached to the object having unique ID that is to be identified. In a remotely application, RFID reader transmit radio wave signals through antenna. Tags in the range of radio wave at a distance attached to the objects will transmit response back through an attached antenna to identify the object instantaneously (Asif, 2005). Then the collected data transmit to communication infrastructure (middleware) which update the information, finally sends information to the enterprise application according to the business requirements (Ahmed et al., 2014) as shown in Figure 2.2.
Figure 2.2: Typical RFID System ((Hasnan, et al., 2013)
RFID helped millions of people around the world to protect their property and make their workplaces secure. Its need for privacy issues that technology solves through this viable system has also been realized (Stanton, 2005).
12
current and predicted fields of application, as well as advantages, concerns and limitations of use explained. It is further advised that the RFID needs to be standardized in order to large-scale usage in the retail supply chain; this process is currently in progress. On the global front, two international bodies are involved: EPCglobalTM
(www.epcglobalinc.org) and the International Organization for Standardization (ISO) (www.iso.org) (Loebbecke, 2005).
Due to the numerous advantages of RFID systems as compared to other identification systems, RFID systems have super seated the mass markets.
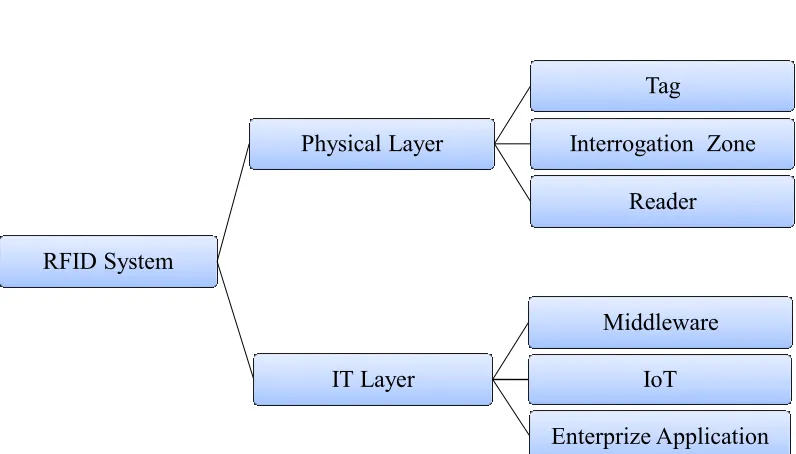
The RFID system is divided into two layers as shown in Figure 2.3. i. Physical layer
[image:29.595.122.520.295.522.2]ii. IT layer
Figure 2.3: RFID system layers (Karmakar, 2010)
2.3.1 Physical Layer
The physical layer comprises tag (transponder), reader (interrogator), and questioning zone or interrogation zone (IZ).
I. Tag (transponder)
RFID System
Physical Layer
Tag
Interrogation Zone
Reader
IT Layer
Middleware
IoT
13
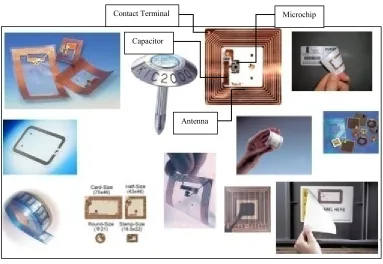
[image:30.595.129.512.315.579.2]Tag is a microprocessor chip, consists of an integrated circuit with memory and antenna. It is similar to the optical barcodes, which are attached to the items or case having unique identification. It can be grouped in to basic categories are Power source, memory type, operating frequencies, functionality, protocol, energy transfer and communication. It may be active (battery powered and proactively radio frequency signal) or passive (unpowered and reactively emitting a radio frequency signal). Bhattacharya et al., (2011), proposed that the information about object could be serial No; Model No. or other characteristics of object for identification purpose and distinguish from others or to track the movement of object e.g TAG = [Type of product | Subtype | Product-ID | Position | Date]. Various tags according to different application requirements are shown in Figure 2.4.
Figure 2.4: Various RFID Tags (Ahmed et al., 2013)
II. Reader (interrogator/transceiver)
RFID reader is a device which talks to tags. A reader may support one or more antennas; it can read and /or write data to an RFID tag (Su et al., 2007, Ngai et al., 2008, Grillmayer, 2013). Its types are hand held, vehicle mounted, post mounted and hybrid. The interfaces that connect the reader with the host computer are one or more
Microchip
Antenna Capacitor
14
of the following: USB, Ethernet, Wi-Fi, RS232, RS485, PCMCIA, and Compact Flash etc Su et al., (2007). Readers basically contain two components: the antenna and the interrogator circuitry. The antenna is used for communication with the tag using electromagnetic waves. Whereas the interrogator circuitry is a channel or negotiator between the reader antenna and the IT layer. Interrogator circuitry performs the task of sending data through the reader antenna and also receiving data and then sending it to the back end for processing. Interrogator circuitry also carries out an action of coordination between different reader antennas for the efficient and successful reading of tags.
III. Interrogation Zone (IZ)
According to Karmakar, (2010), the interrogation zone is the Euclidean space (three-dimensional physical space) between reader and tag where the electromagnetic (EM) wave is used for communication activity of reader reads/writes data from/to a tag. The basic characteristics of interrogation zone are defined in detail as follows.
2.3.2 Electromagnetic Propagation (Transmission)
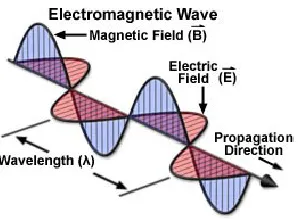
According to Hunt et al., 2007, Brown et al., 2007, Thornton & Sanghera, 2011, an electromagnetic wave propagates in the direction to the right angles with the vibrating electric and magnetic field vectors. It carries energy from its base station radiation source “RFID reader” to the tag. Figure 2.5 shows that the electric and magnetic fields are perpendicular to each other.
All electromagnetic waves travel at the same speed in vacuum, at the speed of light, 299,792,458 meters per second (m/sec). The speed of light is denoted by the lowercase letter c and is usually approximated to 3×10⁸ m/sec is used for all
15
Figure 2.5: Electromagnetic wave propagation (Brown, 2007)
The relationship of speed of electromagnetic waves (c), with frequency (f) and wavelength () is as follows;
𝑐 = × f (2.1)
As electromagnetic waves travel in 3D space, the same power is dispersed in all radial directions of the surface of sphere. The power density reduces as the wave travels away from the source. This phenomenon is called path loss. Figure 2.6 shows a transmitter antenna TX at the center of a sphere and a receiver antenna RX at the
surface of the sphere. The distance between the two antennas is “d”and the effective area of the receiver antenna is A.
𝑃𝑎𝑡ℎ 𝐿𝑜𝑠𝑠
=
𝑡𝑜𝑡𝑎𝑙 𝑎𝑟𝑒𝑎 𝑜𝑓 𝑠𝑝ℎ𝑒𝑟𝑒𝑅𝑥 𝑒𝑓𝑓𝑒𝑐𝑡𝑖𝑣𝑒 𝑎𝑟𝑒𝑎=
4.𝜋.𝑑𝐴 2 (2.2)The power density (PD) of a radio wave at a distance (d) from its source is inversely proportional to the square of the distance, or power attenuates with the square of the distance.
16
Figure 2.6: Electromagnetic wave path loss in free space (Dobkin, 2008)
2.3.3 Electromagnetic Waves (Radio Waves)
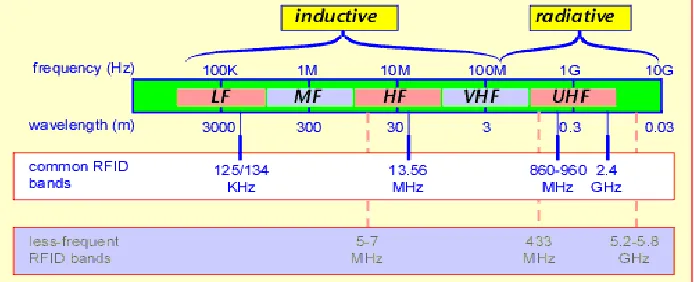
According to Dobkin, (2008) Radio waves are part of the electromagnetic spectrum. It has longest wavelength in the entire electromagnetic spectrum. The range of radio waves available at different frequencies bands include {LF (30kHz-300 kHz), HF (3MHz - 30MHz), UHF (300MHz - 1000MHz) and Microwave (1GHz - 6GHz)}.
RFID technology uses the radio waves among the available frequencies from LF (125 kHz -134 kHz), HF (13.56 MHz), UHF (433 MHz & 860 MHz -960 MHz) and Microwave (2.4 GHz to 5.8 GHz) as shown in Figure 2.7.
Figure 2.7: Electromagnetic wave (Dobkin, 2008)
RX
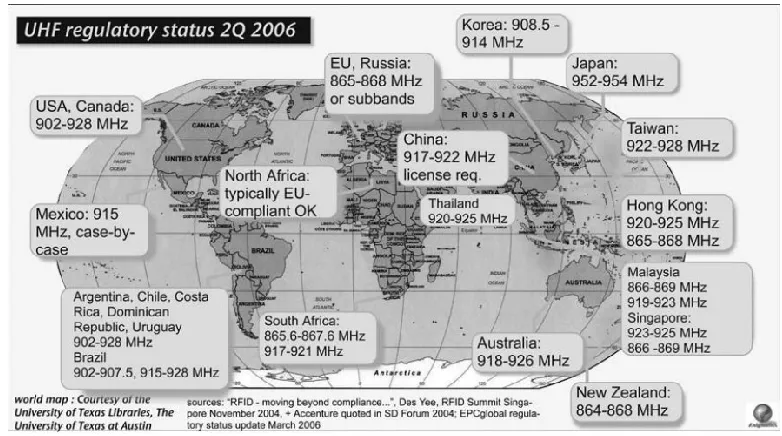
[image:33.595.148.495.511.652.2]17
An RFID system is working on different operating frequencies according to the region of the world located, as shown in Figure 2.8.
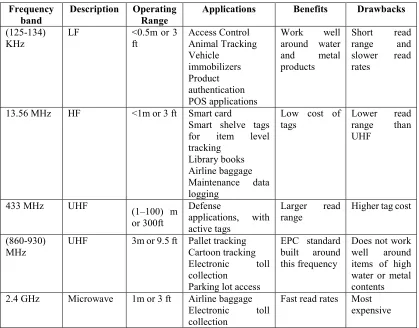
The selection of operating frequency of RFID readers and tags for specific application depends upon various parameters to be considered. These parameters are maximum read range (especially for passive tags), reading speed, sensitivity to water and humidity etc. Application of different operating frequency bands are illustrated in Table 2.2.
[image:34.595.124.515.298.516.2]When the radio waves travels in the medium, their signals are attenuated in different ways according to the objects properties in their path. The attenuation of signal strength is called path loss. The propagation of original signals will vary in their strength due to the objects in their path than the resultant (signal strength) received is reduced.
Figure 2.8: Summary of worldwide UHF band allocations (Dobkin, 2008)
18
Frequency
band Description Operating Range Applications Benefits Drawbacks
(125-134)
KHz LF <0.5m or 3 ft Access Control Animal Tracking Vehicle
immobilizers Product authentication POS applications
Work well
around water
and metal
products
Short read
range and
slower read rates
13.56 MHz HF <1m or 3 ft Smart card
Smart shelve tags for item level tracking
Library books Airline baggage Maintenance data logging
Low cost of
tags Lower range read than UHF
433 MHz UHF (1–100) m
or 300ft
Defense
applications, with active tags
Larger read
range Higher tag cost
(860-930) MHz
UHF 3m or 9.5 ft Pallet tracking
Cartoon tracking Electronic toll collection
Parking lot access
EPC standard built around this frequency
Does not work well around items of high water or metal contents
2.4 GHz Microwave 1m or 3 ft Airline baggage
Electronic toll collection
Fast read rates Most expensive
The signal strength quality and level is very important in the RFID system designing and application. It is measured in dBm or mW. It depends upon the distance between the transmitter (Tx) and receiver (Rx) (Dobkin, 2008). The power in dBm is the 10 times the logarithm of the ratio of actual Power/1 milliWatt.
The formulas are used to measure power in dBm and power in watt as follows. P(dBm) = 10 · log10( P(W) / 1mW )
P(W) = 1W · 10(P(dBm) / 10) / 1000
Where
P(dBm) = Power expressed in dBm (decibel milliwatts)
P(W) = the absolute power measured in Watts
mW = milliWatts
log10 = log to base 10
[image:35.595.112.531.69.397.2]The power calculated in dBm and milli-watt is shown in Table 2.3
19
The negative number is representing small value but it shows positive number on a logarithmic scale. In logarithms, the value indicated represents an exponent. for example, under a log 10 scale, a value of -1 represents 10 to the -1 power, which equals to 0.1. Similarly a value of -2 represents 10 to the -2 power, which equals to 0.01. In similar manner, a negative dBm means that a negative exponent in power calculations; 0 dBm equals 1 mW of power, so -10 dBm equals to 0.1 mW, -20 dBm equates to 0.01 mW, and so forth. a weak signal as -100 dBm equal to 0.0000000001 mW.
Radio signal propagates in the RFID system and is used as free space propagation. It is the short range communication system (Brown et al., 2007). For economic and technical reasons, the standard of spectrum is harmonized worldwide for regulating various aspects of radio spectrum use. There are two types of communication methods in RFID system relative to the frequency of operation and distance between reader and tag are near field or inductive coupling and far field or backscatter coupling (Karmakar, 2010).
P(dBm) P(mW)
Strong Transmitter
Sensitive Receiver
50 100000
40 10000
20
2.3.4 Near-Field/Inductive Coupling
Coupling is the full duplex communication or transfer of EM energy between reader and tag (Want, 2004). Near field is the three-dimensional space surrounded by an antenna, where the plane wave has not yet fully developed it is separated from the antenna. The magnetic field strength attenuates as inverse cube of the distance (∝1/ d3).
The distribution of waves in near field is fairly omni-directional, and the magnetic field strength is translated in to power available to the tag, the power attenuates is inversely proportional to the sixth power of the distance (d) from the antenna (∝1/ d6). The
energy transfer through shared magnetic field and frequencies of operation used are LF and HF of RFID tags (Brown et al., 2007). The boundary limit of near field communication or the range of outer edge depends upon frequency of operation and size of antenna. The transmission of energy fluctuates by change of current flow through “inductive coil.” in one device that induces current flow in the other device in a “push–pull” manner, and the antenna used as a transformer (Karmakar, 2010). The applications of RFID near field are item tagging, animal tagging, and library database management system etc.
2.3.5 Far-Field/Backscatter Coupling
21
This reflected EM wave, which is much smaller in magnitude compared to the incident wave, is detected at the reader antenna by means of a directional coupler/circulator and then amplified, decoded to extract the data sent by the tag. This kind of communication is prevalent in the UHF and microwave frequency ranges of passive RFID tags (Brown
et al., 2007). The communication efficiency depends on the size of antenna. If the largest physical linear dimension of antenna is greater than the wavelength, it will be the much higher efficient as compared to inductive coupling. It is found that if increase the power level consequently the communication read range increases between reader and tag.
[image:38.595.109.565.417.512.2]The region between the reactive near field and the far field is a transition region and is known as the “radiating near field (or Fresnel region)” where the reactive field becomes smaller than the radiating field. All three field regions are summarized in Table 2.4 and shown in Figure 2.9 (Huang & Boyle, 2008).
Table 2.4: Conditions of Near-field and far-field region (Huang & Boyle, 2008)
Antenna size D D << D ≈ D >>
Reactive near field d < / 2 d < / 2 d< / 2
Radiating near field / 2 < d< 3 / 2 < d< 3 and 2D2/ / 2 < d < 2D2/
Far field d > 3 d > 3 and 2D2/ d > 2D2/
Where
22
Figure 2.9: Radiated field regions of an antenna having maximum dimension D
2.3.6 Link Budget and Read Range
Link budget calculation in wireless communications specifies the power budgeting for the transmitter and receiver, the antenna gain, and effective isotropic radiated power (EIRP) of the reader antenna to obtain a certain link distance (reading range). The link budget helps to calculate the required antenna gain and related specification to obtain a robust and viable communication in the specific conditions of wireless communications. The communication from the reader to the tag is called the “downlink” and the communication from the tag to the reader is called the “uplink”.
23
and thereby, depending on the sensitivity of the components, determines the distance at which reliable communication can take place between the tag and the reader in any RFID system. Factors like noise floor, cable losses and free space losses are taken into account in calculating the link budget (Brown et al., 2007, Karmakar, 2010).
2.3.7 Path loss propagation Model
In every RFID system it is important decision to select path loss propagation model. It is defined as the difference between the transmitted power form source antenna and the received power at receiver antenna. The propagation model can calculate the estimation of coverage area of RFID reader accurately.
The signals are attenuated by the distance between the reader and tag, interference from adjacent readers and obstacles in the system. The most common path loss propagation models and their parameters are shown in Figure 2.10.
These models are grouped on the basis of downlink or the uplink communication channels. For the downlink channel the free space, two-ray and
24
Figure 2.10: Path Loss Propagation Models (Huang & Boyle, 2008)
2.3.8 Free space propagation Model
The communication between Tx antenna and Rx antenna in Free Space (FS) propagation model takes direct Line of Sight (LoS). The FS propagation model is desirable for outdoor RF communications without obstacles in the environment. It also can be used in an indoor environment in the far-field region. The signal power at the receiving antenna is calculated by Friis's transmission equation as shown in equation.
𝑃
r= 𝑃
𝑡× 𝐺
𝑡× 𝐺
𝑟× (
4 𝑑)
2 2.3d
=
𝑐 𝑓 ⁄
4√𝑃r/𝑃𝑡×𝐺𝑡×𝐺𝑟 2.4
Where
= signal wavelength (m) c = Speed of light (m/s)
126
REFERENCES
Abinaya, T., & Bharathi, M. (2012). Enhancement of RFID through ZigBee Networks.
International Conference on Computing and Control Engineering (ICCCE 2012), 1-5
Agarwal, M., Vyas, M., & Sharma, R. (2013). A study of ZigBee technology.
International Journal on Recent and Innovation Trends in Computing and Communication, 1(4), 287–292
Ahmed, A., Hasnan, K., Aisham, B., & Bakhsh, Q. (2013). Integration of Value Stream Mapping with RFID, WSN and ZigBee Network. Applied Mechanics and Materials, 465-466, 769–773
Ahmed, A., Hasnan, K., Aisham, B., & Bakhsh, Q. (2014). Impact of RFID and Xbee Communication Network on Supply Chain Management. Applied Mechanics and Materials, 660, 983–987
Ahsan, K., Shah, H., & Kingston, P. (2010). RFID applications: An introductory and exploratory study. IJCSI International Journal of Computer Science Issues IJCSI International Journal of Computer Science Issues, 7(1), 1–7
Alliance, Z. (2007). ZigBee and wireless radio frequency coexistence. White Paper Antonio, S. (2009). Algorithm and Swarm Intelligence. Proceedings of the 2009 IEEE
International Conference on Systems, Man, and Cybernetics, 1201–1208.
Asif, Z. (2005). Integrating the supply chain with RFID: A technical and business analysis. Communications of the Association for Information, 15, 393–427 Baars, H., Kemper, H.-G., Lasi, H., & Siegel, M. (2008). Combining RFID Technology
127
Balanis. C.A (2005). Antenna Theory Analysis and Design. (3rd Edition, pp. 1–24). John Wiley & Sons Inc.
Bansal, J. C., Singh, P. K., Saraswat, M., Verma, A., Jadon, S. S., & Abraham, A. (2011). Inertia Weight Strategies in Particle Swarm, Third World Congress on Nature and Biologically Inspired Computing, 640–647
Barton, R., & Thomas, A. (2009). Implementation of intelligent systems, enabling integration of SMEs to high-value supply chain networks. Engineering Applications of Artificial Intelligence, 22(6), 929–938
Bhattacharya, I. (2011). Tracking and Monitoring of Tagged Objects employing Particle Swarm Optimization algorithm in a Departmental Store. IIUM Engineering Journal, 12(1), 1–12
Bhattacharya, I., & Roy, U. K. (2010). Optimal Placement of Readers in an RFID Network Using Particle Swarm Optimization. International Journal of Computer Networks & Communications, 2(6), 225–234
Botero, O., & Chaouchi, H. (2011). RFID network topology design based on Genetic Algorithms. IEEE International Conference on RFID-Technologies and Applications, 300–305
Bottani, E., Montanari, R., & Volpi, A. (2010). The impact of RFID and EPC network on the bullwhip effect in the Italian FMCG supply chain. International Journal of Production Economics, 124(2), 426–432
Brown, M. Patadia, S. Dua, S. (2007). Comptia RFID+ certification, Mc Graw Hill Chen, H., & Zhu, Y. (2008). RFID Networks Planning Using Evolutionary Algorithms
and Swarm Intelligence. 4th International Conference on Wireless Communications, Networking and Mobile Computing, 1–4
Chen, H., Zhu, Y., & Hu, K. (2009). RFID networks planning using a multi-swarm optimizer. Chinese Control and Decision Conference, 3548–3552
Chen, H., Zhu, Y., & Hu, K. (2010). Multi-colony bacteria foraging optimization with cell-to-cell communication for RFID network planning. Applied Soft Computing, 10(2), 539–547
128
Chen, H., Zhu, Y., Hu, K., & Ku, T. (2011b). RFID network planning using a multi-swarm optimizer. Journal of Network and Computer Applications, 34(3), 888– 901
Cho, H., Kim, J., & Baek, Y. (2011). Large-scale active RFID system utilizing ZigBee networks. IEEE Transactions on Consumer Electronics, 57(2), 379–385
Chuang, M. L., & Shaw, W. (2007). RFID: Integration Stages in Supply Chain Management. IEEE Engineering Management Review, 35(2), 80–87
Curtin, J. F., & Huckaby, R. W. (2008). Sustainability Within the Supply Chain.
eJournalUSA, 13(3), 29-31
Darla, S. P., Naiju, C. D., Annamalai, K., & Sushanth, S. S. R. (2012). Particle Swarm Optimization Based Genetic Algorithm for Two-Stage Transportation Supply Chain. World Academy of Science, Engineering and Technology, 6(3), 121–125 De Souza, R., Goh, M., Sundarakani, B., Wai, W. T., Toh, K., & Yong, W. (2011).
Return on investment calculator for RFID ecosystem of high tech company.
Computers in Industry, 62(8-9), 820–829
Dobkin, D. M. (2008). The RF in RFID: Passive UHF RFID in practice. Elsevier Inc. Dominikus, S., & Schmidt, J. (2011). Connecting passive RFID tags to the Internet of
Things. Interconnecting Smart Objects with the Internet, 1–3
Dressen, D. (2004). Consideration for RFID Technology Selection. Atmel Applications Journal, 45–47
Eberhart, R. C., & Shi, Y. (2000). Comparing inertia weights and constriction factors in particle swarm optimization. Proceedings of the Congress on Evolutionary Computation., 1(7), 84–88
Elshayeb, S. A., Hasnan, K. Bin, & Yen, C. Y. (2009). RFID technology and ZigBee networking in improving supply chain traceability. International Conference on Instrumentation, Communication, Information Technology, and Biomedical Engineering, 1–3
129
Feng, F., Shengyu, H., & Qi, X. (2010). The Research of the ZigBee and RFID Fusion Technology in the Coal Mine Safety. Information Management, Innovation, 32– 36
Feng, H., & Qi, J. (2012). Optimal RFID networks planning using a hybrid evolutionary algorithm and swarm intelligence with multi-community population structure, 14th International Conference on Advanced Communication Technology (ICACT), 1063–1068
Ferrer, G., Dew, N., & Apte, U. (2010). When is RFID right for your service?
International Journal of Production Economics, 124(2), 414–425 Garcia, R. (2006). Understanding the ZigBee stack. EE Times Asia, 1-2
Giampaolo, E. Di, Fornì, F., & Marrocco, G. (2010). RFID-Network Planning by Particle Swarm Optimization. Proceedings of the Fourth European Conference on Antennas and Propagation (EuCAP), 1–5.
Gong, Y., Shen, M., Zhang, J., (2012). Optimizing RFID Network Planning by Using a Particle Swarm Optimization Algorithm With Redundant Reader Elimination.
IEEE Transactions on Industrial Informatics, 8(4), 900–912.
Grillmayer, L. (2013). Radio-Frequency Identification-Overview. Innovative Internet Technologies and Mobile, 25–33
Hasnan, K., Ahmed, A., Sani, W., & Bakhsh, Q. (2013). Optimization of RFID real-time locating system. Australian Journal of Basic and Applied Sciences, 8(4), 662–668
Huang, Y., & Boyle, K. (2008). Antennas: from theory to practice (1st Edition). John Wiley & Sons Ltd.
Hunt, V., Puglia, A., & Puglia, M. (2007). RFID: a guide to radio frequency identification, John Wiley & Sons, Ltd.
Ilie-zudor, E., Kemény, Z., Egri, P., & Monostori, L. (2006). The RFID Technology and its current applications, In proceedings of The Modern Information Technology in the Innovation Processes of the Industrial Enterprises, 29–36 Irfan, N., Yagoub, M. C. E., & Hettak, K. (2011). Genetic algorithm based efficient tag
130
Irfan, N., Yagoub, M., & Hettak, K. (2012). Efficient approach for redundant reader elimination for directional antenna in RFID networks. Journal of RFID Security, 1, 74–81
Jungbae, J., Kunnathur, A., & Tarafdar, M. (2009). Information & Management Classification of RFID adoption : An expected benefits approach. Information & Management, 46, 357–363
Kao, Y., & Lee, C. (2011). Use of Artificial Immune Systems to Optimize the Reader Antenna Placement at an RFID Portal. IEEE International Conference on Nano, Information Technology, 58–63
Karmakar, N. C. (2010). Handbook of Smart Antennas for RFID. John Wiley & Sons, Ltd.
Klaus, F. (2010). RFID handbook: Fundamentals and applications in contactless smart Cards, Radio Frequency Identification and Near-Field Communication, John Wiley & Sons, Ltd.
Kok, A. G., van Donselaar, K. H., & van Woensel, T. (2008). A break-even analysis of RFID technology for inventory sensitive to shrinkage. International Journal of Production Economics, 112(2), 521–531
Konsynski, B., & Smith, H. A. (2003). Developments in Practice X : Radio Frequency Identification ( RFID ) - An Internet for Physical Objects. Communications of the Association for Information Systems, 12, 301-311
Krigslund, R., Popovski, P., Pedersen, G. F., & Olesen, K. (2012). Interference Helps to Equalize the Read Range and Reduce False Positives of Passive RFID Tags.
IEEE Transactions on Industrial Electronics, 59(12), 4821–4830 Landt, J. (2005). The history of RFID. IEEE Potentials, 8–11
Lee, C. C. (2010). Maximizing Read Accuracy by Using Genetic Algorithms to Locate RFID Reader Antennas at the Portals. Journal of Software, 5(12), 1323–1326 Lehpamer, H. (2008). RFID Design Principles. Artech House, Inc.
Lin, L. C. (2009). An integrated framework for the development of radio frequency identification technology in the logistics and supply chain management.
Computers & Industrial Engineering, 57(3), 832–842
131
Loebbecke, C. (2005). RFID Technology and Applications in the Retail Supply Chain : The Early Metro Group Pilot. 18th Bled eConference eIntegration in Action, 1– 11
Ma, L., Chen, H., Hu, K., & Zhu, Y. (2014). Hierarchical artificial bee colony algorithm for RFID network planning optimization. TheScientificWorldJournal, 2014, 1–21
Mueller, S., & Tinnefeld, C. (2008). Using RFID to Improve Supply Chain Management. New Age Marketing: Emerging Realities, 1-12
Nawawi, A., Hasnan, K., & Bareduan, S. A. (2014). Correlation between RFID Network Planning ( RNP ) Parameters and Particle Swarm Optimization ( PSO ) Solutions. Applied Mechanics and Materials, 465-466, 1245–1249
Ngai, E. W. T., Moon, K. K. L., Riggins, F. J., & Yi, C. Y. (2008). RFID research: An academic literature review (1995–2005) and future research directions.
International Journal of Production Economics, 112(2), 510–520
Niu, B., Fan, Y., Xiao, H., & Xue, B. (2012). Bacterial foraging based approaches to portfolio optimization with liquidity risk. Neurocomputing, 1–11
Niu, B., Wong, E. C., Chai, Y., & Li, L. (2009). RFID Network Planning Based on MCPSO Alogorithm. Second International Symposium on Information Science and Engineering, 8–12
Pisello, T. (2006). Shrinking the supply chain expands the return: the ROI of RFID in the supply chain. Orlando, FL, Alinean White Paper, (August) 1-16
Ruan, Q., Xu, W., & Wang, G. (2011). RFID and ZigBee based manufacturing monitoring system. International Conference on Electric Information and Control Engineering, 1672-1675
Sabbaghi, A., & Vaidyanathan, G. (2008). Effectiveness and efficiency of RFID technology in supply chain management: Strategic valúes and challenges. Journal of Theoretical and Applied Electronic Commerce Research, 3(2), 71–81
132
Soon, C., & Gutiérrez, J. A. (2008). Effects of the RFID Mandate on Supply Chain Management. Journal of Theoretical and Applied Electronic Commerce Research, 3(1), 81–91
Stanton, R. (2005). RFID – Ripe For Informed Debate. Computer Fraud & Security, 12-14
Su, X., Chu, C., Prabhu, B. S., & Gadh, R. (2007). On The Creation of Automatic Identification and Data Capture Infrastructure via RFID. Pervasive Networked Systems, 1–19
Sumi, M., Soujeri, E., Rajan, R., & Harikrishnan, A.I, (2009). Design of a ZigBee based RFID network for industry applications. Proceedings of the 2nd International Conference on Security of Information and Networks - SIN ’09, 111–116
Sung, W.-T., & Hsu, Y.-C. (2011). Designing an industrial real-time measurement and monitoring system based on embedded system and ZigBee. Expert Systems with Applications, 38(4), 4522–4529
Thornton, F., & Sanghera, P. (2011). How to Cheat at Deploying and Securing RFID. Syngress Publishing, Inc. Elsevier, Inc.
Tsai, H., & Lin, S. (2013). Genetic Algorithm for Reader Network Planning Problem.
Proc. of the Second Intl. Conf. on Advances in Computing and Networking —
ACN 2013, 16, 978–981
Turcu, C. (2010). Radio Frequency Identification Fundamentals and Applications, Design Methods and Solutions. Intech.
Want, R. (2004). Enabling ubiquitous sensing with RFID. Computer, 37(4), 84–86 Want, R. (2006). An Introduction to RFID Technology. PERVASIVE Computing, 25–
33
Yang, Y., Wu, Y., Xia, M., & Qin, Z. (2009). A RFID Network Planning Method Based on Genetic Algorithm. International Conference on Networks Security, Wireless Communications and Trusted Computing, 534–537