Journal of Chemical and Pharmaceutical Research, 2015, 7(10S):165-173
Research Article
CODEN(USA) : JCPRC5
ISSN : 0975-7384
Optimization of process parameters for the removal of calcium ions by ion
exchange process
E. Paulsamy
1, P. Ayyappan
2and R. K. Seenivasan*
31Department of Chemistry, Raja College of Engineering and Technology, Madurai, Tamil Nadu, India 2
Department of Botany, Government Arts College, Melur, Madurai Dist, Tamil Nadu, India
3Department of Chemistry, Government Arts College, Melur, Madurai Dist, Tamil Nadu, India
_____________________________________________________________________________________________
ABSTRACT
Optimisation of process parameters for the removal of calcium ions by phenol-formaldehyde sulphonic acid resin (PFR) blended with sulphonated carbons (SCs) obtained from various plant materials like AA, EJ and TB was carried out by using Box-Behnken statistics and analysis of variance method. Response surface methodology with three levels of process parameters viz., % (w/w), of SC in condensate (10, 20 and 30), particle size (200, 300 and 400 µm or microns) and initial concentration of calcium ions (0.05, 0.1 and 0.15 mol L-1) were used in the identification of significance of the effects and interactions in ion exchange studies. Response surface methodology requires no assumption and identifies the experimental variables and their interactions which have the greatest effect on ion exchange process. The optimum process parameters for maximum removal of calcium ions were obtained by this procedure. Contour plots were obtained and interpreted.
Key words: Optimisation of process parameters, phenol-formaldehydesulphonic acid resin, sulphonated carbons,
plant materials, Box-Behnken statistics Response surface methodology, Multiple linear regression analysis.
_____________________________________________________________________________________________
INTRODUCTION
______________________________________________________________________________
and to find out the optimum conditions of process parameters for the effective / maximum removal of calcium ions, by ion exchange process.
Sulphonated carbons (SCs) prepared from plant materials containing phenolic groups have been blended in 10, 20 and 30% (w/w) ratio with PFR resin. The resultant condensates were tried as low-cost IERs for the removal of calcium ions. Among the various PFR-SCs, the blends of PFR-SC derived form plants EJ(Eugenia jambola Lam.,) and TB (Terminalia bellrica Roxb.,) are found to be the best low-cost material for the removal of metal ions[4] with high and moderate CEC values while the one derived from AA (Achyranthes aspera Linn.,) has least CEC value. Thereofore they are used in the present study. Ion exchange process becomes highly effective, only when the optimum process parameters are employed. This necessitates the study of optimisation of process parameters for the removal of metal ions like calcium ions by ion exchange process with the low-cost IERs obtained by blending 10, 20 and 30% (w/w) of SC derived from AA, TB and EJ with that of PFR. With this aim, and objectives the present study has been carried out.
The effect of several critical factors influencing the ion exchange process of calcium ions, such as the % (w/w) of SC in the condensate, particle size and initial concentration of calcium ions, has been studied. Box-Behnken factorial design[14] with three variables like, %(w/w) of SC in condensate (x1 = 10, 20, 30), particle size (x2 = 200, 300 and
400 µm) and initial concentration of Ca2+ ions (x3 = 0.05, 0.10 and 0.15M) for the removal of calcium ions with
IERs at three different levels (-1, 0 and +1) was studied to identify a significant correlation between the cation exchange capacity (CEC) of IERs for the removal of calcium ions (y = CEC in m mol g-1) and the effect of changing these variables(x1, x2 and x3). CEC in m mol g-1 (y) values were determined at the experimental conditions
employing Box-Behnken design of experiments.
The determination of optimum experimental conditions for the above mentioned process parameters [% (w/w ) SC, initial concentration and particle size] would require large number of experiments with all possible combinations of these parameters. However, it is possible to undertake experiments with a rational design, which reduces the number of experiments and broadens the range of information about the system[15, 16]. The parameters such as % (w/w) of SC in condensate, particle size and initial concentration of Ca2+ ions have been considered as the critical variables. Statistical design was used to determine the optimal levels of ion exchange under a given set of experimental conditions.
The usual classical type of optimisation technique involves changing one variable at a time, while keeping the other variables as constants at fixed condition. Being single dimensional, it often does not generate the exact prediction of optimum conditions. Hence, the need of factorial design and the response surface methodology has been understood for the simultaneous optimistaion of process parameters and employed in the present study.
MATHEMATICAL MODEL
Response surface methodology is purely an empirical modelisation technique devoted to the evaluation of the relationship of a set of controlled process or experimental factors (x1, x2 and x3) and the observed result (viz., y =
CEC, in m mol-1 g-1) for the removal of Ca2+ ions by ion exchange process[4]. It requires a prior knowledge of the effect of these process parameters and their impact on CEC.
Basically this optimisation process involves three major steps. They are:
• performing the statistically designed set of experiments
• estimating the co-efficients in a mathematical model and
• predicting the response and checking adequacy of the model
The significant process parameters like % (w/w) of SC in condensate particle size and initial concentration of Ca2+ ions were chosen as the critical variables and designated as x1, x2 and x3, respectively. The low, middle and high
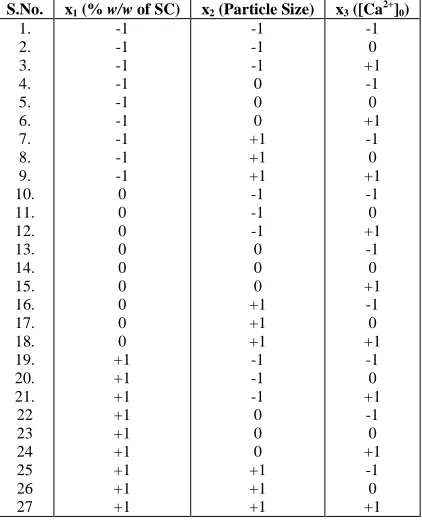
levels of each variable were coded as –1, 0 and +1. The actual values of % (w/w) of SC in condensate, particle size and initial concentration of Ca2+ ions used in the experiment and the codes are given in Table 1. The actual design of experiments is shown in Table 2. Totally 27 number of ion exchange adsorption experiments were carried out at 30 ±1oC as per the conditions of experiments which are given in Table 2.
Table 1 Critical variables of process (experimental) parameters for ion exchange process
S.No. Variable xi -1 0 +1
1 2 3
% (w/w) of SC in condensate Particle size (µm)
[Ca2+ ]
0 ions ( M)
x1
x2
x3
10 200 0.05
20 300 0.10
Table 2 Experimental condition for the ion exchange studies of calcium ions*
S.No. x1 (% w/w of SC) x2 (Particle Size) x3 ([Ca2+]0)
1. 2. 3. 4. 5. 6. 7. 8. 9. 10. 11. 12. 13. 14. 15. 16. 17. 18. 19. 20. 21. 22 23 24 25 26 27 -1 -1 -1 -1 -1 -1 -1 -1 -1 0 0 0 0 0 0 0 0 0 +1 +1 +1 +1 +1 +1 +1 +1 +1 -1 -1 -1 0 0 0 +1 +1 +1 -1 -1 -1 0 0 0 +1 +1 +1 -1 -1 -1 0 0 0 +1 +1 +1 -1 0 +1 -1 0 +1 -1 0 +1 -1 0 +1 -1 0 +1 -1 0 +1 -1 0 +1 -1 0 +1 -1 0 +1
*Code for x1, x2 and x3 as given in Table 1.
The effect of these three variables (x1, x2, and x3) on CEC(y) can be approximated by the quadratic (second degree)
polynomial (Multiple Linear Regression – MLR) model / equation is) :
y = C0 + C1 x1 + C2 x2 + C3 x3 + C11 x12 + C22 x22 + C33 x32 + C12 x1 x2
+C13 x1 x3 + C23 x2 x3
(R = __________; 100R2 = ___________; S= ______________) … (i)
Where, y is the experimental / predicted response (y = CEC, in m mol g-1), x1 is the % (w/w) of SC in condensate, x2
is the particle size, in micron and x3 is the initial concentration of Ca2+ ions in mol L-1 (as their coded data); x12 and
x13 are the cross products of parameters, x11 and x22 are square products of parameters; C11 and C22 are coefficients
of square terms, C12 are coefficients of the cross terms; C1, C2 and C3 are linear coefficients; C0 is constant; R is
correlation coefficient for MLR model, 100R2 is percent variation explained by a set of explanatory variables and ‘S’ is standard error of the estimate. MLR model given in the above equation (Eqn.i), interactions which are higher than the first order have been neglected. The design of experiments is preferred because relatively few experimental combinations of the variables are adequate to estimate potentially complex response function[14]. The set of experiments chosen for this study was based on Box-Behnken statistics[15,16] - a fractional factorial design for three independent variables. It is applicable to the system only when the critical variables have been identified [14].
EXPERIMENTAL SECTION
Materials and method
Phenol and formaldehyde used were of Fischer reagents (India). LR grade of con. sulphuric acid (Sp. gr. = 1.82) was used. Sulphonated carbons (SCs) obtained from plant materials viz., Eugenia jambolana, Lam. (EJ), Terminalia bellarica, Roxb.(TB) and Achyranthes aspere, Linn.,(AA), which were the locally available plants in southern part of India, especially in Tamil Nadu. These plant materials were cleaned, dried and cut into small pieces of about 0.5 cm length.
Preparation of sulphonated carbons
______________________________________________________________________________
STBC(sulphonated Terminalia bellarica, Roxb carbon) and SAAC(sulphonated Achyranthes aspere, Linn., carbon), respectively for the SCs prepared from EJ, TB and AA.
Preparation of pure phenol formaldehyde resin
Con. sulphuric acid (12.5 mL) was slowly added to phenol (10 mL) in drop-wise with constant stirring by placing it in an ice-bath at 0 – 5oC. The mixture was heated at 70oC for 3 h in a hot air-oven, then cooled immediately in an ice-bath and kept overnight. It was then polymerised with formaldehyde (11.5 mL) at 80oC and the product was cured in a hot air-oven for 3 h. A brown coloured chunky solid mass was obtained[17]. It was then ground, washed with distilled water and finally with DD water to remove excess free acid, dried, sieved (210 – 300µm size) using Jayant sieves(India) and preserved for further studies. It was labeled as PFR.
Preparation of condensate
A known amount of phenol was sulphonated with con. sulphuric acid by the above method to produce phenolsulphonic acid. Then, it was mixed with various percentage by weight of sulphonated carbons (SCs) obtained from various plant materials (EJ, TB, and AA) in the condensate as 10, 20, and 30, respectively.
Each mixture was polymerised with formaldehyde solution (11.5 mL) at 80oC and the product was cured in a hot air-oven for 3 h. A brown chunky solid mass was obtained which was ground washed, dried and preserved for characterisaiton for the further studies. The product with 10, 20 and 30 % (w/w) of SCs obtained from various plant materials EJ, TB and AA in the condensate, were respectively labeled as A, B and C for each condensate with SEJC, STBC and SAAC.
Cation exchange capacity
A known weight (2 g) of the samples of condensate/ low - cost IERs were converted into H+ form by washing it with 2M HCl acid, and washed with distilled water and finally rinsed with DD water in order to remove excess free acid (tested with AgNO3 solution). The test column was prepared by using graduated burette with glass-wool plug
and the slurry of washed resin sample. Forty mL of 0.1 M solution of calcium ions of known initial concentration (C0 = 0.05, 0.10 and 0.15 M) was used as influent. The rate of flow of effluent was adjusted to 1 mL min-1. The low
- cost IER samples exchanged its H+ ions with the Ca2+ ions – a hardness producing ions. The total amount of cation exchanged was determined by using the standard titration techniques[18]. The values of cation exchange capacity(CEC) were determined as per the literature method[19]. The error in the values of y = ±0.002 – 0.003 m mol-1 g-1. All the multiple linear correlations and contour plots were drawn using computer.
RESULTS AND DISCUSSION
MLR Model
Ion exchange process results in the removal of solutes (metal / calcium ions) from aqueous solution and their concentration at the surface of the solid (condensate) and in solution are in dynamic equilibrium. At this position of equilibrium there is a defined distribution of solute between the liquid and solid phases. The CEC of calcium ions was found to be poorly correlated with any one of these process parameters, x1, x2 and x3 [ x1 = % (w/w) of SC in
condensate : r = 0.143 – 0.167 ;, x2 = particle size, in µm : r = 0.003 – 0.096: and x3 = initial concentration of Ca2+
ions in M: r =0.800 – 0.824]. Multiple Linear Regression (MLR) analysis, involving x1, x2 and x3, simultaneously,
resulted in a three parameter equation, of the type: y = c0 + c1x1 + c2x2 + c3x3, (Where x= process parameter,
c1=regressopm cp-effocoemt amd c0= constant) which were noted to be slightly better than the single parameter
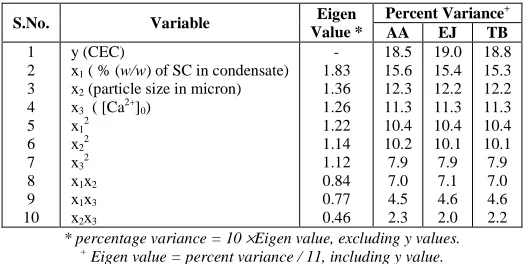
Table 3 Analysis of variance of process parameters for the removal of Ca2+ ions by ion exchange process
S.No. Variable Eigen Value *
Percent Variance+
AA EJ TB
1 2 3 4 5 6 7 8 9 10
y (CEC)
x1 ( % (w/w) of SC in condensate)
x2 (particle size in micron)
x3 ( [Ca2+]0)
x12
x22
x32
x1x2
x1x3
x2x3
- 1.83 1.36 1.26 1.22 1.14 1.12 0.84 0.77 0.46
18.5 15.6 12.3 11.3 10.4 10.2 7.9 7.0 4.5 2.3
19.0 15.4 12.2 11.3 10.4 10.1 7.9 7.1 4.6 2.0
18.8 15.3 12.2 11.3 10.4 10.1 7.9 7.0 4.6 2.2
* percentage variance = 10 ×Eigen value, excluding y values.
+
Eigen value = percent variance / 11, including y value.
MLR analysis was performed to obtain the coefficients from the experimental results viz., CEC, in m mol-1 g-1 (y values) for the set of statistically designed experiments based on Box-Behnken design of experiments. MLR equations obtained between CEC process parameter of various condensate obtained by blending PFR with various % (w/w) of SCs prepared from various plant materials AA, EJ and TB could be used to predict the response [equations (ii) to (iv)] :
MLR equations:
AA:
yAA = 1.291 – 0.0599x1 – 0.0405x2 + 0.346x3 – 0.0598x1x1 – 0.271x3x2 – 211x3x3 + 0.0668x1x2 – 0.0705x2x3 –
0.0159x3x1
(R = 0.988, 100R2 = 97.61, S = 0.00449) …. …. …. (ii)
EJ:
yEJ = 1.597 – 0.070x1 + 0.00844x2 + 0.372x3 – 0.122x1x1 – 0.272x3x2 –0.318x3x3 + 0.0363x1x2 – 0.0429x2x3 –
0.0247x3x1
(R = 0.984, 100R2 = 96.83, S = 0.00722) …. ….…. …. (iii)
TB:
yTB = 1.565 – 0.0739x1 – 0.00178x2 + 0.3637x3 – 0.1132x1x1 – 0.2556x2x2 –0.2754x3x3 + 0.0305x1x2 – 0.0423x3x3 –
0.00233x3x1
(R = 0.986, 100R2 = 97.22, S = 0.00573) …. …. …. (iv)
Theoretically calculated value using MLR eqns. (ii) to (iv)
Quadratic regression equations (ii) – (iv) are found to be statistically significant at 95% confidence level (CL) while the MLR equations with these three variables x1, x2 and x3 alone are significant only at 80% CL indicating the
combined effect of the % (w/w) of SC in the condensate, particle size and initial concentration (concn.) Ca2+ ions (xi)
and their square (x11 or x22 ) and cross products (x12).
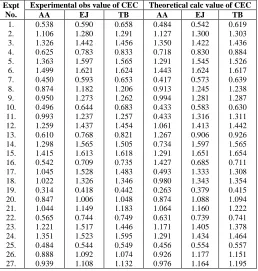
The percent variance obtained from the factor analysis of all the dependent (explanatory) variables, its square term and cross products, including and excluding the independent variable (y = CEC) are presented in Table 3. The percent variance of the variables will give an idea about the significance of each variable and its contribution in explaining the observed experimental results (y values). The predicted/ calculated values of CEC of the condensate from the equations (ii) to (iv) at each set of experimental conditions(ycal) are also summarised in Table 4, along with
the experimentally observed values of CEC (yobs).
The values of correlation coefficient( R) for the MLR equations (ii) to (iv) are found to be in the range of 95% CL and the correlations are statistically significant, which indicate that there should be a close agreement between the experimental (yobs) and theoretical values of CEC (ycal). The simulated values of ycal by the equations (ii) to (iv) are
found to be in close agreement with that of the experimental Yobs values(Table 4). The applicability of the model
was verified by plotting the calculated values of CEC (ycal) against the experimental (Yobs) values (Fig 1). Values of
slope (m, range = 0.972 – 0.975) are computed by correlating the ycal values with yobs and are reported in Table 5,
______________________________________________________________________________
Table 4 Experimentally observed and theoretically calculated values of CEC for the removal of Ca2+ ion by IERs obtained by SCs
prepared from plant materials
Expt No.
Experimental obs value of CEC Theoretical calc value of CEC
AA EJ TB AA EJ TB
1. 2. 3. 4. 5. 6. 7. 8. 9. 10. 11. 12. 13. 14. 15. 16. 17. 18. 19. 20. 21. 22. 23. 24. 25. 26. 27. 0.538 1.106 1.326 0.625 1.363 1.499 0.450 0.874 0.950 0.496 0.993 1.259 0.610 1.298 1.415 0.542 1.045 1.022 0.314 0.847 1.044 0.565 1.221 1.351 0.484 0.888 0.939 0.590 1.280 1.442 0.783 1.597 1.621 0.593 1.182 1.273 0.644 1.237 1.437 0.768 1.565 1.613 0.709 1.528 1.326 0.418 1.006 1.149 0.744 1.517 1.523 0.544 1.092 1.108 0.658 1.291 1.456 0.833 1.565 1.624 0.653 1.206 1.262 0.683 1.257 1.454 0.821 1.505 1.618 0.735 1.483 1.346 0.442 1.048 1.183 0.749 1.446 1.595 0.549 1.074 1.132 0.484 1.127 1.350 0.718 1.291 1.443 0.417 0.913 0.994 0.433 0.433 1.061 1.267 0.734 1.291 1.427 0.493 0.980 0.263 0.874 1.064 0.631 1.171 1.291 0.456 0.926 0.976 0.542 1.300 1.422 0.830 1.545 1.624 0.573 1.245 1.281 0.583 1.316 1.413 0.906 1.597 1.651 0.685 1.333 1.343 0.379 1.088 1.160 0.739 1.405 1.434 0.554 1.177 1.164 0.619 1.303 1.436 0.884 1.526 1.617 0.639 1.238 1.287 0.630 1.311 1.442 0.926 1.565 1.654 0.711 1.308 1.354 0.415 1.094 1.222 0.741 1.378 1.464 0.557 1.151 1.195
Table 5 Statistical results of correlation between the calculated and observed values of CEC for the removal of Ca2+ ions by ion exchange
process
SC Slope (m) Intercept (c) r-value
AA EJ TB 0.975 0.972 0.973 0.0232 0.0307 0.0311 0.976 0.968 0.973
• For the best fit of the model: m ≈ 1.0, C ≈ 0.0 and r ≈ 1.0.
Theoretically calculated value using MLR eqns. (ii) to (iv)
Quadratic regression equations (ii) – (iv) are found to be statistically significant at 95% confidence level (CL) while the MLR equations with these three variables x1, x2 and x3 alone are significant only at 80% CL indicating the
combined effect of the % (w/w) of SC in the condensate, particle size and initial concentration (concn.) Ca2+ ions (xi)
and their square (x11 or x22 ) and cross products (x12).
The percent variance obtained from the factor analysis of all the dependent (explanatory) variables, its square term and cross products, including and excluding the independent variable (y = CEC) are presented in Table 3. The percent variance of the variables will give an idea about the significance of each variable and its contribution in explaining the observed experimental results (y values). The predicted/ calculated values of CEC of the condensate from the equations (ii) to (iv) at each set of experimental conditions(ycal) are also summarised in Table 4, along with
the experimentally observed values of CEC (yobs).
The values of correlation coefficient( R) for the MLR equations (ii) to (iv) are found to be in the range of 95% CL and the correlations are statistically significant, which indicate that there should be a close agreement between the experimental (yobs) and theoretical values of CEC (ycal). The simulated values of ycal by the equations (ii) to (iv) are
found to be in close agreement with that of the experimental Yobs values(Table 4). The applicability of the model
was verified by plotting the calculated values of CEC (ycal) against the experimental (Yobs) values (Fig 1). Values of
slope (m, range = 0.972 – 0.975) are computed by correlating the ycal values with yobs and are reported in Table 5,
[image:6.595.227.383.410.449.2]Opimisation of Process Parameters
Contour plots were drawn using Mathematica software, representing the CEC versus %(w/w) of SC in condensate (x axis) and particle size in µm (x aixs) at a constant initial concentration of Ca2+ ions say 0.10M (Fig. 2, segments A, B and C for AA, EJ and TB respectively). The CEC of calcium ion exchanged (y-value) increases and then decreases with increase in particle size and decreases with the increase in % (w/w) of SC in condensate. The maximum value of CEC for a given set of experimental conditions of %(w/w) of SC in condensate and particle size and also the optimum values of process parameters for maximum value of CEC could be obtained from contour plots. At 0.10M initial concentration of Ca2+ ions, the optimum values of process parameters are 18% (w/w) of
SAAC with 250 µm particle size; 20% (w/w) of SEJC with 275 µm particle size; and 20% (w/w) of STBC with 50
µm particle size of the IERs.
Contour plots of CEC versus initial concentration of Ca2+ ions and particle(µm) size of IER (y axis) and initial concentration of Ca2+ ions (c0, x aixs) at constant amount of SC viz., 20% (w/w) of SCs in the condensate (Fig . 3,
segments A, B and C, respectively for AA, EJ, and TB) reveal that CEC value increases with increase in particle size and then decreases and the CEC value increases with increase in [Ca2+]o up to 0.15 mol L-1 . The extent of
variation of CEC with these parameters could be obtained from these contour plots. The maximum value of CEC with 20% (w/w) of SC in the condensate occurs at the following optimum conditions: 0.08 M [Ca2+]o with 375 µm
particle size of resin prepared from SAAC, 0.10M [Ca2+]o with 360 µm particle size of resin prepared from SEJC
and 0.10M [Ca2+]o with 360 µm particle size of resin prepared from STBC.
Contour plots (drawn using Mathematica software) representing the CEC verses % (w/w) of SC in condensate ( in y axis) and initial concentration of Ca2+ ions (C0 , in x aixs) at constant particle size of 300 micron
Fig 1Plots between the experimental and calculated Fig .2 Contour plots representing CEC of 0.1M values of CEC of various low cost IERs by blending [Ca2+]
0 solution as a function of % (w/w) of SC versus
______________________________________________________________________________
[image:8.595.349.536.67.287.2]
Fig . 3 Contour plots representing CEC of composite Fig .4 Contour Plots representing CEC of composite prepared with 20%(w/w) of SC as a function of particle with 300 micron particle size as a function of % size (micron) versus [Ca2+]
0; A = AA, B = EJ and C = TB (w/w) of SC versus [Ca2+]0 ; A = AA, B = EJ and C = TB
(Fig. 4, segments A, B and C respectively for AA, EJ and TB ) indicate that the CEC increases with decrease in % (w/w) of SCs in the condensate and increases with increase in initial concentration of Ca2+ ions ([Ca2+]0) up to
0.15mol L-1 . The contour plots give an idea about the variation in CEC values with the simultaneous changes in
these process parameters. The maximum value of y (CEC) reached with 300 µm particle size of resin which occur
at the following optimum conditions of process parameters;
SAAC : 27.5 % (w/w) of SC in blend and 0.075M of [Ca2+]o
SEJC : 25 % (w/w) of SC in blend and 0.08M of [Ca2+]o and
STBC : 27.5 % (w/w) of SC in blend and 0.01 M of [Ca2+]o
Hence in general the optimum conditions of process parameters are 20% (w/w) of SC in the condensate, 200-300 micron particle size of condensate and 0.08M initial concentration of Ca2+ ions. Among the low-cost IERs, the IER obtained by blending SC prepared from TB, posses the maximum CEC value and hence it could be used as low-cost IER as an alternative to CR. These IERs could be used as low-cost materials for the removal of calcium ions, for water softening under the experimental conditions.
CONCLUSION
The following conclusions have been arrived at from the results of the present study:
• The mathematical modeling has been useful for theoretically predicting the CEC values under various experimental conditions. The balanced nature of a statistical design leads it-self to an organised method of experimentation and to a straight forward approximation to data analysis. Graphical presentation is facilitated with such results from designed experiments.
• The variables such as %(w/w) of SC in condensate, particle size and initial concentration of Ca2+ ions were proved to be the most significant(critical) parameters for the maximum CEC of calcium ions as evidenced from the MLR equation and contour plots.
• The results obtained could be used for better designing of cost-effective IERs for effluent / water treatment plant, for the economic removal of metal ions in general and calcium ion in particular by ion exchange process..
Acknowledgements
The authors are highly thankful to the Principal of their colleges for providing research facilities and encouragement. The authors acknowledge the help rendered by the Department of Mathematics and Botany of Government Arts College, Melur and Madurai Kamaraj University, Madurai.
Notations
C2 = linear coefficient fox x2
C3 = linear coefficient fox x3
C11 = Coefficient of square term x12
C22 = Coefficient of square term x22
C33 = Coefficient of square term x32
C12 = Coefficient of the cross product term x1x2
C13 = Coefficient of the cross product term x1x3
C23 = Coefficient of the cross product term x2x3
CEC (y) = Cation exchange capacity, in m mol-1 g-1
r, R = correlation coefficient
100R2 = percent of variation explained / coefficient of determination S = standard error of the estimate
X1 = % (w/w) of SC in condensate
x2 = particle size (in µm)
x3 = initial concentration Ca2+ ions (in M or mol L-1).
X11, x22 = square term of the process parameters
X12 = cross product of the process parameters
y = experimental / predicted response (CEC)
REFERENCES
[1]A.M., Wachinski and J.E.Etzel Environmental ion exchange, Lewis, New York, 1997.
[2]J.W. Patterson, Wastewater treatment technology. Ann Arbor Sci. Publ., Ann Arbor, Michigan 1975.
[3]R.Kunin, Ion exchange resin. 2nd Edn., Wiley, Newyork ; Cn.15, pp. 320 – 325. 1958. [4]N.Kannan, and R.K. Seenivasan J.Appl. polym. Sci., 101, 4104 2006.
[5]N.L.N.Sharma, Joseph Mary and Padma Vasudevan, Res. Ind., 21, 173 1976.
[6] Padma Vasudevan and N.L.N. Sarma, J.Appl. Poly.Sci., 23, 1443 1979.
[7]G.J.Mohan Rao and S.C. Pillai, J. Indian Inst.Sci. , 36A, 70 1954. [8]Shahha and S.L.Batna, J.Appl. Chem. Lond., 8, 335 1953.
[9]T.Dheiveesan and S.Krishnamoorthy, J. Indian Chem.Soc., 65, 731 1988.
[10]D.Kathiresapandian and S.Krishnamoorthy, Indian. J. Technol., 29, 487 1991.
[11]A.Mariamichel and S.Krishnamoorthy, Asian J. Chem., 9(1), 136 1997.
[12]N.Kannan, R.K.Seenivasan and R.Mayilmurugan, Indian J. Chem. Technol., 10, 623 2003.
[13]M.S.Metwally, N.E.Metwally and T.M. Samy, J. Appl. Poly. Sci., 52, 61 1994.
[14]N.Kannan, and G.Rengasamy, Env. Technol., 25 : 513 –522 2004.
[15]G E P Box., and J S. Hunter, Ann. Math. Statist. 28, 195 – 200 1957.
[16]G E P Box., and K B. Wilson On the experimental attainment of optimum conditions J. Roy. Statist. Soc.
B13, 1 – 6 1957.
[17]S.Ramachandran, and S.Krishnamoorthy, Indian J.Tech., 22 : 355 – 356 1984
[18]G.H.Jeffery, J.Bassett, J. Mendhan. and R.C Denney. Voget’s Text book of quantitative chemical analysis. 5th edn., ELBS, Longman, London, 689 1991.
[19]A,Mariamichel and S.Krishnamoorthy , Asian J. Chem., 9 (1) : 136 – 148 (1997); J. Sci. Ind Res., 56 : 680 –
![Fig . 3 Contour plots representing CEC of composite Fig .4 Contour Plots representing CEC of composite ) of SC as a function of particle with 300 micron particle size as a function of % ; A = AA, B = EJ and C = TB (w/w) of SC versus [Ca2+]0 ; A = AA, B = EJ and C = TB](https://thumb-us.123doks.com/thumbv2/123dok_us/8748033.891268/8.595.349.536.67.287/contour-representing-composite-contour-representing-composite-particle-function.webp)
