IJPSR (2016), Vol. 7, Issue 5 (Research Article)
Received on 29 November, 2015; received in revised form, 27 January, 2016; accepted, 07 February, 2016; published 01 May, 2016
RP-LC METHOD DEVELOPED FOR THE DETERMINATION OF ASCORBIC ACID IN VITAMIN C SYRUP PREPARATION
Kudirat B. Mustapha *1, Alkali A.Kelong, Tiwalade A. Adelakun, Ache A. Theophilus1 and Obiageri O. Obodozie-Ofoegbu1
Department of Medicinal Chemistry and Quality Control 1, National Institute for Pharmaceutical Research and Development, Idu, Abuja, Nigeria
Medixal Pharmacy 2, Essence Plaza, Wuse Zone 6, Abuja, Nigeria
ABSTRACT: Ascorbic acid is one of the essential and most vital medicines needed to maintain healthy living. Due to its non-availability through endogenous biosynthesis in humans, it is arguably one of the most consumed Over-The-Counter drugs. Thus, a simple, precise, low-cost and accurate reversed-phase liquid chromatographic (RP-LC) method was developed and optimized to analyse for the percentage content of ascorbic acid in different brands of Vitamin C syrups. The chromatographic separation carried out on an ODS (C18) Ultra sphere column, 5µm (25cm x 2mm), was achieved with HPLC water and methanol as the mobile phase, pumped at a flow rate of 1ml/min and using an ultraviolet detector for detection. The calibration curve was linear over the range of 10-100µg/ml and the method was found to be specific as no interference peaks of impurities and excipients were observed. The method developed was used to assess the quality of fifty-five samples of different types of Vitamin C syrup. Among the samples assessed for their percentage content of ascorbic acid, 18.2% fell below B.P official standard, 7.3% fell within range and 74.6% of the total samples analyzed were above the specified range. We have found this method to be simple, rapid and effective for analysis of ascorbic acid in Vitamin C syrups.
INTRODUCTION: Vitamin C [Ascorbic acid (AA)] remains a popular essential drug in the pharmaceutical world. Primates and several other mammals including human are not able to synthesize ascorbic acid, 1 and food substances, fruits and vegetables are the only natural way through which ascorbic acid is introduced into the human body. 45% of children worldwide are under-nourished.
QUICK RESPONSE CODE
DOI:
10.13040/IJPSR.0975-8232.7(5).2001-08
Article can be accessed online on: www.ijpsr.com DOI link: http://dx.doi.org/10.13040/IJPSR.0975-8232.7 (5).2001-08
However, it has been suggested that daily uptake of Vitamin C has to be within units of grams of AA to reduce the incidence of colds and other diseases. Although the Recommended Dietary Allowances (RDA) for Vitamin C depends on age and gender with other factors such as pregnancy and illnesses, nevertheless, the RDA is 75 and 90mg/day for adult normal women and men, respectively 2, 3. But the content of ascorbic acid in food can be affected by many factors such as processing, storage and climatic conditions.
Hence, the need to supplement daily intake with exogenous sources such as pharmaceutically prepared Vitamin C formulations. Vitamin C is required for the proper development and function Key words:
Ascorbic acid, Vitamin C Syrup, Chromatographic, RP-LC.
Correspondence to Author: Dr. Kudirat Bola Mustapha
Department of Medicinal Chemistry and Quality Control, National Institute for Pharmaceutical Research and Development, Idu, Abuja, Nigeria.
of many parts of the body. It also plays an important role in maintaining proper immune function and help with increasing the absorption of iron from food to correct protein imbalance in certain newborns (tyrosinmia). Vitamin C can also help to lower the risk of getting cancer. As a result, Vitamin C preparations is one of the frequently consumed pharmaceuticals which necessitates that such product ought to be of good quality and the percentage content should be according to official specification.
Various types of analytical methods have been reported in journals for the determination of AA in many dosage forms.4-10 The most common and simple method is a certain redox titrimetric reaction method based on the reduction of the blue dye reagent 2,6-dichlorophenolindophenol by Vitamin C in which the endpoint of the reaction is usually indicated as a pink colour.11-13 However, this method is not without limitation.14 Some High Performance Liquid Chromatographic (HPLC) methods were widely utilized in the determination of AA but some of them are time consuming, poorly reproducible and somehow cumbersome.
15-19
Thus, a simple and efficient HPLC method have been developed and validated in our laboratory and applied for the assessment of the quality of Vitamin C syrups sold in pharmacies within the Abuja metropolis, by determining the percentage contents of the ascorbic acid.
FIG.1: CHEMICAL STRUCTURE OF ASCORBIC ACID
MATERIALS AND METHODS: Chemicals and Reagents:
L-Ascorbic Acid was obtained from Sigma Chemical Company. HPLC grade Methanol from Sigma Aldrich. Vitamin C syrup formulations were
obtained commercially from various pharmacies in Abuja. All other reagents were of analytical grade.
Instrument and chromatographic system:
A High Performance Liquid Chromatographic (HPLC) system (Agilent 1100series) with a G1322A Degasser, G1311A Quart pump and a G1314A VWD detector was used for analysis. Injection was done manually by a Rheodyne model 7725 valve (Cotati, California, U.S.A) fitted with a 20ul loop. The data was recorded using Agilent ChemStation software. Separation was carried out at 25oC (oven set temperature) with an ODS (C18)
Ultrasphere 5µm, (2 x25) cm. Analysis was performed by isocratic elution with a flow rate of 1.0ml/min.
Sampling of Vitamin C Syrups:
55 Vitamin C syrup samples were purchased from the pharmacies and patent medicine stores from the metropolis and other satellite towns within Abuja namely: Wuse, Garki, Asokoro, Maitama, Kubwa, Karmo, Idu and Gwagwalada. These outlets were divided into groups such as Category A (pharmacies with air-conditioning system, fan, stable electricity
supply and conducive environments),
Category B (pharmacies with
air-conditioning system or fans with relatively stable electricity supply and fair dispensing area), Category C (No stable electricity supply, with air-conditioning system or fan with poor dispensing area).
Preparation of Standard Solutions:
25mg Ascorbic Acid (AA) reference standard was carefully weighed and dissolved in 10ml HPLC water in a 25ml volumetric flask to prepare standard stock solution of 1mg/ml concentration. From the standard stock solution, concentration ranges of 10µg/ml to 100µg/ml were prepared for the calibration curve.
Preparation of Sample Solutions:
standard volumetric flask and was diluted to a final concentration of 16µg/ml. 20µl of each sample was injected.
All samples including the standard were protected from light.
Method Development and Validation: Validation of the method was performed according to the requirements of International Conference on Harmonization (ICH) guideline.20 Validation of the HPLC method was carried out with the following parameters.
Linearity:
1mg/ml of ascorbic acid reference standard was used as stock solution for the preparation of subsequent aliquots of 10, 20, 40, 60, 80 and 100µg/ml by serial dilution. 20µl of each aliquot was injected into the LC system. All determinations were carried out in triplicates for each concentration. The calibration curve of peak area (vs) concentration was plotted and correlation coefficient with regression line equation was determined. The results for the linearity study are given below.
Accuracy:
The accuracy of the method is the closeness of the measured value to the true value for the sample. Accuracy was assessed as the percent relative error and mean % recovery. The solutions of 10, 40 & 100 µg/ml standard ascorbic acid were prepared accurately.
Individual concentrations injected in
triplicates and the accuracy of the method was checked by determining recovery values. Accuracy was calculated for three runs of each solution.
Precision:
The precision was determined by measuring three samples probes under the same
experimental conditions. To calculate
precision, within-day and day to day tests were performed and the results were expressed as relative standard deviation (RSD %). Limits of detection (LOD) and Limits of Quantification (LOQ). LOQ was defined as the lowest concentration that could be detected with acceptable accuracy and precision. The limits of detection and quantification were determined by serial dilutions of known concentrations of ascorbic acid solutions in order to obtain signal/noise ratio of ≈ 3:1 for LOD and ≈ 10:1 for LOQ. Reproducibility was estimated by assaying six replicate solutions on day 1 and day 2.
RESULTS:
Method Validation:
Both within-day and day to day runs for the
AA standard is shown below in Tables 1 and
2. The coefficients of variance for the AA concentrations of 10 20, 40, 60, 80 and 100µg/ml, were 3.58, 1.26, 0.67, 1.53, 3.78, 2.48% for within runs and 2.30, 1.98, 2.88, 5.61, 1.74 and 1.59% for day to day runs respectively.
TABLE 1: WITHIN–DAY RUNS
Concentration (µg/ml) Ave. Peak Area (X) SD (±) SD/ X C.V (%)
10 1170.376 41.865 0.0358 3.58
20 2449.635 31.71 0.0113 1.26
40 4852.931 32.722 0.0067 0.67
60 6803.732 104.36 0.0153 1.53
80 9354.932 354.31 0.0378 3.78
100 11882.96 294.79 0.0248 2.48
TABLE 2: DAY TO DAY RUNS
Concentration (µg/ml) Ave. Peak Area (X) SD (±) SD/ X C.V (%)
10 1089.649 25.062 0.023 2.3
20 2347.078 46.537 0.0198 1.98
40 4728.394 136.15 0.0288 2.88
60 7191.554 403.21 0.0561 5.61
80 9148.200 158.91 0.0174 1.74
100 11304.120 179.58 0.0159 1.59
Calibration Curve for AA Standard:
There was a linear relationship between the peak areas of AA and concentration of AA over the range of 10µg/ml to 100µg/ml as
shown below in Fig. 2. The regression
[image:4.612.160.452.122.276.2]equation obtained for the calibration curves was Y= 107.35x + 275.62 with a correlation coefficient R² of 0.9987.
[image:4.612.81.514.303.489.2]FIG.2: CALIBRATION CURVE OF ASCORBIC ACID STANDARD
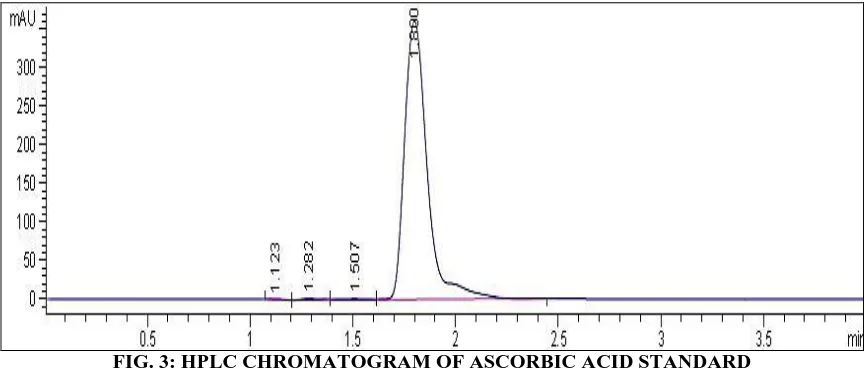
FIG. 3: HPLC CHROMATOGRAM OF ASCORBIC ACID STANDARD
DISCUSSION: The HPLC method used for the assessment of the ascorbic acid in Vitamin C syrups was developed in the Department of
Medicinal Chemistry and Quality Control
laboratories of the National Institute for
Pharmaceutical Research and Development
(NIPRD), Idu, Abuja. From the calibration readings, a plot of peak-area against concentration (µg/ml) gave a straight line curve, which obeyed Beer Lambert’s law. 21
The correlation co-efficient was 0.9987 (Fig. 2), the within day and day to day runs was calculated as shown in Tables 1 and 2. The developed and validated method has been demonstrated to be rapid (Fig. 3), accurate and concise. This is a departure from series of
complicated, time-consuming, out-dated and
sometimes inaccurate analytical procedures that are often used to access ascorbic acid content.
Thus, this method was used in the assessment of ascorbic acid in the fifty-five bottles of fourteen brands of vitamin C syrups. The results from the experiment data showed a high confidence limit of 95%. The fourteen
brands were coded thus, as seen in the Table
3: PD04, PZ09, LP05, KP06, SK07, TOP08,
CEV, Tu011, VI, VIT, AC01, MN03, ER01 and ES02
Percentage content of AA in the various samples of Vitamin C syrups:
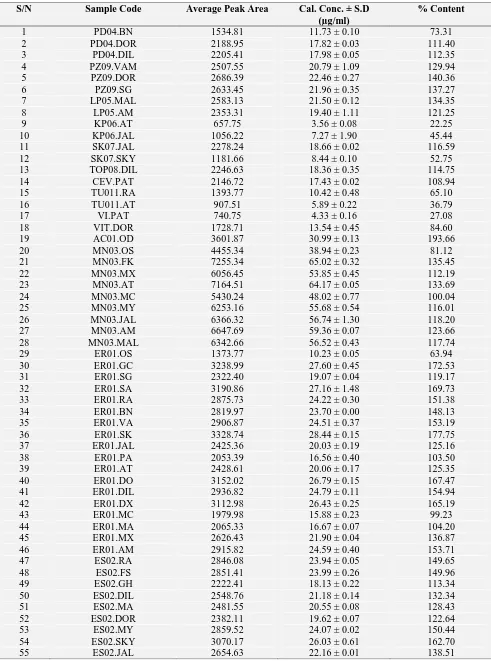
TABLE 3: PERCENTAGE CONTENT OF AA IN THE VARIOUS SAMPLES OF VITAMIN C SYRUPS
S/N Sample Code Average Peak Area Cal. Conc. ± S.D
(µg/ml)
% Content
1 PD04.BN 1534.81 11.73 ± 0.10 73.31
2 PD04.DOR 2188.95 17.82 ± 0.03 111.40
3 PD04.DIL 2205.41 17.98 ± 0.05 112.35
4 PZ09.VAM 2507.55 20.79 ± 1.09 129.94
5 PZ09.DOR 2686.39 22.46 ± 0.27 140.36
6 PZ09.SG 2633.45 21.96 ± 0.35 137.27
7 LP05.MAL 2583.13 21.50 ± 0.12 134.35
8 LP05.AM 2353.31 19.40 ± 1.11 121.25
9 KP06.AT 657.75 3.56± 0.08 22.25
10 KP06.JAL 1056.22 7.27± 1.90 45.44
11 SK07.JAL 2278.24 18.66 ± 0.02 116.59
12 SK07.SKY 1181.66 8.44 ± 0.10 52.75
13 TOP08.DIL 2246.63 18.36 ± 0.35 114.75
14 CEV.PAT 2146.72 17.43 ± 0.02 108.94
15 TU011.RA 1393.77 10.42 ± 0.48 65.10
16 TU011.AT 907.51 5.89 ± 0.22 36.79
17 VI.PAT 740.75 4.33 ± 0.16 27.08
18 VIT.DOR 1728.71 13.54 ± 0.45 84.60
19 AC01.OD 3601.87 30.99 ± 0.13 193.66
20 MN03.OS 4455.34 38.94 ± 0.23 81.12
21 MN03.FK 7255.34 65.02 ± 0.32 135.45
22 MN03.MX 6056.45 53.85 ± 0.45 112.19
23 MN03.AT 7164.51 64.17 ± 0.05 133.69
24 MN03.MC 5430.24 48.02 ± 0.77 100.04
25 MN03.MY 6253.16 55.68 ± 0.54 116.01
26 MN03.JAL 6366.32 56.74 ± 1.30 118.20
27 MN03.AM 6647.69 59.36 ± 0.07 123.66
28 MN03.MAL 6342.66 56.52 ± 0.43 117.74
29 ER01.OS 1373.77 10.23 ± 0.05 63.94
30 ER01.GC 3238.99 27.60 ± 0.45 172.53
31 ER01.SG 2322.40 19.07 ± 0.04 119.17
32 ER01.SA 3190.86 27.16 ± 1.48 169.73
33 ER01.RA 2875.73 24.22 ± 0.30 151.38
34 ER01.BN 2819.97 23.70 ± 0.00 148.13
35 ER01.VA 2906.87 24.51 ± 0.37 153.19
36 ER01.SK 3328.74 28.44 ± 0.15 177.75
37 ER01.JAL 2425.36 20.03 ± 0.19 125.16
38 ER01.PA 2053.39 16.56 ± 0.40 103.50
39 ER01.AT 2428.61 20.06 ± 0.17 125.35
40 ER01.DO 3152.02 26.79 ± 0.15 167.47
41 ER01.DIL 2936.82 24.79 ± 0.11 154.94
42 ER01.DX 3112.98 26.43 ± 0.25 165.19
43 ER01.MC 1979.98 15.88 ± 0.23 99.23
44 ER01.MA 2065.33 16.67 ± 0.07 104.20
45 ER01.MX 2626.43 21.90 ± 0.04 136.87
46 ER01.AM 2915.82 24.59 ± 0.40 153.71
47 ES02.RA 2846.08 23.94 ± 0.05 149.65
48 ES02.FS 2851.41 23.99 ± 0.26 149.96
49 ES02.GH 2222.41 18.13 ± 0.22 113.34
50 ES02.DIL 2548.76 21.18 ± 0.14 132.34
51 ES02.MA 2481.55 20.55 ± 0.08 128.43
52 ES02.DOR 2382.11 19.62 ± 0.07 122.64
53 ES02.MY 2859.52 24.07 ± 0.02 150.44
54 ES02.SKY 3070.17 26.03 ± 0.61 162.70
According to the British Pharmacopoeia specification for ascorbic acid syrup, it should contain not less than 95% and not more than 105% of ascorbic acid 22.
From the fifty-five bottles of Vitamin C syrups assessed, ER01 brand was the most widely distributed among the samples, being found in about 85% of the pharmacies assessed. Among the ER01 brand, 78.7% of the samples contained contents of ascorbic acid above the specified range, 16.7% had theirs within the BP specified range, and 5.6% below the range. The second widely distributed Vitamin C syrup brand is ES02 samples, all the samples of this brand contained amount of AA above the official specified range. MN03 brand had a similar distribution pattern as the ES02 brand. However, 11.1% of the MN03 samples contained AA below the specified range while 77.8% contained AA above the specified range, whereas only 11.1% had contents of AA within the B.P. specification of ascorbic acid in vitamin C syrup. Overages in the preparation of vitamins and multivitamin products are a common phenomenon in pharmaceutical manufacturing and this is often used to forestall the effect of packaging on degradation of sensitive vitamins. Thus, it was not surprised that much overages was observed in this analysis. However, the high percentage of these overages is of concern as there ought to be a regulatory guideline in this regard.
On the other hand, considering that both particular
brands are from reputable pharmaceutical
companies, and are highly sorted-after, presence of samples whose ascorbic acid content fell below the B.P standard could have been as a result of substandard product prepared by some unknown perpetrators of substandard drug products or the sample might have degraded. It could as well be due to manufacturing error during processing or error in weighing. It was once noted by one of the managing directors of a pharmaceutical industry that these fakers do go for successful products that bring succor to the patients.
Out of the remaining eleven brands of vitamin C syrup only KP06 and Tu011 were found in two pharmacies which suggest that they are relatively not common within Abuja. According to the test
result, these brands failed woefully in the assessment as regards the percentage content test, with 22.3% AA in KP06.AT, 45.4% for KP06.JAL, while Tu011.RA was 65.10% and Tu011.AT was 36.79% for the two samples of the two brands obtained respectively, although they satisfied the criteria for physical assessment. The fact that Vitamin C syrup preparations are among the fast-selling over-the-counter (OTC) drugs could have been a motivation for the perpetrators of fake and substandard drugs.
The pharmacies where the vitamin C syrups were purchased were categorized into three: A, B, and C. Category A Pharmacies were: MAL; DOR, FSH and GHA, Category B were DIL, MY, JAL, SKY, SG and VAM, and Category C were BN, RA, MX, GC, SA, DX, MC, AM, AT, FK and PAT. Category A pharmacies had fans and air conditioners; good dispensing area and stable electricity supply, while category B had fans and air conditioner, but had fairly stable electricity supply with relatively fair dispensing area. Category C had small dispensing areas, fan only, epileptic electricity supply and hot humid environment.
From the result, it could be seen that the failure rate in the assessment is highest in category C followed by B and one case of failure in A. This could be attributed to the difference in the dispensing and stocking environment of the three categories of pharmacies considering the instability rate of AA under hot humid environment. During this study, there was a demonstration in which two samples of the selected Vitamin C syrup, ER01 and ES02 brands were assessed and found to pass the % content test of AA. They were then kept on the open shelf in our laboratory in NIPRD for six months after which they were assessed again and found to have % content of 74.75% AA for ES02 and 77.5% of AA for ER01.
were kept in a room without air conditioner, the percentage content would have probably been much lower than that.
It was also observed that 50% of samples that did not meet the specified standard were selected from the category C pharmacy. And this could be attributed to the overages of the content of AA. Also, the satisfactory rate noted in some brands could be attributed to the stocking pattern of most of the pharmacies with not more than three brands of Vitamin C syrups, which allowed for rapid replacement of dispensed ones from the shelves. The container type did not seem to matter as all the Vitamin C syrups in plastic bottles with screw cap did not fall below the B.P standard in terms of AA content; the plastic container samples formed 30.76% of the total samples. However, it may also be part of the reasons for the much observed general overages (74.6%) among the samples since it has been reported that oxygen readily passes through plastics.
CONCLUSION: The HPLC method developed was simple, reproducible, accurate and sensitive and can be applied in the quality control determination of the ascorbic acid in Vitamin C syrups. Quality control and establishment of standard permissible overages for vitamin products are essential for the efficacy and safety of pharmaceutical products. And proper enforcement of quality by the regulatory agencies is of utmost importance if adequate health delivery is to be ensured to the populace.
REFERENCES:
1. Anitra C Carr, Stephanie M Bozonet and Margreet CM Vissers: A Randomised Cross-over pharmacokinetic bioavailability study of synthetic versus Kiwifruit-derived Vitamin C. Nutrients 2013; 5:4451-4461.
2. Vitor Spinola, Eulogio J Llorent-Martinez and Paula C Castilho: Determination of Vitamin C in foods: Current state of method validation. Journal of Chromatography A 2014; 1369:2-17.
3. Emily Wax: Vitamin C. Mediline Plus medical
encyclopeadia. The Brooklyn Hospital Center, Brooklyn, NY.
4. Abad Khan, Muhammad I Khan, Zafar Iqbal, Yasar Shar,
Lateef Ahmad, Shabnam Nazir, David G Watson, Jamshaid Ali Khan, Fazil Nasir, Abbas Khan and Ismail: A new HPLC method for the simultaneous determination of ascorbic acid and aminothiols in human plasma and erythrocytes using electrochemical detection. Talanta 2011; 84:789-801.
5. Saikh Mohammad Wabaidur, Zeid Abdullah Alothman
and Mohammad Rizman Khan: A rapid method for the
simultaneous determination of L-ascorbic acid and acetylsalicyclic acid in aspirin C effervescent tablet by ultra performance liquid chromatography-tandem mass spectrometry. Spectrochimica Acta Part A: Molecular and Biomolecular spectroscopy 2013; 108: 20-25.
6. Celia Barril, Andrew C Clark and Geoffrey R Scollary: Chemistry of ascorbic acid and sulfur dioxide as an antioxidant system relevant to white wine. Analytical Chimica Acta 2012; 732:186-193.
7. Roman Kand‘ar, Petra Drabkova and Radek Hampl: The determination of ascorbic acid and uric acid in human seminal plasma using an HPLC with UV detection. Journal of Chromatography B 2011; 879:2834-2839.
8. Liandong Hu, Li li, Zhaoliang Luo, Jianxue Yang and Wei Liu: Determination of trace vitamin C by ion-pair HPLC with UV detection in calcium gluconate and vitamin C compound oral solution. Journal of Chromatography Science 2012; 50:102-107.
9. Maria Teresa Tarrago-Trani, Katherine M Phillips and Marlyn Cotty: Matrix-specific method validation for quantitative analysis of vitamin C in diverse foods. Journal of Food Composition and Analysis 2012; 26:12-25. 10. Pengfei Jin, Lufeng Xia, Zheng Li, Ning Che, Ding Zou
and Xin Hu: Rapid determination of thiamine, riboflavin, niacinamide, pantothenic acid, pyridoxine, folic acid and ascorbic acid in vitamins with minerals tablets by high-performance liquid chromatography with diode array detector. Journal of Pharmaceutical and Biomedical analysis 2012; 70:151-157.
11. Kramer BK, Pultz VM and McCormick JM: Vitamin C Analysis. ChemLab.Truman, Truman State University, Kirksville, Missouri. 2011.
12. Zeinab HK, Mohammad RI, Ali S and Saeed G: Effect of dietary vitamin C and highly unsaturated fatty acids on some biochemical blood parameters in goldfish (Carassius auratus gibelio). World Journal of Fish and Marine Sciences 2012; 4(5): 454-457.
13. F Ayca Ozdemir Olgun, Dilek Ozyurt, Kadriye Isil Berker, Birsen Demirata and Resat Apak: Folin-Ciocalteu
spectrophotometric assay of ascorbic acid in
pharmaceutical tablets and orange juice with pH adjustment and pre-extraction of lanthanum(III)-flavonoid complexes. Journal of the Science of Food and Agriculture 2014; 94:2401-2408.
14. Shafqat Ullah, Arshad Hussain, Javid Ali, Khaliqurrehman and Asad Ullah A: Simple and rapid HPLC method for analysis of vitamin-C in local packed juices of Pakistan. Middle-east journal of scientific research 2012; 12(8):1085-1091.
15. Valente A, Sanches-Silva A, Albuquerque TG and Costa HS: Food Chemistry 2014; 154:71-74.
16. Bamishaiye EI, Olayemi FF and Bamishaiye OM: Effects of boiling time on mineral and vitamin C content of three varieties of Hibiscus sabdriffa drinks in Nigeria. World Journal of Agricultural Sciences 2011; 7(1): 62-67. 17. Hongyan Li, Hongbin Tu, Yaohui Wang and Mark Levine:
Vitamin C in mouse and human red blood cells: An HPLC assay. Analytical Biochemistry 2012; 426(2):109-117. 18. Rita Ferin, Maria Leonor Pavao and Jose Baptista: Rapid,
Sensitive and simultaneous determination of ascorbic and uric acids in human plasma by ion-exclusion HPLC-UV. Clinical Biochemistry 2013; 46:665-669.
20. Abiodun Ogundaini, Tiwalade Olugbade, E Njau and Ajibola A Olaniyi: Spectroscopic Methods 1, in:Principles of Drugs Quality Assurance and Pharmaceutical Analysis.
(Ed. A.A Olaniyi), Musuro Publishers, Ibadan. 2000; 209-270.
21. British Pharmacoepia: HM Stationery Office, London. Volume II, 1998; 1492, 1814.
All © 2013 are reserved by International Journal of Pharmaceutical Sciences and Research. This Journal licensed under a Creative Commons Attribution-NonCommercial-ShareAlike 3.0 Unported License.
This article can be downloaded to ANDROID OS based mobile. Scan QR Code using Code/Bar Scanner from your mobile. (Scanners are available on Google Playstore)
How to cite this article: