Full Length Research Article
ANALYSIS OF ENERGY CONSERVATION POTENTIAL OF THE HEAT PIPE USING RESPONSE
SURFACE METHODOLOGY
*Senthilkumar, R., Prabakaran, J. and Karthikeyan, M.
Department of Mechanical Engineering, Annamalai University, India
ARTICLE INFO ABSTRACT
This paper discusses about the energy conservation potential of the heat pipe using copper nanofluid as a working fluid and the optimizes the working parameters using the response surface methodology (RSM). The parameters considered are heat input, angle of inclination and concentration of the copper nano particles in the copper nanofluid. Box Behnken design is used to conduct the experiments in the heat pipe and the responses are thermal efficiency and the thermal resistance. The influences of the above parameters and the interaction effects are studied by analysis of variance (ANNOVA). The proposed model is the very useful to predict the thermal efficiency and thermal resistance of the heat pipe.
Copyright © 2014 Senthilkumar et al. This is an open access article distributed under the Creative Commons Attribution License, which permits unrestricted use, distribution, and reproduction in any medium, provided the original work is properly cited.
INTRODUCTION
The energy requirement of all the countries is increasing greatly in recent times. The maximum energy consumption occurs in the industrial sector, transport sector, residential applications and commercial sectors (Reay and Kew 2006). In addition, based on the report of World Energy Council (WEC), the world energy demand would increase up to 50–80% in 2020. So the energy efficient tools and efficient heat recovery systems are required to minimize the energy consumption. There are many heat recovery systems which are widely used to recover the waste heat, among which the heat pipe is of great importance. The heat pipe is an effective heat transfer device that can transport heat at high rates with a very small temperature gradient by utilizing the phase change of working fluid. The heat pipe makes use of the highly efficient thermal transport process of evaporation and condensation to maximize the thermal conductance between a heat source and a heat sink. The amount of the heat transported by these devices is normally several orders of magnitude greater than pure conduction through a solid metal (Chi 1976). Some of the applications are electronics cooling, thermal energy recovery, energy conversion system, isothermal furnace, thermal control in spacecraft, solar collector, heat pipe heat exchangers, heat
*Corresponding author: Senthilkumar, R., Department of
Mechanical Engineering, Annamalai University, India.
recovery for HVAC Systems, gasification process and thermal storage subsystems (Singha et al., 2011). The operating parameters of the heat pipe depends on the heat source (heat input), type of wick structure, working fluid, angle of inclination, vapour core diameter, heat pipe container material, wick material, properties of the working fluid, etc. The heat transfer properties of heat pipes can be enhanced by increasing either the heat transfer surface or the heat transfer coefficient between the fluid and the surface area.
The use of heat pipes in high-power cooling applications has been limited to conventional applications which require either low thermal resistance or a severely restricted enclosure area. Besides, most of the traditional fluids have poor heat transfer properties compared to most solid, which necessitates the vital need for new and novel coolants with improved performance. The conventional fluids such as water, engine oil and ethylene glycol are generally used as working fluids in the heat transfer equipments. The performance of these conventional heat transfer fluids is often limited by their low thermal conductivities. Thus, there is a strong motivation to develop advanced heat transfer fluids with substantially higher conductivities to enhance the thermal characteristics. The use of solid particles as an additive suspended into the base fluid is a new technique for enhancing the heat transfer performance. Owing to the fact that the solid metal has a superior thermal
ISSN:
2230-9926
International Journal of Development ResearchVol. 4, Issue, 3, pp. 570-574, March,2014
DEVELOPMENT RESEARCH
Article History:
Received 08th
January, 2014 Received in revised form 11th
February, 2014 Accepted 15th
February, 2014 Published online 14th
March, 2014
Key words:
conductivity than the base fluid, suspending metallic solid fine particles into the base fluid is predicted to improve the thermal conductivity of that fluid. The suspension of solid particles such as millimeter or micrometer sized particles in the base fluid paves the way for enhancing the thermal conductivity of the traditional working fluids. But in the practical domain, micronized particles cause the problems such as sedimentation, erosion, fouling and increased pressure drop of the flow channel.
The latest progress in materials technology has made it feasible to generate nanometer-sizes particles that can conquer these problems. The innovative heat transfer fluids suspended by nanometer-sized solid particles are called ‘Nanofluids’. These suspended nanoparticles can change the transport and thermal properties of the base fluid. The term ‘Nanofluids’ is used to indicate a special class of heat transfer fluids that contain nanoparticles (≤100 nm) of metallic/non metallic
substances uniformly and stably suspended in a conventional coolant (Choi 1995; Lee et al., 1999; Choi et al., 1999; Xie et al., 2002). The experimental results show that the nanofluids have remarkably higher thermal conductivity and greater heat transfer characteristics than conventional pure fluids (Xuan, and Li 2000; Daungthongsuk, and Wongwises 2007; Xuan and Li 2003). Response surface methodology (RSM) is a collection of mathematical and statistical techniques for developing, improving and optimizing the process parameters by the design of experiments. The objective is to optimize the output variable which is influenced by independent input variables. An experiment is a series of tests, called runs, in which changes are made in the input variables in order to identify the reasons for changes in the output response (Montgomery 2005; Mohammed et al., 2010; Gunaraj and Murugan 1999; Ramkumar, and Ragupathy 2012; Prabakaran et al., 2012). In general the relationship is
Y= f (X1+X2+X3+….) ±ε.
where Y is the response, X1, X2, X3, ….. are input variables and ε is the measurement error.
The objective of the present study is to optimize the heat pipe operating parameters like heat input, angle of inclination, and the concentration of copper nanofluid in the base fluid by response surface methodology on the performance of copper– water heat pipes with mesh screen wicks. The present work elaborates the experimental work done and the prediction of empirical relations for thermal efficiency and thermal resistance of heat pipe using response surface methodology.
Response Surface Methodology
[image:2.612.322.543.58.122.2]The experimental performance of the heat pipe is analyzed by response surface methodology (RSM) using Design of Expert software. Box Behnken design method is employed with three input parameters namely heat input (A), angle of inclination (B) and concentration of copper nano particle in the base fluid (C) over the output response of thermal efficiency and thermal resistance. Table 1 shows the process parameters and their levels.
Table 1. Process parameters
Parameter Level -1 0 +1
A. Heat Input, W 30 50 70
B. Angle of Inclination, deg 0 30 60
C. Concentration, mg/lit 25 75 125
Experimental procedure
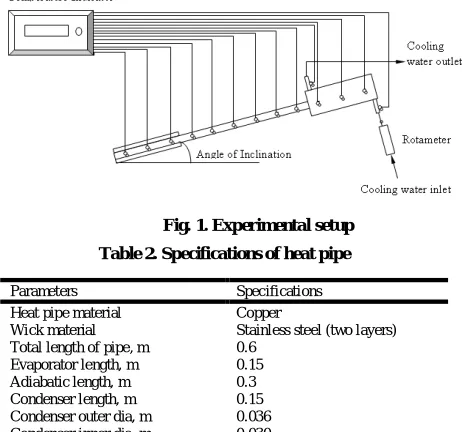
The schematic diagram of the experimental setup is shown in Fig.1. The specifications of the heat pipe are given in Table 2. Heat input is applied at the evaporator section using an electric strip attached to it with proper electrical insulation and heater is energized with AC current through a variac. The desired heat input is supplied to evaporator end of heat pipe by adjusting the variac. Water jacket is used at the condenser end to remove the heat from the pipe. The heat pipe has the ability to transfer the heat through the internal structure. As a result, sudden rise in wall temperature occurs which could damage the heat pipe if the heat was not released at the condenser properly. Therefore, before heat is supplied to the evaporator, the cooling water is first circulated through the condenser jacket. The power input is gradually raised to the desired power level. The surface temperatures at seven different locations along the heat pipe are measured using copper constantan thermocouple at a regular time interval of ten minutes until heat pipe reaches steady state condition. Simultaneously the evaporator wall temperature, wick temperature, water inlet and water outlet temperatures are measured using thermocouples. Once steady state is reached, the input power is turned off and cooling water is allowed to flow through the condenser to cool the heat pipe and to make it ready for further experiments. Then the power is increased to the next level and the heat pipe is tested for its performance. The experimental procedure is repeated for different flow rates and different inclinations of pipe to the horizontal and observations are recorded.
[image:2.612.321.552.474.690.2]
Fig. 1. Experimental setup Table 2. Specifications of heat pipe
Parameters Specifications Heat pipe material Copper
Wick material Stainless steel (two layers) Total length of pipe, m 0.6
Evaporator length, m 0.15 Adiabatic length, m 0.3 Condenser length, m 0.15 Condenser outer dia, m 0.036 Condenser inner dia, m 0.030 Outer diameter of the pipe, m 0.020 Inner diameter of the pipe, m 0.0176
RESULTS AND DISCUSSION
[image:3.612.321.549.47.208.2]The computed values of the thermal efficiency and thermal efficiency are entered in the software design matrix. The RSM is used to develop the empirical relationship between the experimental variables and the responses that are thermal efficiency and thermal resistance. A regression analysis is carried out to develop a best fit model to the experimental data, which are used to generate response surface plots. The Table 3 and 4 shows the analysis of variance (ANNOVA) for thermal efficiency and thermal resistance. The values of “Prob>F” less than 0.05 indicates that the model terms are significant. For the present case, heat input (A) and angle of inclination (B) are producing a significant effect than the concentration (C). The square values of heat input and angle of inclination are also having major effect. The interaction effect between heat input and angle of inclination (AB) has more significant effect on the thermal efficiency than the heatinput and concentration (AC) and angle of inclination and the concentration (BC) on the thermal efficiency. The “Pred R-Squared” value of 0.965 is responsible agreement with “Adj R-Squared” of 0.935. Adequate precision measures the signal to noise ratio. A ratio greater than 4 is desirable. Here the ratio of 17.42 indicates an adequate signal. Based on the ANNOVA, the following empirical relation is developed to predict the thermal efficiency of the heat pipe. Thermal Efficiency = 33.56875 - 0.68875 A + 0.343 B + 0.05245 C + 0.00354167 AB + 0.00025 AC + 0.00033333 BC + 0.0104187 A2 - 0.0062028 B2 - 0.000583C2 Similarly, the “Pred R-Squared” value of 0.935 is in responsible agreement with “Adj R-Squared” of 0.945. The ratio of adequate signal is 11.56. The empirical equation for thermal resistance is given as, Thermal Resistance = 3.959793 - 0.02204 A - 0.02397 B - 0.01897 C + 0.0000281 AB -0.00018 AC + 0.0000233 BC + 0.000114 A2 + 0.000249B2 +0.000151 C2
Fig. 2. Variations of experimental and predicted values of thermal efficiency
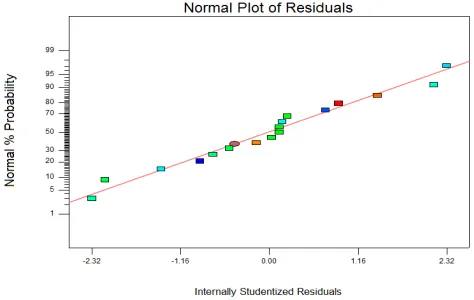
The Figs. 2 and 3 show the normal plot of residuals, which indicates that errors in the experiments are normally distributed for thermal efficiency and thermal resistance respectively. The thermal efficiency of the heat pipe is calculated as the ratio of heat rejection in the condenser section to the heat input at the evaporator section (Senthilkumar et al., 2011). The working fluid in this analysis is copper nanofluid. The base fluid used in the copper nanofluid is DI water.
Fig. 3. Variations of experimental and predicted values of thermal resistance
[image:3.612.316.557.275.448.2][image:3.612.61.298.445.595.2]
Table 3. Annova for response surface quadratic model - thermal efficiency
Table 4. Annova for response surface quadratic model - thermal resistance
Source Sum of Squares
df Mean Square
F Value
p-value Prob > F Model 3.383 9 0.376 13.466 0.0012 A 1.714 1 1.714 61.385 0.0001 B 0.251 1 0.251 9.000 0.0199 C 0.405 1 0.405 14.508 0.0066 AB 0.001 1 0.001 0.041 0.8458 AC 0.128 1 0.128 4.568 0.0699 BC 0.005 1 0.005 0.174 0.6888 A2
0.009 1 0.009 0.316 0.5914 B2
0.211 1 0.211 7.547 0.0286 C2 0.603 1 0.603 21.594 0.0024 Residual 0.195 7 0.028
Lack of Fit 0.189 3 0.063 40.248 0.0019 R-Squared 0.945 Pred
R-Squared
0.935
Adj R-Squared
0.875 Adeq Precision
11.560
It is observed from Figs. 4-6 that the thermal efficiency of heat pipe increases linearly with an increase the heat input in the evaporator section. The thermal efficiency of the heat pipe increases with increase in heat flux, due to the fact that the temperature gradient between the evaporator section and
Source Sum of Squares
df Mean Square
F Value p-value Prob > F Model 1173.81 9 130.424 26.758 0.0001 A 731.53 1 731.531 150.082 < 0.0001 B 215.28 1 215.281 44.167 0.0003 C 3.12 1 3.125 0.641 0.4496 AB 18.06 1 18.063 3.706 0.0956 AC 0.25 1 0.250 0.051 0.8273 BC 1.00 1 1.000 0.205 0.6643 A2 73.123 1 73.129 15.003 0.0061 B2 131.22 1 131.218 26.921 0.0013 C2 8.94 1 8.944 1.835 0.2176 Residual 34.12 7 4.874
Lack of Fit
32.69 3 10.896 30.435 0.0033
R-Squared 0.972 Pred R-Squared
0.965
Adj R-Squared
0.935 Adeq Precision
[image:3.612.311.555.495.664.2]the evaporator section, the heat generated in the surface is more and the working medium which is in the form of vapour moves vigorously into the condenser section. The cooling water in the condenser absorbs this excessive heat and as a result, the efficiency of the heat pipe increases.
Fig. 4. Effect of heat input and angle of inclination on thermal efficiency
Fig.5. Effect of heat input and concentration on thermal efficiency
Fig.6. Effect of angle of inclination and concentration on thermal efficiency
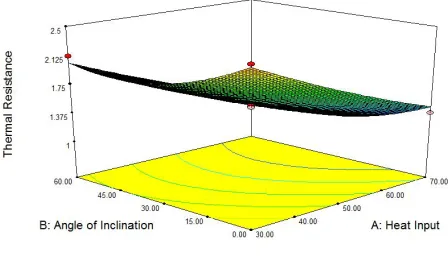
The thermal resistance (R) of the heat pipe is defined as ratio of the temperature difference between the evaporator and the condenser to the heat supplied in the evaporator. From the Figs. 7 - 9, it is clear that the thermal resistance of heat pipe decreases with increase with the heat input and inclination angle of the heat pipe. The thermal resistance value is minimum at higher heat input and that value is minimum at 15o to 30o inclination of the heat pipe. The thermal resistances condense quickly to its minimum value when the heat load is
increased. The effect of the heat transfer enhancement of a heat pipe using nanofluids is not due to the thermo physical
[image:4.612.315.539.94.222.2][image:4.612.63.284.118.236.2]
Fig. 7. Effect of heat input and angle of inclination on thermal resistance
Fig. 8. Effect of heat input and concentration on thermal resistance
Fig. 9. Effect of angle of inclination and concentration on thermal resistance
[image:4.612.315.545.345.573.2]Confirmation experiments
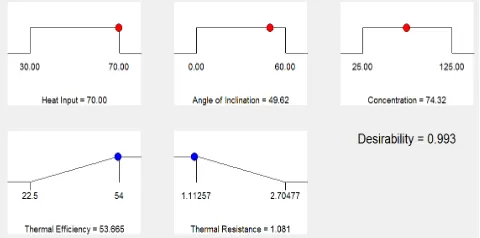
[image:5.612.62.302.193.312.2]The Fig. 10 shows the optimization plot generated by the RSM with a desirability of 0.995. It shows that the optimum value of the thermal efficiency is 53.667% and thermal resistance is 1.08112 when the heat input is 70 W, at 49.59o inclination, and concentration of CUO is 74.29 mg/lit. In order to confirm the optimization results, the experiment is conducted with 70 W heat input at 50o inclination of the heat pipe with a concentration 75 mg/lit. The thermal efficiency of the heat pipe is found as 54.32% and the thermal resistance is 1.12 which is nearer to the optimum value.
Fig. 10. Optimization plot
Conclusion
In this study, the thermal efficiency and thermal resistance of the heat pipe are optimized by RSM. The proposed model will be useful to predict the thermal efficiency of heat pipe with an error of ±1 %. Based on the RSM results, the optimum value of thermal efficiency is 54.32% and thermal resistance is 1.12 K/W. The heat pipe based passive systems can provide reliable and effective thermal control for energy conservation, energy recovery and renewable energy applications.
Acknowledgment
The authors thank the authorities of Annamalai University for providing the necessary facilities in order to accomplish this piece of work.
REFERENCES
Chi S.W., Heat pipe theory and practice, McGraw-Hill, Washington, 1976.
Choi S.U.I.., “Enhancing thermal conductivity of fluids with nanoparticles, developments and applications of non-Newtonian flows”, FED-vol.231, pp. 99–105, 1995.
Choi S.U.S., X. Wang, and W. Xu, “Thermal conductivity of nanoparticle- fluid mixture”, Journal of Thermophysics and Heat Transfer, vol.13, pp. 474–480, 1999.
Daungthongsuk W., and S. Wongwises, “A critical review of co nvective heat transfer of nanofluid”, Renewable and Sustainable Energy Reviews, vol. 11, pp.797–817, 2007. Gunaraj V., and N. Murugan, “Application of response
surface methodology for predicting weld bead quality in submerged arc welding of pipes”, . Journal of Materials Processing Technology, vol. 88, pp. 266-275, 1999. Lee S., S.U.S. Choi, J.A. Eastman, and S. Lee, “Measuring
thermal conductivity of fluids containing oxide nano-particles”, Transaction of ASME, vol. 121, pp. 280–289, 1999.
Mohammed J.K., H.M. Aziz,, M.S. Yosoff and N. Adlan.,” Application of response surface Methodology(RSM) for optimization of ammonical nitrogen removal from semi-aerobic landfill leachate using ion exchange resin” , Desalination, vol.254, pp. 154-161, 2010.
Montgomery C.C, Design and Analysis of Experiments, 6th ed, John Wiley & sons, USA, 2005.
Prabakaran J., S. Vaidyanathan, and S.Kanagarajan, “Establishing empirical relation to Predict temperature difference of vortex Tube using response surface methodology”, Journal of Engineering Science and Technology, vol. 7, pp.722 – 731, 2012.
Ramkumar R., and A.Ragupathy, “Application of Response Surface Methodology (RSM) for Optimization of Operating Parameters and Performance Evaluation of Cooling Tower Cold Water Temperature”, An International Journal of Optimization and Control: Theories & Applications, vol.2, pp.39-50, 2012.
Reay D.A. and P.A. Kew, Heat Pipes, 5th ed, Butterworth– Heinemann, Oxford, 2006.
Senthilkumar R., S. Vaidyanathan, and B.Sivaraman, “Performance investigation of heat pipe using aqueous solution of n-pentanol with different inclinations””, The Journal of Mechanical Science and Technology, vol. 25,pp.923-929, 2011.
Singha R., M. Mochizukia, T. Nguyena and A. Akbarzadeh, “Applications of heat pipes in energy conservation and renewable energy based systems”, Frontiers in Heat Pipes , vol.2, 033003 , 2011.
Xie H., J. Wang, and T. Xi, “Thermal conductivity of suspensions containing nano-sized SiC particles”, International Journal of Thermophysics, vol.23, 2002. Xuan Y., andQ. Li, “Investigation on convective heat transfer
and flow features of nano-fluids”, Journal of Heat Transfer, vol. 125, pp. 151–155, 2003.
Xuan Y., and Q. Li, “Heat transfer enhancement of nano-fluids”, International Journal of Heat and Fluid Flow (2000) 58–64.