7368
A MIXTURE OF EXPERTS FOR CATARACT DIAGNOSIS IN
HOSPITAL SCREENING DATA
1SUNGMIN MYOUNG, 2HONG-KI LEE
1Department of Health Administration, Jungwon University, Goesan-gun, Chungbuk, Korea. 2Corresponding Author, Department of Management, Jungwon University, Goesan-gun, Chungbuk, Korea.
E-mail: 1[email protected], 2[email protected].
ABSTRACT
One of the objects of many big-data analytic methods is to search through large amounts of information, analyzing to predict for individual patients. Cataract is a clouding of the lens inside the eye which leads to a decrease in vision, and the most common cause of blindness and is conventionally treated with surgery. It is important to detect the diagnosis early to reduce abstract cataracts develop. Many machine learning and data mining techniques have been suggested to do automatic diagnosis cataract. In this study, mixture of expert method was applied on 126,532 people collected from visiting a health screening center. Mixture of expert was implemented in R 3.4.1 to train the data for the development of the model. The performance of the ME model was evaluated by plotting a ROC curve for the validation of the results. The ME model achieved accuracy rates which were higher than that of the logistic regression model. This research will be applied to an important diagnostic decision mechanism for cataract in health examination subject.
Keywords: Mixture of Expert, Diagnosis, Cataract, Screening Data, Data Mining
1. INTRODUCTION
In recent years, many big-data analytic methods have been suggested in the field of biomedicine [1]. One of the objects of these analytic methods is to search through huge amounts of information, analyzing it to predict significant outcomes for individual patients [2]. For example, complex data sets such as structured and unstructured data (EMR, finanicial, clinical and genomic data) applied to be dealed with outcomes and predict patient’s risk for disease or prognosis [3]. For solving these problems, For solving these problems, ‘divide-and-conquer’ principle have been used to break a given problem (complex problem) into sub-problems whose solutions can be recursively combined to produce a final solution [4, 5].
Applying this principle, Jacobs and Jordan proposed mixture of experts (ME) model which is a modular neural network architecture for unsupervis ed/supervised learning [6]. It is composed of several expert network, a gating network, and a probalistic model to combine the gating and experts network. Yuksel et al. pointed out three important properties of ME model. First, it allows each experts to focus
on smaller parts of a larger problem. Second, it uses soft partitions of the given dataset. Third, it allows the splits to be formed along hyperplanes at arbitrary orientations in the input space [6, 7]. A number of studies for ME model have been suggested in the fields of regression and classification, and demonstrated usefulness. Also, many researchers think of ME have been published in the areas of medical decision support, genomic data analysis and signal pattern data analysis [7].
A cataract is a clouding of the lens inside the eye which leads to a decrease in vision. It is the most common cause of blindness and is conventionally treated with surgery. Visual loss occurs because opacification of the lens obstructs light from passing and being focused on to the retina at the back of the eye. It is most commonly due to aging, but there are many other causes [8, 9].
7369 The reported prevalence of cataract was 42.28% and 95% confidence interval (CI) was 40.67-43.89. For men, the prevalence 40.82% and 95% CI 38.97-42.66. For women, the prevalence was 43.62% (95% CI, 41.91-45.33) and p-value for comparing gender was 0.606 [10].
The purpose of screening is the testing of evidently well people to find those at increased risk of having a disease or disorder. Although an earlier diagnosis usually has natural appeal, it had been known that earlier might not always be better, or worth the cost. Also, appropriate screening test is known that it can improve health [11].
In the aspect of developing cataracts, it will be important to detect the diagnosis early to reduce long-term problems through screening test. At the point of view, this research demonstrates the application of model to apply an easy, quick, and precise method for diagnosing early cataract based on machine learning algorithms, especially the ME model, by using a hospital screening center data. This study shows that ME model achieves superior performances compared to classical logistic regress ion model for the hospital screening datasets and the obtained results show that further significant feasibility of ME model in terms of hospital screening data can be applied.
The outline of this paper is organized in the following way. In section 2, the data used in this study is presented. In section 3, the ME model is
described. The application results of the ME model proposed in this paper are also presented in section 4. Finally, our work of this paper is summarized in the last section.
2. DATA COLLECTION AND METHOD
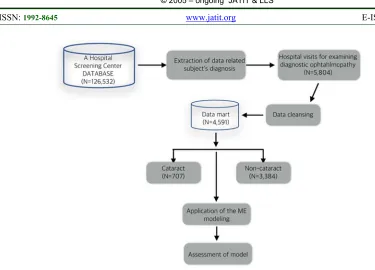
We used data from 126,532 diagnostic records who visited from one hospital screening center from 1994 to 2005 were collected. Examination items were measured such as medical examination by interview, blood pressure, body measurements, blood, urinalysis, stool, dental exam, eye/hearing test, cardiac function, gynecology, and nutrition in hospital screening center. Table 1 present measured components of hospital screening center.
Among the records, 5,804 subjects were visited hospital for examining diagnostic ophthalmopathy, and 1,210 subjects were excluded due to missing data. Thus, final analysis set with 4,591 cases were constructed and used for analysis, 707 of them are cataracts and the rest of them are non-cataract. Figure 1 provides the analysis process in this study. Each record has 28 attributes (medical examination items).
[image:2.612.92.467.61.331.2]7370 Table 1: Measured components of hospital screen center
As a result, we found 13 attribute risk factors such as age, BMI, WBC, glucose (Glu), blood urea nitrogen (BUN), albumin (Alb), alkaline phosphatea se (Alk. Phos), Kalium (K), Calcium (Ca), Creatin ine, Cholesterol (Chol), Triglyceride (TG), HDL influencing cataracts. These attributes which is statistically significant by using univariate analysis and 707 cataract cases and 3,884 non-cataract cases were existed in this study.
Variable selection was conducted for multivariate analysis (logistic regression) and applying ME model by using likelihood score suggested by Furnival and Wilson [12]. As a result, 6 risk factors such as glucose, blood urea nitrogen, albumin, alkaline phosphatase, kalium, and calcium were selected.
3. DESCRIPTION OF MIXUTRE OF EXPERT AND EM ALGORITHM
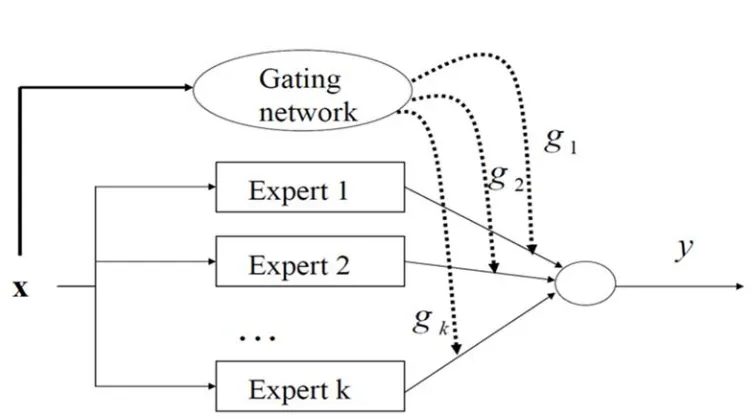
In this section, we briefly describe the ME model and the EM algorithm for estimating the parameters of ME model [13-14]. The ME model is composed of a gating network and several expert network, and the architecture of this model is illustrated in Figure 2. The gating networkgkis partition the input space
xinto region s corresponding to the various expert
networks, and uses a softmax function as shown in (1).
0 0
( , ) ( , ) k
i
s x
k s x
e g
e
(1)where T
i
sv x and vi is weight vector. The
gating network provides the coefficients of linear combination as truthful probabilities for expert networks. Also, the gating network is generalized linear function such as softmax function or the multinomial logit of intermediate variables vi.
All the expert networks are linear with 'generalized linear' which has a single output nonlinearity (McCullagh and Nelder, 1983). Each expert network produces an output vector y from
input vector x, and produces E xk( ) as a generalize
d linear function of the input x for k-th expert
network
( ) ( )
k i
E x f W x (2)
where Wi is a weight matrix and f( ) is Gaussian
or Bernoullii distribution in the case of regression /classification problems.
The overall output y of the ME model is the
following in (3).
1
( )
k
i i i
y g E x
(3)In equation (3), the values of gi are explained
multinomial probabilities which have the decision that terminates for ( , )x y in a regression problem.
Item Measured Components
Basic Information gender, age
Body measurement height, weight, BMI
Blood test RBC, Hb, Hct, MCV, MCH, MCHC, WBC, lymphocyte, eosinophil, platelet, ABO, RH
Liver function total protein, albumin, total bilirubin, AST, ALT, Alkaline phosphatase, r-GTP
Eye eyesight test, intraocular pressure, fundus examination
Metabolism and
electrolyte sodium, knitrogen, creatinine alium, chlorination, calcium, phosphorus, blood glucose, HBA1C, blood urea
Serum lipid total cholesterol, triglyceride, HDL, LDL
7371
The result of y is selected from a P y x W( | , i),
which is probability density. As I mentioned above,
i
W means the weight matrix or set of parameters of
the i-th expert network.
The total probability of ME model in generating
y from x is shown in (4).
[image:4.612.115.492.94.303.2]1
( | , ) k i ( | , )i
i
P y x g P y x W
(4)where is the set of both gating and expert
network parameters. Moreover, the probabilistic component of densities is generally known that is assumed to a Bernoulli distribution in the case of 2-class 2-classification, a multinomial distribution in the case more than 3-class classification, and a Gaussian distribution in the case of regression.
Based on the total probability equation in (4), estimating parameters in the ME model is considered as a maximum likelihood problem.
Jordan and Jacobs have proposed an EM algorithm for adjusting the parameters of the architecture. The EM algorithm consists of two steps, the E-step and M-step.
For the s-th epoch, the probabilities ( | , )P i x yt t
were interpreted the posterior probabilities ( )t
i
h
by computed in the E-step as shown in (5)
( ) ( )
( )
( ) ( )
1
( , ) | ,
( , ) | ,
s s
t i t t i
t
i N
s s
t i t t i
k
g x v P y x W
h
g x v P y x W
(5)The M-step solves the following maximization problems:
( 1) ( )
1
arg max log ( | , )
i
T
s t
i i t y i
W t
W h P y x W
(6)and
( 1) ( )
1 1
arg max T N log ( , )
s t
k t k
V t k
V h g x v
(7)where V is the set of all the parameters in the
gating network. Therefore, the EM algorithm is summarized as following [13-15]:
EM algorithm is summarized as following [13-15]:
1. For each data pair ( , )x yt t , compute the
posterior probabilities ( )t
i
h using the current values of
the parameters.
2. For each expert network i, solve a maximization
problem in Eq. (6) with observations
( , )
T1t t t
x y
and observation weights
( )1
T t i t
h
.
3. For the gating network, solve the maximization
problem in Eq. (7) with observations
( )
1
( , t ) T
t k t
x h
. 4. Iterate by using the updated parameter values.
4. RESULTS
7372 Table 2: Univariate Analysis of statistically significant
screening variables for cataract/non-cataract.
As mentioned before, a total of 4,591 cases visited a hospital screening center data for the diagnosis of cataract were collected between 1994 and 2005 and analyzed.
All statistical analysis and computation were performed R 3.4.1 (available at http://www.r-project.org) and R-studio 1.1.447 (available at http://www.rstudio.com). In order to find risk factors of cataract, we conducted univariate analysis comparing the characteristics of cataract and non-cataract by using two-sample t-test. Table 2 shows statistically significant 13 risk factors among 23 candidate risk factors. The mean age of cataract group (60.4±10.7 years) was more higher than non-cataract group (50.3±13.3 years). In cases of BMI, WBC, Glucose, Alk. Phos, K, Ca, creatinine, chol, and TG, cataract group were also more higher than non-cataract group. However, albumin and HDL were lower in cataract group than in non-cataract group.
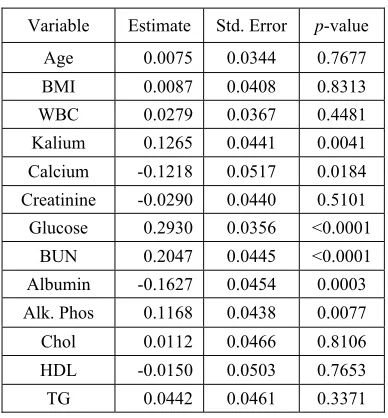
[image:5.612.321.515.161.370.2]A number of risk factors were selected by variable selection 6 risk factors such as Glucose, blood urea nitrogen, albumin, alkaline phosphatase, kalium, and calcium were finally selected by using multivariate analysis and variable selection method. Table 3 shows the result of logistic regression for 13 risk factors which is significant in univariate analysis. The regression coefficient estimates for the significant 6 risk factors were given in Table 3. Among 6 risk factors, the highest association factor of cataract was glucose (OR=1.34, p-value=<0.000
1), followed by BUN (OR=1.23, p-value=<0.0001),
Kalium (OR=1.13, p-value=0.0041), Alk. Phos
(OR=1.12, p-value=0.0077), Calcium (OR=0.89, p
-value=0.0184) and Albumin (OR=0.85, p-value=0.0
003).
Table 3: The result of logistic regression for 13 risk factors
Variable Estimate Std. Error p-value Age 0.0075 0.0344 0.7677 BMI 0.0087 0.0408 0.8313 WBC 0.0279 0.0367 0.4481 Kalium 0.1265 0.0441 0.0041 Calcium -0.1218 0.0517 0.0184 Creatinine -0.0290 0.0440 0.5101 Glucose 0.2930 0.0356 <0.0001
BUN 0.2047 0.0445 <0.0001 Albumin -0.1627 0.0454 0.0003 Alk. Phos 0.1168 0.0438 0.0077 Chol 0.0112 0.0466 0.8106 HDL -0.0150 0.0503 0.7653 TG 0.0442 0.0461 0.3371
Classical logistic regression and ME model was described, and present classifying of the hidden subgroups. In this analysis the ME model used for the diagnosis of cataract was k=2 expert networks.
That is, the ME model formed two local experts and a gating network. In order to focus on cataract diagnosis, total cases were used in this analysis.
The ME architecture supposed for the diagnosis of cataract is shown in Figure 3. Each expert network produces its output Oi as a generalized linear
function of the input x. The gating network g x( , )i
is also generalized linear.
Table 4: Confusion Matrices of the Classifiers. Variable
Non-Cataract (n=3,384)
Cataract
(n=707) p-value Age 50.3±13.3 60.4±10.7 <0.001 BMI 23.9±3.8 24.1±3.0 0.047 WBC 6.4±2.5 6.6±1.9 <0.001 Glucose 98.0±29.4 114.3±46.3 <0.001 BUN 14.4±4.1 15.7±4.8 <0.001 Alb 4.8±0. 3 4.5±0.4 <0.001 Alk.Phos 72.7±27.8 79.6±32.2 <0.001 Kalium 4.2±0.4 4.3±0.4 <0.001 Calcium 9.5±0.6 9.4±0.5 <0.001 Creatinine 0.9±0.2 1.0±0.4 0.010
Chol 197.5±37.3 201.0±38.7 0.022 TG 145.1±99.5 157.7±111.7 0.005 HDL 51.6±12.8 50.0±12.0 0.003
[image:5.612.334.488.543.677.2]7373
Classifier Type
Desired Result
Output Result
Non-Cataract
Cataract
Logistic
Non-cataract 3844 682
cataract 40 25
ME
Non-cataract 3687 118
cataract 197 589
To estimating the ME parameters, the initial values of gating network and expert networks were chosen randomly. The ME model and classical logistic regression model were described and compared receiver operating characteristic (ROC) curves for validation of diagnosis prediction model.
To comparing the performance of a classification model, the confusion matrix was described in Table 4. According to the confusion matrix, 40 cases were incorrectly by logistic regression as cataract patient in non-cataract cases.
However, 197 cases were incorrectly by ME model as cataract patient in non-cataract cases and 589 cases were classified correctly cataract patients. In order to determine the performance of the classifiers, the classification accuracies such as sensitivity, specificity, accuracy were given in Table 5. Accuracy are defined as the proportion of the number of correct decisions in total number of cases. It calculates (TP+TN)/(TP+TN+FP+FN) where TP, FN, FP, and TN represent the number of true positives, false negative, false positive and true negative, respectively.
Sensitivity means the proportion of positives that are correctly identified as such the percentage of cataract people who are correctly identified as having the cataract, it calculates TP/(TP+FN).
[image:6.612.91.296.71.222.2]Specificity measures the proportion of negatives that are correctly identified as such the percentage of non-cataract people who are correctly identified as not having the cataract, it calculates TN/(TN+FP).
Table 5: The values of statistical parameters of classifi cation accuracy
Classifer Type
Classification accuracies(%)
Sensitivity Specificity Accuracy
Logistic 3.54 98.97 84.27
ME 84.58 94.92 93.33
[image:6.612.316.522.145.307.2]The comparison results showed that the ME model (accuracy is 93.33%) is better in prediction than logistic regression (accuracy is 84.27%).
Figure 4: Posterior probability of ME model
Although the ME model was lower than logistic regression in the value of specificity, the other parameter values (sensitivity, accuracy) was higher than logistic regression. Thus, the testing performance of the ME model was found to be more appropriate than the logistic model.
[image:6.612.320.517.509.697.2]The purpose of the classification is to allocate the input data to one of several classes which have the probability of class membership [4]. Estimated posterior probability of ME model was illustrated in Figure 4. The values of statistical parameters of ME models for two components are given in Table 6.
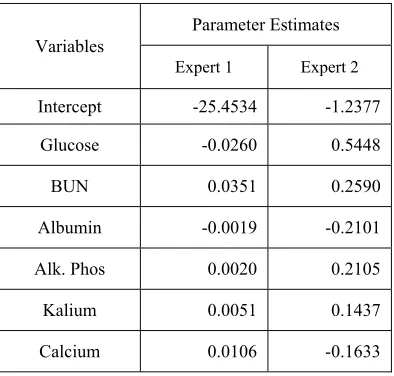
Table 6: Parameter estimates of ME models for two components
Variables
Parameter Estimates
Expert 1 Expert 2
Intercept -25.4534 -1.2377
Glucose -0.0260 0.5448
BUN 0.0351 0.2590
Albumin -0.0019 -0.2101
Alk. Phos 0.0020 0.2105
Kalium 0.0051 0.1437
Calcium 0.0106 -0.1633
7374 (lower risk group) is lower parameter values then expert 2 (high risk group).
Compared with standalone logistic regression, the parameter estimates were higher for expert 2 than for logistic regression. In this result, it is suggested that expert 2 is a high risk group for detecting cataract. In detail, the parameter estimate of glucose was more higher in expert 2(OR=1.72) than in logistic regression (OR=1.34). The remain values of OR were 1.29 (BUN), 0.81 (Albumin), 1.23 (Alk. Phos), 1.15 (Kalium), and 0.84 (Calcium), which is more higher than standalone logistic regression.
Conversely, in the case of expert 1, the parameter estimates were much smaller than the standalone logistic regression. In detail, For glucose, the OR was 1.34 (logistic) and 0.97 (expert 1), which was different trend with expert 2. In the case of BUN, the OR was 1.23(logistic) and 1.03 (expert 1). The estimated OR of albumin was 0.85 (logistic) and 0.99 (expert 1). The OR of alk.phos was 1.12 (logistic) and 1.00 (expert 1), kalium was 1.13 (logistic) and 1.01 (expert 1), and calcium was 0.89 (logistic) and 1.01 (expert 1). These results show that odds ratio of all risk factors are close to 1. This suggest that the model of expert 1 have little effect on cataract.
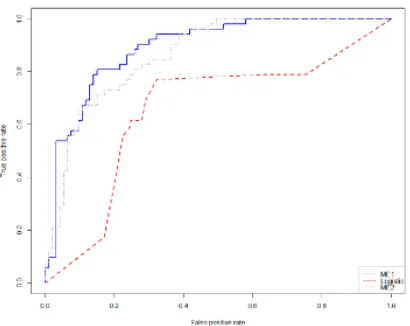
[image:7.612.91.296.497.660.2]The performance of the ME model can be evaluated by plotting ROC curve for the test (Figure 5). The definition of ROC curve is a plot of the sensitivity versus (1-specificity) of a screening test, where the different points on the curve correspond to different cut-off points used to designate test-positive [17].
Figure 5: ROC curves of the classifiers
ROC plot in Figure 5 shows that the performance of the ME model is higher than that of the logistic regression.
One general method to quantify the diagnostic accuracy of a laboratory test is to present its performance by a single number. The most convenient measure is the area under the ROC plot (AUC). A test with no better accuracy than chance has an AUC of 0.5, a test with perfact accuracy has an AUC of 1. The estimated AUCs of each expert are higher (AUC of expert 1=0.83, AUC of expert 2=0.81) than logistic regression (AUC=0.76).
Thus, the performance of ME showed in this research was present to be higher than that of the classical logistic regression.
5. CONCLUSIONS
The purpose of medical informatics fields has been known that an inductive knowledge finds the decision characteristics of the diseases and can then be used to diagnose future patients with uncertain disease states [18]. Also, the prevention and prediction of disease in recent are regarded as important rather than treatment. Thus, the application of the classification model and the illustration of the prediction model for clinical data are important issues.
Health checkups are aimed at early detection and changes of risk factors for chronic disease outbreak, and to check current health status. In generally, it has been known that the development of cataracts can be reduced through early diagnosis from screening test.
In this research, cataract was considered in terms of early diagnosis of disease through the perspective of statistical data analysis. Cataract are complex disease which is known to be caused by risk factors associated with physical information, liver function, metabolism, electrolyte, and serum lipid. Therefore, it is considered to consist of several subgroups according to their characteristics.
In the point of view, this paper illustrated the feasibility of ME model to improve classification accuracy and present prediction model using a hospital screening data. The performances of the two classification methods (ME and classical logistic regression) were compared, and the result present that the ME model was higher than the other method in aspect of diagnostic accuracies such as sensitivity, specificity, accuracy, and ROC curve. The AUC results also showed that the ME model was higher than the standalone logistic model.
7375 This method will be expected to assist physicians in the diagnosis of cataract prediction in terms of diagnostic decision support mechanism. Furthermore, each estimated expert can be regarded as latent subgroups which is specific characterizing subgroups such as low or high risk group. This research does not consider data splitting for analysis because of focusing on cataract diagnosis. Future work will examine the efficiency of the ME model in splitting datasets and multi-class problems. Also, it will plan to be applied the latent risk group prediction by comparing the ophthalmolgic examination with the health checkup data.
DISCLOSURE STATEMENT
The authors declare that there are no potential conflict of interest.
ACKNOWLEDGEMENT
This research was supported by Basic Science Research Program through the National Research Foundation of Korea (NRF) funded by the Ministry of Education (2017R1D1A1B03029018).
REFRENCES:
[1] A. Belle, R. Thiagarajan, S. Soroushmehr, F. Navidi, D. Beard, and K. Najarian, “Big data analysis in healthcare”, Biomed Research International, Vol. 2015, 2015, 370194.
[2] A. Gandomi, M. Haider, “Beyond the hype: Big data concepts, methods, and analytics”,
International Journal of Information
Management, Vol. 35, No. 2, 2015, pp. 137-144.
[3] W. Raghupathi, V. Raghupathi, “Big data analytics in healthcare: promise and potential”,
Health Information Science and Systems, Vol.
2, No. 3, 2014.
[4] E. Ubeyli, “A mixture of experts network structure for breast cancer”, Journal of Medical Systems, Vol. 29, No. 5, 2005, pp. 569-579.
[5] S. Myoung, “Modified mixtue of experts for the diagnosis of perfusion magnetic resonance imaging measures in locally rectal cancer patients”, Healthcare Informatics Research., Vol.
19, No. 2, 2013.
[6] R. Jabos, M. Jordan, S. Nowlan, and G. Hinton, “Adaptive mixture of local experts”, Neural Computation, Vol. 3, No. 1, 1991, pp. 79-87.
[7] S. Yuksel, J. Wilson, and P. Gader, “Twenty years of mixture of experts”, IEEE transactions of
Neural Networks and Learning Systems, Vol. 23,
No. 8, 2012, pp. 1177-1193.
[8] D. Pascolini, S. Mariotti, “Global estimates of visual impairment: 2010”, British Journal of
Ophthalmology, Vol. 96, No. 1, 2012.
[9] A. Foster, “Vision 2020: the cataract challenge”,
Community Eye Health, Vol. 13, No. 34, 2000.
[10] S. Park, J. Lee, S. Kang, J. Hyon, and K. Park A. Gandomi, “Cataract and cataract surgery: nationwide prevalence and clinical determinants”, Journal of Korean Medical Science, Vol. 31, No. 6, 2016.
[11] D. Grimes, K. Schulz, “Uses and abuses of screening tests”, The Lancet, Vol. 359, No.
9309, 2002, pp. 881-884.
[12] G. Furnival, R. Wilson, “Regression by leaps and bounds”, Technometrics, Vol. 16, 1974, pp.
499-511.
[13] G. McLachlan, D. Peel, Editor, “Finite Mixture Models, Wiley, New York”,
[14] T. Hastie, R. Tibshirani, and J. Friedman, Editor, “The Elements of Statistical Learning, Springer, New York”,
[15] J. Kay, D. Titterington, “Editor, Statistics and Neural Networks, Oxford, New York”, [16] M. Jordan, R. Jacobs, “Hierarchical mixture of
experts and the EM algorithm”, Neural
Networks, Vol. 8, No. 9, 1994, pp. 1409-1431.
[17] J. Hanley, B. McMeil, “The meaning and use of the area under a receiver operating characteristic (ROC) curve”, Diagnostic Radiology, Vol. 143,
1982, pp. 29-36.
[18] E. Ubeyli, “Comparisons of different classification algorithms in clinical decision-making”, Expert System, Vol. 24, 2007, pp.