http://www.scirp.org/journal/ns ISSN Online: 2150-4105 ISSN Print: 2150-4091
Evolution of a Water Pendant Droplet: Effect of
Temperature and Relative Humidity
Etienne Portuguez1, Arnaud Alzina1, Philippe Michaud1, Maksoud Oudjedi2, Agnès Smith1*
1Université de Limoges, SPCTS, CNRS, ENSCI, Limoges, France 2Université de Limoges, ENSCI, Limoges, France
Abstract
As part of a better understanding of drying liquids within porous materials, measurements from 293 to 343 K of deionized water surface tension in air as a function of relative humidity are exposed. Experimental work was carried out using the pendant drop method coupled with image analysis within an adapted instrumented climatic chamber. Results show that surface tension li-nearly decreases when relative humidity increases. Although the effect of hu-midity is less compared to that of the temperature and even less compared to a surfactant impact, it must not be neglected and values have to be mentioned when dealing with water evaporation. Modifying surface tension also affects the pendant drop shape. The drying kinetics of the pendant drop volume and its outer shell are connected to this change of shape. Steam in the air can be assimilated to a wetting agent, hence a surfactant, and can be used in an envi-ronmental-friendly way to ease the drying stage. Indeed, the challenge is to limit the risk of cracking and damaging pieces during this crucial step in ma-terial processing.
Keywords
Pendant Drop, Surface Tension, Water, Relative Humidity, Temperature, Drying
1. Introduction
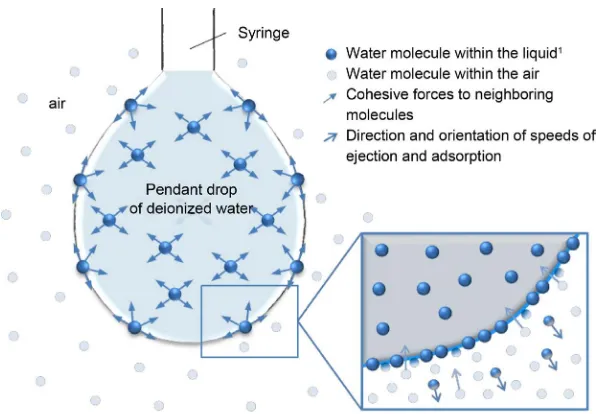
Surface tension is due to cohesive forces between liquid molecules. This pheno-menon results from molecules at liquid-air interfaces which are missing some of their attractive interactions. In this particular configuration they are not in a sta-ble energy state. The liquid adapts to this situation and surface tension dictates reshaping in order to minimize its area in contact with the surrounding atmos-phere, leading to numerous known liquid behaviors [1][2], for instance coffee How to cite this paper: Portuguez, E.,
Alzina, A., Michaud, P., Oudjedi, M. and Smith, A. (2017) Evolution of a Water Pen- dant Droplet: Effect of Temperature and Relative Humidity. Natural Science, 9, 1-20.
http://dx.doi.org/10.4236/ns.2017.91001
Received: December 1, 2016 Accepted: January 14, 2017 Published: January 17, 2017
Copyright © 2017 by authors and Scientific Research Publishing Inc. This work is licensed under the Creative Commons Attribution International License (CC BY 4.0).
stains [3], or drops coalescence [4] [5]. Another example is a porous material where water is used for shaping. In ceramic processing for instance, drying is a necessary step to remove the water before firing. Since water has a high surface tension, a badly controlled drying process can lead to final ceramic pieces with several defects such as cracks [6][7]. Several parameters can be adjusted to re-duce liquid-air surface tension, such as increasing temperature [8], or adding surfactants (wetting agents) [9]. Besides, there is another factor which impacts on the drying stage and thus on surface tension, namely relative humidity of the drying air. This last parameter is very often left aside. Indeed when drying a porous material piece, the set of temperature and relative humidity parameters is very often motivated by empirical observations and comes more under instinc-tive choices than theoretical explanations. Some publications in other scientific fields reported the effects of relative humidity on surface tension. For instance, the spreading dynamics of a drop of blood can be modified [10], as well as the surface tension of lung surfactant films [11]. From this point of view, where the effects of humidity are non-negligible, Erbil did underline and deplore the lack of relative humidity information in numerous recent papers when water drop evaporation was tackled as it can alter the evaporation rate [12]. However, Pérez- Díaz et al. recently provided some interesting behaviors about how partial pres-sure of water vapor acts on surface tension at the liquid water-air interface at 278, 283, 288 and 293 K [13]. These data and those of the preceding examples were obtained at body temperature or at lower temperatures and could not be used in a drying study where, for instance, the temperature of 333 K is com-monly used.
This paper provides results about how the relative humidity affects the liquid surface tension at water-air interface. Using the pendant drop technique, it de-scribes surface tension vs. humidity from 293 K up to 343 K. To our knowledge, this range of temperature has never been investigated and this study provides new useful information. Beyond the effect on surface tension, this study also aims to provide values for future studies. From the experimental data, a new phenomenological relation is proposed, which describes the evolution of the water-air surface tension in the 278 - 343 K temperature range and for a relative humidity between 20% and 100%. The study also focuses on the water pendant drop drying kinetics. The pendant drop volume, as well as its outer shell during drying is presented at temperatures from 303 K up to 343 K and relative humidi-ties from 35% up to 75%.
2. Materials and Methods
2.1. Climatic Chamber
Figure 1. Experimental device for pendant drops measurements.
control the humidity of air with an accuracy of 0.1%. If the relative humidity is higher than the set point, it is stabilized using a cooling unit linked to the cham-ber. The environmental chamber is computer controlled and data can be checked in real time. The pendant drop technique is used to determine the sur-face tension [14]. The climatic chamber has a zero diopter glass door to directly observe the pendant drop. As it was not possible to put a collimated light source into the chamber given the harsh conditions, a white background has been add-ed to the system and a white ladd-ed diffuses light to obtain a sufficient contrast to observe the pendant drops. The system of the climatic chamber is limited at low (~283 K) and high (~353 K) temperatures. Indeed, it is difficult to reach low rel-ative humidity levels at low temperatures, and at high temperatures the cooling unit laboriously reaches the highest relative humidity levels. Therefore, results that are presented in this paper using this specific equipment are limited to temperatures between 293 and 343 K and relative humidities from 20% to 100%. To avoid any temperature gradient, before creating a pendant drop, the liquid within the syringe is placed inside the climatic chamber so that it is at the same temperature as the target temperature.
2.2. Pendant Drop
an initial volume of 8.0 µL ± 0.1 µL. Deionized water (conductivity <1 mS∙m−1) was used for drops and for the water tank providing humidity into the climatic chamber, thus the studied liquid and surrounding vapor have the same compo-sition. Water density is of 1.000 ± 0.005 g∙mL−1 at 293 K and for the presented work it can decrease to 0.977 ± 0.005 g∙mL−1 at 343 K. The pendant drop method is suitable in the case where the temperature or the relative humidity change [15]. Indeed, comparing to other methods, this is the most simple, accurate and reliable method for our equipment [16].
[image:4.595.127.541.405.669.2]When realizing the surface tension measurements, the liquid is located within the syringe which is itself contained in the climatic chamber (Figure 2(a)). For each measurement at a given temperature and relative humidity, the system is left to equilibrate for at least 20 minutes. Then, the pendant drop is created and one image acquisition is realized immediately after. The evaporation process is considered to be negligible between the drop creation and the image acquisition. Indeed, the volume and the exchange surface of the pendant drop present almost no variations during the first three minutes of evaporation, as described later on Figure 11 and Figure 12. The literature reports a temperature discontinuity at the liquid-vapor interface when evaporating water, with the temperature always be-ing higher on the vapor side. When considerbe-ing a flat water/vapor interface in-stead of droplets at about 300 K, the average difference ranges between 2.6 to 7.8 K at low relative humidity (i.e. <15%) [17][18]. In the case of evaporating droplets,
literature reports an average difference below 1 K at high relative humidity (i.e. >50%) [19]. Therefore in the present work, there might exist a temperature offset in the presented values, but the observed trends are not impacted. As the liquid is contained within the syringe until the drop creation, the deionized wa-ter is at the same temperature as the target temperature required from the cli-matic chamber. Once the pendant drop is created, it is suspended in a controlled environment with a permanent airflow (Figure 2(b)). During all experiments at a given temperature and relative humidity, air is circulating within the climatic chamber and is permanently renewing the air around the pendant drop. Thus, the system is not static and the air at the surface of the drop is renewed conti-nuously.
2.3. Image Acquisition
In order to obtain suitable images of the pendant drop at regular time intervals, a monochrome camera with charge-coupled device (CCD) was used, model UI-148SE-M from manufacturer IDS Imaging. The camera has a 5 M pixel 1/2" sensor, a resolution of 2560 × 1920 pixels and a rate of 6 images∙s−1. It was coupled with an optical QIOPTIC which is made of two components, one model 35-08-06-000 and one model 35-00-03-000 which gives with a QIOPTIC 12.5:1 zoom an optical of 100 mm/0.062 1/2".
2.4. Surface Tension Data Processing
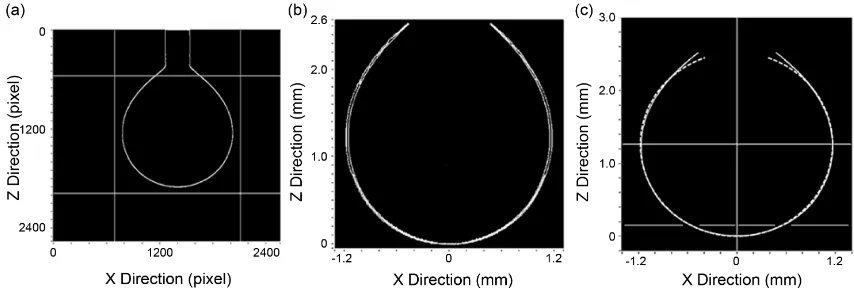
[image:5.595.111.538.548.692.2]The water liquid-air surface tension was obtained by analyzing the drop geome-try using the Axisymmetric Drop Shape Analysis (ADSA) method [15][20]. A representation of the ADSA routine is given on Figure 3. As water density changes with temperature, measurements are made using values from tables taken from the literature [21]. The analysis software created in the laboratory in-itially allows extracting the profile of the pendant drop (Figure 3(a)). In a first step a non-linear regression is realized on the profile which allows to access to a first value of surface tension (Figure 3(b)). This value can be compared afterwards using a second method where a simulated curve comes fitting the experimental
profile by adjusting precisely the position in the plan, the symmetry to the axis and the apex of the pendant drop. This last measurement uses least squares me-thod and is carried out between two heights of drop (horizontal lines on Figure 3(c)) [22]. Moreover, the drop position, its rotation and the curvature at the apex are used as optimization parameters.
2.5. Pendant Drop Volume and Area Evaluation
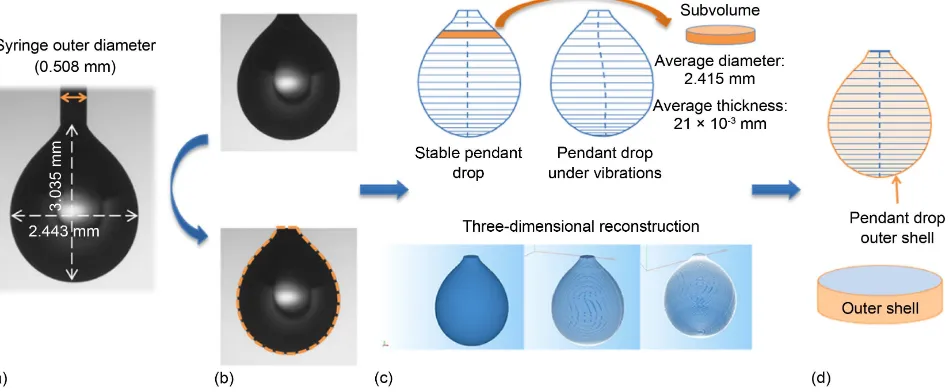
The present study also proposes an evaluation of the volume and the area of the pendant drop during drying. Image analysis was used to realize these measure-ments, and consisted in a three steps procedure. The first step consisted in pro-ducing pendant drops with an initial volume of 8.0 µL ± 0.1 µL, which were ob-served during drying. The millimetric dimensions of the pendant drop are given in Figure 4(a). Images were taken each minute. In the second step, after the im-age acquisition, pictures were cropped in order to retain the liquid part and re-move the syringe needle. As the pictures were given in grayscale, a threshold al-lowed to detect the edge of the pendant drop (Figure 4(b)). Finally in the third step, using the outer diameter of our Hamilton® syringe needle as a standard to convert pixels values in meters, namely 5.08 × 10⁻⁴ m, a program created in the laboratory then calculated the volume and the area of the pendant drop. More precisely, the pendant drop was divided into subsections and a circular revolu-tion allowed the evaluarevolu-tion of all the sub volumes. The volume then resulted from their addition.
[image:6.595.64.538.498.694.2]This method not only provided an accurate evaluation of the drop volume but also allowed to locate precisely the gravity center of each pendant drop sub vo-lume, which minimized the effect of any shift due to additional micro-vibrations in the system associated to the convection within the climatic chamber. The pendant drop was then rebuilt in three dimensions (Figure 4(c)). To evaluate
the exchange surface, only the outer shell was retained. Moreover, the surface in contact with the tip of the syringe needle was not considered in this evaluation (Figure 4(d)).
The pendant drop volume can influence the obtained surface tension values. Recently, Berry et al. introduced a new parameter, namely the Worthington number Wo, in order to characterize the surface tension measurement precision [23]. First written as the ratio of the pendant drop volume to the maximum possible pendant drop volume, this dimensionless number is directly connected to the outer diameter of the syringe needle and pendant drops close to the criti-cal detachment volume present the most accurate measurements. This number is written as presented in Equation (1):
π
d n
Wo= ∆ρgV γD . (1)
where ∆ =ρ ρd −ρ is the density difference between ρd , the drop phase density and ρ the continuous phase (air) density in kg∙m−3; g is the standard acceleration due to gravity in m∙s−2;
d
V is the volume of the pendant drop in
m3; γ is the water-air surface tension in N∙m−1; n
D is the syringe needle outer
diameter in m.
When the volume is not sufficient, Wo values are much lower than 1. Good values of surface tension are obtained for Wo values greater than 0.6. In the case of water considered at 293 K within an air saturated by vapor, the surface tension is equal to 72.75 ± 0.36 mN∙m−1 [8]. A needle with an outer diameter of 5.08 × 10⁻⁴ m gives a Wo value of about 0.7, which is an acceptable value to evaluate surface tension from the different pictures.
The presented equipment and numerical tools enabled to carry out a set of measurements at different temperatures and relative humidities.
3. Results and Discussion
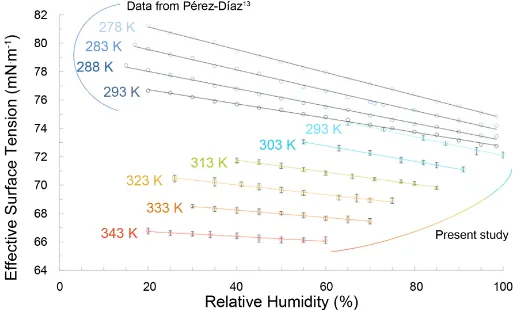
[image:7.595.244.501.559.714.2]Results presented in Figure 5 show that surface tension at the water-air interface decreases as relative humidity increases. The obtained values are in good agreement and in the continuity of the work of Pérez-Díaz et al. at low temperatures represented by the first four lines at 278, 283, 288 and 293 K [13].
All other points presented in this chart are the results of the average of five measurements for each given temperature and relative humidity H. Vertical error bars correspond to the associated standard deviation. A linear dependency of γ as a function of H is observed. This effect is found to be less compared to the impact of increasing temperature. Besides, with increasing temperature, the relative humidity influences less and less surface tension, which can be observed on related slopes. In the following, we will examine the possible relations between the surface tension and the different parameters which can modify it, namely relative humidity, temperature and the addition of a surfactant.
3.1. Relation between Relative Humidity and Surface Tension Pérez-Díaz et al. were the first to propose an interpretation of decreasing surface tension γlv with increasing relative humidity [13]. γlv is expressed in N∙m−1 and represents the surface tension at liquid-vapor interface. Considering an infi-nite flat water surface or a surface element of a spherical water droplet in equili-brium with air at constant temperature and relative humidity (Figure 6), the forces at any point on the interface are described by Equation (2):
int+ ext =0.
F F (2)
where Fint (respectively Fext) corresponds to the forces applied perpendicu-larly to the surface by the liquid (respectively the air) just underneath (respec-tively above) the interface. Projecting according to the unitary normal n gives
Equation (3):
int ext
F =F . (3)
where Fint (respectively Fext) corresponds to the norm of Fint (respectively
ext
F ). However, it should be emphasized that in practice, when a droplet dries, there is a permanent flow of evaporating molecules that come from the liquid towards the exterior. If the liquid is under the form of a spherical droplet, Fint from Equation (3) becomes Equation (4):
2
int 4π drop int
F = R P . (4)
[image:8.595.307.440.582.702.2]where Rdrop is the radius of the water droplet and Pint is the internal pressure. In this situation, Fext has an additional term in order to take into account the tendency of the liquid to reduce its surface area (Equation (5)):
2
ext 4π drop ext
F = R P +Fγ. (5)
where Pext is the external pressure outside the liquid and Fγ is the norm of
the force related to surface tension.
Fγ is obtained by calculating the work necessary to diminish the radius of the
spherical drop using Newton’s mechanics (Equations (6) and (7)).
drop
dWγ =F Rγd . (6)
dWγ =γdA. (7) where A represents the area of the drop. Combining Equations (6) and (7), Fγ can be written as follows (Equation (8)):
(
d d drop)
8 π dropFγ =γ A R = γ R . (8)
Replacing all terms in Equation (3) using Equations (4), (5) and (8), it gives Equation (9):
(
2Rdrop)
Pint Pext Pγ = − = ∆ . (9)
This is the standard equation of the equilibrium at liquid-air interface. It is important to underline that this equation is true only when interface is at equili-brium. Thus, considering Newton’s third law about reciprocal actions, this flow can be directly assimilated to an overpressure in the air which aims to balance the ejection of water molecule during evaporation. Thus in the case of evaporat-ing a liquid, a pressure term appears, δPevap. Thus, Equation (9) becomes Equa-tion (10):
drop evap
2γr R = ∆ +?P δP . (10)
evap P
δ term was first proposed by Pérez-Díaz et al. [13]. It can also be written as the evaporation mass flow per unit area multiplied by the mean normal com-ponent of the speed of ejection of the molecules from the surface of the liquid (Equation (11)):
evap n
P f v
δ = ⋅ . (11)
where f and vn are respectively the mass flow per unit area in kg∙m−2∙s−1 and the speed of ejection in m∙s−1.
As there are more and more water molecules coming out of the liquid surface as the relative humidity of the drying air decreases at constant temperature, the mass flow can be rewritten as Equation (12):
( )(
1)
f =a T −H . (12)
where a T
( )
is a function of temperature T (temperature of both the liquid andthe environment) and H is the relative humidity of the drying air. At this point, the assumption made by Pérez-Díaz et al. is to consider that the mean speed of ejection vn depends only on the temperature which increases the kinetic agi-tation. Then, δPevap becomes Equation (13):
( )
(
)
evap n 1
P a T v H
δ = − . (13)
Therefore, considering that drop
2
P R
value of surface tension when there is equilibrium (no evaporation) and com-bining Equation (13) with Equation (10), the effective surface tension γr should be written as Equation (14):
( )
(
drop)
(
1)
2r a T vn R H
γ = +γ − . (14)
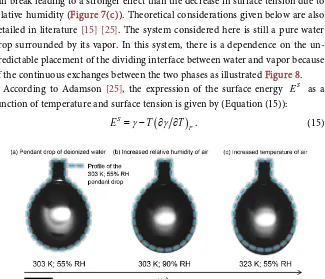
The drier the air is, the closer the droplet gets to the spherical shape given Figure 7(a). According to new expression of surface tension presented in Equa-tion (14), when H increases, γr should decrease linearly. The water molecules surrounding the liquid are numerous, so there is a decrease of surface tension due to local overpressure in the air. An illustration of the mechanism is given Figure 7(b). Increasing relative humidity generates an outside overpressure compensated by the adsorption of water molecules at the liquid surface, thus reducing liquid-air surface tension. However, if Equation (14) allows a physical interpretation, it includes an unknown temperature related term a T
( )
whichmakes it impossible to use in practice.
3.2. Relation between Temperature and Surface Tension
Publications underlined how temperature affects surface tension, when the liq-uid is pure water or binary mixtures of water and alcohols [8][24]. When tem-perature rises, kinetic agitation and evaporation rate increase. Thereby, surface tension generally decreases for the molecular interactions become less impor-tant. In the case of water for example, the weak hydrogen bonds between two molecules are weakened when the temperature increases. In this situation bonds can break leading to a stronger effect than the decrease in surface tension due to relative humidity (Figure 7(c)). Theoretical considerations given below are also detailed in literature [15] [25]. The system considered here is still a pure water drop surrounded by its vapor. In this system, there is a dependence on the un-predictable placement of the dividing interface between water and vapor because of the continuous exchanges between the two phases as illustrated Figure 8.
According to Adamson [25], the expression of the surface energy S E as a function of temperature and surface tension is given by (Equation (15)):
(
)
S
P
[image:10.595.214.539.418.697.2]E =γ−T ∂ ∂γ T . (15)
Figure 8. At the liquid-air interface, there is a continuous exchange between water molecules of the liquid phase and water molecules from the vapor phase.
It is observed that in the case of water, γ decreases linearly with temperature [8]. This means that ES remains constant and equal to γ when temperature increases until the temperature approaches the liquid’s critical temperature TC where ES drops to zero. Empirical approaches used critical properties and molar volume to predict the surface tension of pure liquids, in the case where the air is saturated by the liquid’s vapor. For instance, Eötvös derived an equation in 1886 by comparing the surfaces on the basis of the number of similarly shaped and symmetrically packed molecules per unit area [26][27]. Then he proposed Equation (16):
( )
2 3(
)
M C
V k T T
γ = − . (16)
where VM is the molar volume of the liquid in m3∙mol−1, VM =MW ρL, MW and ρL are the molar mass in kg∙mol−1 and the liquid density kg∙m−3 respec-tively. k is the Eötvös constant with a typical value 2.1 × 10⁻⁷ J∙K−1∙mol−2/3 for non-associated liquids. In the case of water which is an associated liquid,
5
1.8 10
M
V = × − m3∙mol−1, TC = 647 K at a critical pressure of 22.3 MPa and k has a lower value which varies from 1.39 × 10⁻⁷ J∙K−1∙mol−2/3 at 273 K to 1.48 × 10⁻⁷ J∙K−1∙mol−2/3 at 343 K.
However, it should be emphasized that this relation presented in Equation (16) and others resulting from it are empirical in nature. So far, nobody to our knowledge succeeded to propose a strict thermodynamically approach to predict the evolution of surface tension as a function of temperature [15]. Moreover, Equation (16) is only valid when air is saturated in vapor, and not for a specific relative humidity. Thus, Equations (14) and (16) cannot be used to calculate surface tension at any relative humidity or any temperature.
3.3. Role of Relative Humidity as a Surfactant
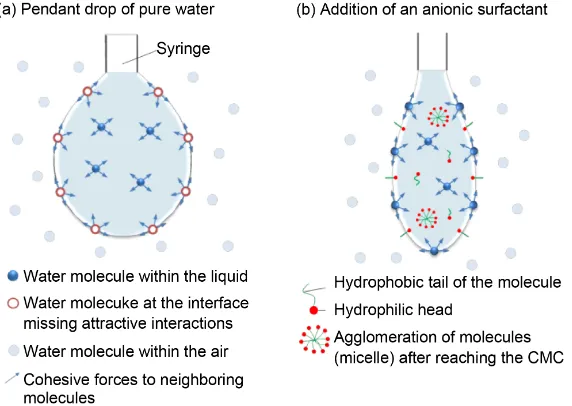
[image:11.595.224.524.67.274.2]Indeed, our experimental results show that steam can be assimilated to a surfactant as it lowers the surface tension.Without any additive, a water pendant drop is closer to a spherical shape (Figure 9(a)). Surfactants can be used in water to lower its surface tension [28]. They have a greater affinity for the surface than the volume medium. A surfactant can be described by the combi- nation of a polar head group and a long carbon chain. At the surface, the molecules align so that the polar head is in contact with water and the carbon chain is oriented towards the air. When a surfactant is added at low concentration to a pure water droplet, the surface tension decreases as the amount of surfactant at the surface increases as illustrated in Figure 9(b).
This behavior is well described applying Langmuir adsorption isotherms to a water droplet mixed with a surfactant [29]. In this adsorption model, a continuous monolayer of adsorbed molecules surrounding a homogeneous surface is con- sidered. In order to simplify, a neutral solute is considered, namely a surfactant. Adsorption isotherm expression at water/air interface is given by Langmuir equation and can be written as (Equation (17)):
(
1)
S
aC aC
Γ = Γ + . (17)
where Г represents the amount of solute per unit area in mol∙m−2, ΓS the adsorption at saturation in mol∙m−2 (Γ = ΓS for a complete monolayer), a is the Langmuir-Szyszkowski adsorption constant in L∙mol−1 and C the molar concen- tration of solute in mol∙L−1.
Using the Gibbs-Duhem equation at constant temperature and composition allows writing Equation (18):
d id i
A γ = −n µ . (18)
where A is the area of the interface in m2, γ is the liquid/air surface tension in N∙m−1,
i
n in mol and µi in J∙mol−1 are respectively the amount and the chemical
[image:12.595.233.519.502.705.2]potential of substance i within the system. The chemical potential can be expressed as (Equation (19)):
0
ln
i
µ =µ +RT C. (19)
where 0
µ represents the chemical potential of substance i in the standard state,
R is the ideal gas constant in J∙K−1∙mol−1, T the temperature in K and C is the absolute value of the molar concentration of the solute.
Combining Equations (18) and (19) gives another expression of interfacial surface tension (Equation (20)):
(
)
0
ln 1
S
RT aC
γ γ= − Γ + . (20)
where γ0 in N∙m−1 is the interfacial tension when there is no solute mixed with the liquid. When no solute is added to the liquid, the surface tension value is
0
γ . When there is a small amount of solute, 0 S
RTaC
γ γ≈ − Γ . For greater C
values, 0
( )
ln
S
aC
γ γ≈ − Γ .
In other words, in the last case where the surface is saturated by surfactant molecules, the system then hits the critical micelle concentration (CMC). At this precise concentration, molecules start forming micelles (see Figure 9(b)). If the concentration exceeds CMC, then surface tension no longer changes. It is very common to use surfactants in ceramic processing as they act on surface tension, they also play an important part on the drying stage. Relations involving the surface concentration of surfactant to access surface tension of water/surfactant mixes are also proposed in the literature [30].
Nevertheless, the different presented expressions do not allow to directly use a relative humidity value.
3.4. New Phenomenological Relation between Surface Tension, Temperature and Relative Humidity for Water
[image:13.595.64.540.565.703.2]Previous relations have shown it is not possible to predict the variations of surface tension when both the relative humidity and the temperature change. In order to show the surface tension dependence with temperature and relative humidity, two perspectives of a three dimensional representation are given in Figure 10 using a second order polynomial regression fitted on our experimental
values. Data from Pérez-Díaz et al. study are also plotted [13], which gives an evolution of surface tension versus relative humidity from 278 to 343 K. Both surfaces present two curvatures which show surface tension values cannot be given without precising both the temperature and relative humidity.
Regression coefficients obtained with the two sets of values are given on Table 1. Coefficients a and d related to relative humidity are lower than coefficients b and e, related to temperature. Therefore temperature has a predominant ef-fect. The equation contains a coupled term which underlines that the effects of temperature and relative humidity cannot be dissociated. The d term is also negative which corresponds to the surfactant effect of relative humidity. Com-pared to other theoretical approaches presented in the literature [13] [25][26], this phenomenological relation allows a numerical evaluation of the effective surface tension at a given temperature and relative humidity.
These two equations have been used in the case of saturated vapor (H is
equal to 100) at different temperatures between 278 and 343 K and compared to experimental data from tables [8]. Results are presented in Figure 11. Experi-mental values obtained with ADSA method are close to data from tables between 278 and 333 K. A deviation of about 1 mN∙m−1 is observed at 343 K which can be due to the lack of surface tension measurements at high relative humidities at this specific temperature. The practical interest in working in a humid environ-ment is to decrease the surface tension of water and possibly avoid the use of organic surfactants when appropriate.
3.5. Pendant Drop Volume and Area during Drying
[image:14.595.59.542.686.737.2]Measurements of 8 µL pendant drops volume and surface exchange variations during drying were realized at temperatures from 303 K to 343 K. Relative humidity was set to 55%, which fits to a known value of a deionized water pendant drop surface tension for all tested temperatures. Pendant drops were hanging from a blunt needle tip which outer diameter was equal to 5.08 × 10⁻⁴ m. Results are presented in Figure 12. In order to illustrate the shape modification of the pendant drop during drying, three radii of curvature were considered (Figure 12(a)) referred as rleft, rright and rapex respectively taken at each side and at the apex of the pendant drop. The radii of curvature ratio, as defined on Figure 12(b), gets closer to 1 as the drying time increases. It means that the pendant drop get closer to a spherical shape. As expected, pendant drops dried faster as temperature gets higher (Figure 12(c)). The inset in Figure 12(c) shows that the drying time dramatically increases at the lowest temperatures. The dimensionless plot of the volume vs the drying time presented in Figure 12(d)
Table 1. Coefficients of the second order polynomial regression realized on the f(γ, H, T) plot. The equation is of the type γ = aH² +
bT² + cTH + dH + eT + f.
Coefficients a b c d e f Temperature range (K) Humidity range (%) Pérez-Díaz et al. study [13] 6.937 × 10⁻⁵ 4.005 × 10⁻³ 2.045 × 10⁻³ −6.580 × 10⁻¹ −2.626 5.035 × 10² [278; 293] [15; 100]
Figure 11. Comparison between surface tension values from tables and data obtained by polynomial regression at H = 100% (values: ♦ data from tables [8]; □data from Pérez-Diaz
et al. [13]; ○ present study).
[image:15.595.217.532.252.618.2]reveals that all curves follow the same trend. During the first minutes, the evaporation rate slightly decreases, as the drop was just created and is equi- librating with the environment. Then it increases and a second variation appears in the middle of the drying step, underlined by a change of curvature. The evaporation rate then decreases until the very last moments where the drop reaches the needle tip size and disappears in a few seconds. The change of curvature is attributed to the shape variations of the pendant drop revealed by the images in Figure 12(d). Indeed, it started as a bulb shape, where the drop volume is important and impacted by gravity, and progressively turned into a spherical shape where surface tension is predominant.
The curves of the outer shell of the pendant drops during drying do not present any change of curvature (Figure 12(e)). Initial surfaces are close to the surface of a perfect spherical drop of 8 µL, which is for information 19.34 mm2. These curves have a concave shape and as the volume (Figure 12(c)), the trend does not change as temperature gets higher (Figure 12(f)). Thus, temperature does not affect the behavior of pendant drops during drying but influences upon the kinetics. That is why two measurements were realized at a temperature of 323 K, at 35% and 75% relative humidity.
[image:16.595.179.536.397.654.2]Results are presented in Figure 13. The tendencies at the different relative humidities are similar. As expected the drying time dramatically increases with higher relative humidities. However, increasing the relative humidity up
to 75% RH not only doubles the drying time compared to a relative humidity of 35% but also smoothes the curves. Indeed, the change of curvature observed on volume in Figure 12 is less visible at high relative humidities, as presented in Figure 13(a) and Figure 13(b). This is a direct consequence of the concentration gradient of water molecules within the vapor phase nearby the surface of the pendant drop, as illustrated previously in Figure 8. As relative humidity increases, the number of water molecules in the vapor phase then increases and limits the migration of the water molecules within the liquid phase toward the drying air. Moreover, the water surface tension decreases (Figure 5). Exchange surface evolution presented in Figure 13(c) and Figure 13(d) do not differ from those presented on Figure 12(e) and Figure 12(f).
4. Conclusions
Using pendant drop method within a humid environment, values of deionized water surface tension as a function of relative humidity between 20% and 100% have been calculated for temperatures from 293 to 343 K. The pendant drop shape modifications are presented and phenomenological relations are proposed which allow an evaluation of surface tension in the 15% - 100% humidity and 278 - 343 K temperature ranges. Indeed, reporting the experimental data on a three dimensional representation where surface tension is plotted as a function of temperature and relative humidity revealed the dependence of the surface tension to both parameters. New results are in continuity with those of the literature [13], realized at lower temperatures.
The pendant drop volume was calculated, not only as a post measurement check to ensure that the surface tension data were accurate but also to bring new experimental findings. The pendant drop behavior had only been studied in the case where the drop was small enough to form a spherical cap [31]. Here, measurements of the pendant drop volume and surface exchange vs the drying time at temperatures from 303 K to 343 K and relative humidities from 35% to 75% reveal how the change of droplet shape is linked to the different evolutions. Drying time decreases when temperature increases and relative humidity decreases. Focus must be maintained on the fact that steam can be assimilated to a surfactant and must be specified in the experimental procedure. In the case of drying a porous material, increasing humidity should not only slow the eva- poration rate and increase the drying time but also lower the surface tension. Consequently, cracks formation could be reduced. Finally, we intend that the proposed study can provide new information for a predictive microscopic model close to real cases, such as a single water pendant drop or water within a porous material behavior subjected to different temperatures and relative humidities. The main objective is to give real meaning to realistic models whose parameters do not always have strict scientific values.
5. Research Interest and Future Work
behavior during drying, at different temperatures and relatives humidities. To our knowledge, such considerations were only discussed in the literature in the case where pendants drops were small enough to have the shape of a spherical cap [12] [31]. Indeed, volumes were less than 1 µL. When trying to provide an accurate representation of the fluid behavior at a mesoscopic scale, we noticed a lack of effective data that prevented us from proposing models as close as possible to reality at usual drying temperatures and relative humidities. Recently, modeling methods allowed realistic representation of fluids, whether in the case of modeling a liquid in contact with a substrate or just the liquid behavior [32] [33]. However, there is still no general approach to reproduce all the effects due to the interaction between the fluid and the air or the substrate. That is why these new insights could lead to more accurate models. The interest is also to have a better understanding of the fluid-substrate interface.
Acknowledgements
The authors thank Yoan Bertrand for contributing to the realization of the pen-dant drop test bench and data acquisition. The authors gratefully acknowledge the financial support provided by the Limousin region as part of the PhD of Etienne Portuguez.
References
[1] De Gennes, P.-G., Brochard-Wyart, F. and Quéré, D. (2004) Capillarity and Wetting Phenomena-Drops, Bubbles, Pearls, Waves. Springer-Verlag, New York.
https://doi.org/10.1007/978-0-387-21656-0
[2] Clift, R., Grace, J.R. and Weber, M.E. (1978) Bubbles, Drops, and Particles. Aca-demic Press, New York/London.
[3] Deegan, R.D., Bakajin, O., Dupont, T.F., Huber, G., Nagel, S.R. and Witten, T.A. (1997) Capillary Flow as the Cause of Ring Stains From Dried Liquid Drops. Na-ture, 389, 827-829. https://doi.org/10.1038/39827
[4] Eggers, J., Lister, J.R. and Stone, H.A. (1999) Coalescence of Liquid Drops. Journal of Fluid Mechanics, 401, 293-310. https://doi.org/10.1017/S002211209900662X
[5] Menchaca-Rocha, A., Martinez-Davalos, A. and Nunez, R. (2001) Coalescence of Liquid Drops by Surface Tension. Physical Review E, 63, Article ID: 046309.
https://doi.org/10.1103/PhysRevE.63.046309
[6] Scherer, G.W. (1990) Stress and Fracture during Drying of Gels. Journal of Non-
Crystalline Solids, 121, 104-109. https://doi.org/10.1016/0022-3093(90)90113-Z
[7] Scherer, G.W. (1990) Theory of Drying. Journal of the American Ceramic Society, 73, 3-14. https://doi.org/10.1111/j.1151-2916.1990.tb05082.x
[8] Vargaftik, N.B., Volkov, B.N. and Voljak, L.D. (1983) International Tables of the Surface-Tension of Water. Journal of Physical Chemistry Reference Data, 12, 817- 820. https://doi.org/10.1063/1.555688
[9] Adamson, A.W. and Gast. A.P. (1997) Physical Chemistry of Surfaces, 6th Edition, Wiley, New York. https://doi.org/10.1126/science.160.3824.179
[10] Bou-Zeid, W. and Brutin, D. (2014) Effect of Relative Humidity on the Spreading Dynamics of Sessile Drops of Blood. Colloids and Surfaces A, 456, 273-285.
[11] Acosta, E.J., Gitiafroz, R., Zuo, Y.Y., Policova, Z., Cox, P.N., Hair, M.L. and Neu-mann, A.W. (2007) Effect of Humidity on Lung Surfactant Films Subjected to Dy-namic Compression/Expansion Cycles. Respiratory Physiology & Neurobiology, 155, 255-267. https://doi.org/10.1016/j.resp.2006.06.009
[12] Erbil, H.Y. (2012) Evaporation of Pure Liquid Sessile and Spherical Suspended Drops: A Review. Advances in Colloid and Interface Science, 170, 67-86.
https://doi.org/10.1016/j.cis.2011.12.006
[13] Pérez-Díaz, J.L., Álvarez-Valenzuela, M.A. and García-Prada, J.C. (2012) The Effect of the Partial Pressure of Water Vapor on the Surface Tension of the Liquid Wa-ter-Air Interface. Journal of Colloid and Interface Science, 381, 180-182.
https://doi.org/10.1016/j.jcis.2012.05.034
[14] Stauffer, C.E. (1965) The Measurement of Surface Tension by the Pendant Drop Technique. The Journal of Physical Chemistry, 69, 1933-1938.
https://doi.org/10.1021/j100890a024
[15] Erbil, H.Y. (2006) Surface Chemistry of Solid and Liquid Interfaces. Blackwell Pub-lishing, Oxford.
[16] Drelich, J., Fang, C. and White, C. (2002) Measurement of Interfacial Tension in Fluid-Fluid Systems. In: Hubbard, A.T., Ed., Encyclopedia of Surface and Colloid Science, Marcel Dekker, Inc., New York, 3152-3166.
[17] Fang, G. and Ward, C.A. (1999) Temperature Measured Close to the Interface of an Evaporating Liquid. Physical Review E, 59, 417-428.
https://doi.org/10.1103/PhysRevE.59.417
[18] Ward, C.A. and Stanga, D. (2001) Interfacial Conditions during Evaporation or Condensation of Water. Physical Review E, 64, Article ID: 051509.
https://doi.org/10.1103/PhysRevE.64.051509
[19] McGaughey, A.J.H. and Ward, C.A. (2002) Temperature Discontinuity at the Sur-face of an Evaporating Droplet. Journal of Applied Physics, 91, 6406-6415.
https://doi.org/10.1063/1.1471363
[20] Rotenberg, Y., Boruvka, L. and Neumann, A. (1983) Determination of Surface Ten-sion and Contact Angle from the Shapes of Axisymmetric Fluid Interfaces. Journal of Colloid and Interface Science, 93, 169-183.
https://doi.org/10.1016/0021-9797(83)90396-X
[21] Kell, G.S. (1968) Density, Thermal Expansivity, and Compressibility of Liquid Wa-ter from 0 to 150˚C: Correlations and Tables for Atmospheric Pressure and Satura-tion Reviewed and Expressed on 1968 Temperature Scale. Journal of Chemical & Engineering Data, 20, 97-105. https://doi.org/10.1021/je60064a005
[22] Hartley, H.O. (1961) The Modified Gauss-Newton Method for the Fitting of Non-Linear Regression Functions by Least Squares. Technometrics, 3, 269-280.
https://doi.org/10.1080/00401706.1961.10489945
[23] Berry, J.D., Neeson, M.J., Dagastine, R.R., Chan, D.Y.C. and Tabor, R.F. (2015) Measurement of Surface and Interfacial Tension Using Pendant Drop Tensiometry.
Journal of Colloid and Interface Science, 454, 226-237.
https://doi.org/10.1016/j.jcis.2015.05.012
[24] Vazquez, G., Alvarez, E. and Navaza, J.M. (1995) Surface Tension of Alcohol + Wa-ter from 20 to 50 °C. Journal of Chemical & Engineering Data, 40, 611-614.
https://doi.org/10.1021/je00019a016
[25] Adamson, A.W. (1986) A Textbook of Physical Chemistry, 3rd Edition, Academic Press, Inc., Orlando.
https://doi.org/10.1002/andp.18862630309
[27] Palit, S.R. (1956) Thermodynamic Interpretation of the Eötvös Constant. Nature, 177, 1180. https://doi.org/10.1038/1771180a0
[28] Rosen, M.J. (2012) Surfactants and Interfacial Phenomena. 4th Edition, Wiley, Ho-boken. https://doi.org/10.1002/9781118228920
[29] Langmuir, I. (1918) The Adsorption of Gases on Plane Surfaces of Glass, Mica and Platinum. Journal of the American Chemical Society, 40, 1361-1403.
https://doi.org/10.1021/ja02242a004
[30] Chang, C.-H. and Franses, E.I. (1995) Adsorption Dynamics of Surfactants at the Air/Water Interface: A Critical Review of Mathematical Models, Data, and Me-chanisms. Colloids and Surfaces A Physicochemical and Engineering Aspects, 100, 1-45. https://doi.org/10.1016/0927-7757(94)03061-4
[31] Picknett, R. and Bexon, R. (1977) The Evaporation of Sessile or Pendant Drops in Still Air. Journal of Colloid and Interface Science, 61, 336-350.
https://doi.org/10.1016/0021-9797(77)90396-4
[32] Tartakovsky, A. and Meakin, P. (2005) Modeling of Surface Tension and Contact Angles with Smoothed Particle Hydrodynamics. Physical Review E, 72, Article ID: 206301. https://doi.org/10.1103/PhysRevE.72.026301
[33] Akinci, N., Akinci, G. and Teschner, M. (2013) Versatile Surface Tension and Ad-hesion for SPH Fluids. ACM Transactions on Graphics, 32, Article No. 182.
https://doi.org/10.1145/2508363.2508395
Submit or recommend next manuscript to SCIRP and we will provide best service for you:
Accepting pre-submission inquiries through Email, Facebook, LinkedIn, Twitter, etc. A wide selection of journals (inclusive of 9 subjects, more than 200 journals)
Providing 24-hour high-quality service User-friendly online submission system Fair and swift peer-review system
Efficient typesetting and proofreading procedure
Display of the result of downloads and visits, as well as the number of cited articles Maximum dissemination of your research work
Submit your manuscript at: http://papersubmission.scirp.org/