Mesocyclone Evolution and Differences between Isolated
and Embedded Supercells
Xiuguang Diao1*, Qian Shi1, Houfu Zhou2
1Shandong Provincial Meteorological Observatory, Jinan, China 2Anhui Institute of Meteorological Sciences, Hefei, China
Email: *[email protected]
Received April 11, 2013; revised May 15, 2013; accepted May 23, 2013
Copyright © 2013 Xiuguang Diao et al. This is an open access article distributed under the Creative Commons Attribution License, which permits unrestricted use, distribution, and reproduction in any medium, provided the original work is properly cited.
ABSTRACT
A total of 61 supercells with mesocyclones lasting for at least 6 volume scans were investigated. These storm parame- ters and mesocyclone parameters were counted and compared to determine the salient differences between isolated su- percells and embedded supercells in different regions. The results showed that the mesocyclone parameters had differ- ent evolution characteristics in three stages of mesocyclone. The storm parameters, mesocyclone parameters and severe weather phenomenon had significantly differences between isolated supercells and embedded supercells. The mesocyc- lone parameter differences determined the differences in the reflectivity structure and weather phenomenon. The higher base and top of mesocyclone for isolated supercells indicated that the isolated supercells had higher maximum reflecti- vity, maximum reflectivity height, cell-based vertically integrated liquid and top of storm cell, and significantly higher probability of hail or large hail than the embedded supercells. The descending lower base of mesocyclone at its mature stage in the region of Jianghuai Plain indicated that the supercells in this region had a higher probability of mesocyc- lone-induced tornado.
Keywords: Evolution; Differences; Mesocyclones; Isolated and Embedded Supercells
1. Introduction
A supercell thunderstorm, which was originally defined by Browning [1,2], is a thunderstorm that is character- ized by the presence of a mesocyclone. Supercell thun- derstorms are perhaps the most violent of all thunder- storm types, and are capable of producing damaging winds, large hail, weak-to-violent tornadoes, and flash flooding with severe economic losses [3-5]. The defini- tion of a mesocyclone was as given by Burgess [6] and included criteria on the shear value, the depth of the cir- culation, and its temporal continuity. A mesocyclone is a strong, rotating updraft found within a powerful thunder- storm. A typical mesocyclone is 2 to 6 miles across. A mesocyclone forms within a thunderstorm as a result of wind shear, or a change in wind speed and direction with altitude.
Since the advent of the WSR-88D Doppler radar, a suite of severe weather detection algorithms such as storm cell identification and tracking (SCIT) algorithm [7] and mesocyclone detection algorithm (MDA) [8,9], has had a positive impact on severe storm detecting and
severe weather forecasting. A full description of the build 9 WSR-88D mesocyclone algorithm(B9MA) process- ing was described by Tipton et al. The B9MA searches
for cyclonic azimuthal shear patterns (pattern vectors) in Doppler velocity data. Momentum and shear values are calculated for each pattern vector as follows:
Momentum= Vin Vout
Distance between Vin and Vout
, and
Shear= Vin Vout
Distance between Vin and Vout
where Vin and Vout are maximum base velocity values toward and away from the radar, respectively. Momen- tum and shear values are compared to the following adaptable parameters: threshold high momentum (540 km2·h−1) and low shear (7.2 h−1), threshold high shear (14.4 h-1) and low momentum (180 km2·h−1). Pattern vectors that pass momentum and shear tests are expected to be characteristic of mesocyclones. Two-dimensional features are formed when a minimum number of pattern vectors (adaptable parameter threshold pattern vector (TPV)) are in close proximity to each other. Two-dimen-
cyclone parameters were sought between different types of supercells and different regions.
2. Method
2.1. Radar Data Processing
To ensure radar product quality, WSR-98D data in Ar- chive Level II format were post-processed by using Unit Control Position (UCP) and unified algorithm adaptable parameters. The components of meteorological algorithm in UCP most relevant to this study were WSR-98D SCIT and B9MA. All the default algorithm adaptable parame- ter values completely from WSR-88D system have not been adjusted in WSR-98D. The SCIT algorithm can automatically identify and track up to 100 storms each volume scan, and display some storm parameters such as the maximum reflectivity (DBZM), the maximum reflec- tivity height (HT), the cell-based vertically integrated liquid (C-VIL) and the top of storm cell (TOP) in storm structure product. The mesocyclone product fed by B9- MA algorithm can automatically identify storm-scale vortices and display mesocyclone parameters such as the mesocyclone base (M-BASE), the mesocyclone top (M- TOP), the maximum shear of mesocyclones (M-SHEAR) and the maximum shear height (M-HT), and diameter of the core mesocyclone (DIAM).
2.2. Data Analysis Method
Storm parameters were analyzed and compared between different supercell types and different geographical area. All supercells in this study were divided into two catego- ries (type I and type II) based upon the radar reflectivity and two regions (region I and region II) based upon dif- ferent geographic regions. Type I (isolated supercells) was defined as being isolated from any quasi-linear re- gion of ≥40 dBZ reflectivity. Type II (embedded super- cells), was defined as a supercell storm embedded within a quasi-linear area of continuous reflectivity at the lowest volume scan ≥40 dBZ extending over a distance greater than 50 km [10]. The main research areas were plain areas included southern part of North China Plain (referred to as region I in this paper) and the region of Jianghuai Plain (referred to as region II in this paper). The WSR- 98D had lower height of radar antenna above sea level in plain areas, so can detect low-level vortices within the storm.
The storm parameters were averaged from one volume scan associated with the first mesocyclone symbol (yel- low solid circle)to the subsequent volume scan with the last mesocyclone symbol in one case, then averaged over all of the cases.
The mesocyclone parameters were averaged respec- tively in stage 1, stage 2 and stage 3 in one case, then averaged respectively in their three stages over all of the cases.
3. Samples and Examples
3.1. Supercell Samples
The set of 61 data cases, originated from 7 different radar sites (JINAN, SHIJIAZHUANG, TIANJIN, PUYANG, XUZHOU, HEFEI, NANJING) and associated with me- socyclones that lasted for at least 36 minutes (continuous six volume scans), were selected in this study from 2003 to 2012. The ranges of these storms were all 30 - 100 km from the radar sites, so the sample size and data quality were not much of a problem. 7 different radars mainly distributed in southern part of North China Plain and the region of Jianghuai Plain.
There were 32 isolated supercells and 29 embedded supercells among all the 61 supercells. 15/32 of isolated supercells and 13/29 of embedded supercells distributed in region I. 17/32 of isolated supercells and 16/29 of embedded supercells distributed in region II.
3.2. Examples
Below were two examples of parameter calculation and low-level reflectivity feature for isolated supercell and embedded supercell.
Figure 1 showed an isolated supercell in low-level ref-
supercell (a) 0 2 4 6 8 10 9: 53 10: 05 10: 17 10: 29 10: 42 10: 54 11: 06 11: 18
Time(GMT)
Hei g h t ( km ) second stage
first stage third
stage
[image:3.595.60.288.81.393.2](b)
[image:3.595.311.537.82.384.2]Figure 1. Low-level reflectivity (a) at 11:00 (GMT) and trend of mesocyclone (b) from 9:53 to 11:18 (GMT) on 26 August 2008, PUYANG radar.
Figure 2 showed an embedded supercell in low-level
reflectivity and the trend of mesocyclone. The supercell was embedded in linear convective systems, associated with mesocyclone from 10:30 to 11:13 (continuous 8 volume scans). The storm parameters were averaged from 10:30 to 11:13. The averaged values of DBZM, C-VIL, HT and TOP for this supercell were 48.9 dBZ, 15 kg·m−2, 4.6 km and 10.0 km respectively. The first stage of mesocyclone was 10:30 and 10:36 volume scan time, while the third stage was 11:06 and 11:13 volume scan time, and the other volume scan time was the second stage. The averaged values of M-BASE and M-TOP in the three stages were 1.7, 0.9, 1.4, and 5.1, 6.0, 3.9 km respectively.
The averaged values of M-BASE and M-TOP in the three stages were 3.2, 2.1, 2.2 and 5.9, 6.6, 5.5 km re- spectively for two mesocyclones above.
4. Results
4.1. Severe Reports
There were 54 documented severe weather reports for the 61 supercells. The severe reports consisted of 7 tornado reports, 43 hail reports, 32 large hail reports, 41 damag-
supercell (a) 0 1 2 3 4 5 6 7 8 10 :3 0 10 :3 6 10 :4 2 10 :4 8 10 :5 4 11 :0 0 11 :0 6 11 :1 3
Time(GM T)
He ig h t ( km ) third stage second stage first stage (b)
Figure 2. Low-level reflectivity (a) at 11:06 (GMT) and trend of mesocyclone (b) from 10:30 to 11:13 (GMT) on 30 July 2003, JINAN radar.
ing wind gusts(≥17.2 m·s−1) reports and 13 heavy pre- cipitation (≥50 mm·h−1 in this paper) reports. There were two embedded supercells in regions I, one isolated su- percell and four embedded supercells in regions II with no severe weather reports.
Detailed severe weather reports for isolated and embe- dded supercells in different regions are shown in Tables 1 and 2. The probability of producing tornado for super-
cells in regions II was significantly higher than that in regions I. The probability of hail and large hail occur- ring for isolated supercells was significantly higher than that for embedded supercells. The probability of gust occurring for embedded supercells was obviously higher than that for isolated supercells. The probability of heavy rain occurring for isolated supercells was higher than that for embedded supercells.
4.2. Storm Parameters
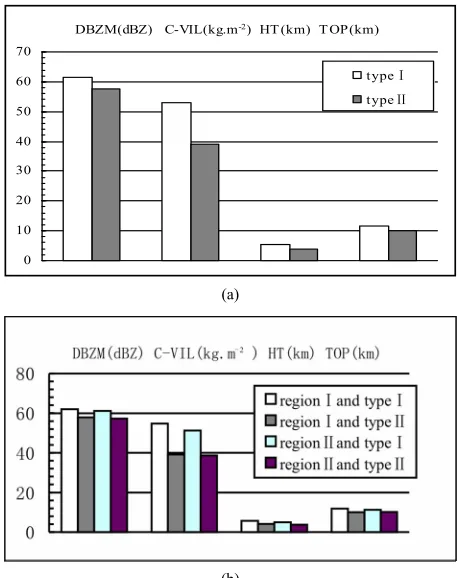
Figure 3 showed the storm parameters of supercells and
the differences of storm parameters for isolated super- cells and embedded supercells in different regions.
in Region I 0 100% 86.7% 60.0% 26.7% Probability
[image:4.595.308.537.83.372.2]in Region II 17.6% 76.5% 64.7% 58.9% 29.4%
Table 2. Severe weather reports for embedded supercells (Type II) in different regions.
Tornado Hail Large hail Gust Heavy rain
Reports
in Region I 0 8 5 10 2
Reports
in Region II 4 7 3 12 2
Probability in
Region I 0 61.5% 38.5% 76.9% 15.4% Probability in
Region II 25.0% 43.8% 18.9% 75.0% 12.5%
5.3 km, and 11.5 km respectively. The average values of DBZM, C-VIL, HT, and TOP for type II supercells were 58 dBZ, 39 kg·m−2, 3.9 km, and 10.1 km respectively.
The values of storm parameters were significantly higher for type I supercells compared to those for type II supercells in region I. The comparison of parameters between type I and type II supercells in region II was the same as that in region I.
The values of storm parameters were somewhat higher for type I supercells in region I compared to those in region II. The average values of storm parameters for type I supercells in region I were 62 dBZ, 54.7 kg·m−2, 5.7 km, and 11.8 km respectively. While those in region II were 61.2 dBZ, 51.2 kg·m−2, 4.9 km, and 11.2 km re- spectively. The values of storm parameters were some- what higher for type II supercells in region I compared to those in region II.
4.3. Mesocyclone Parameters and Evolution
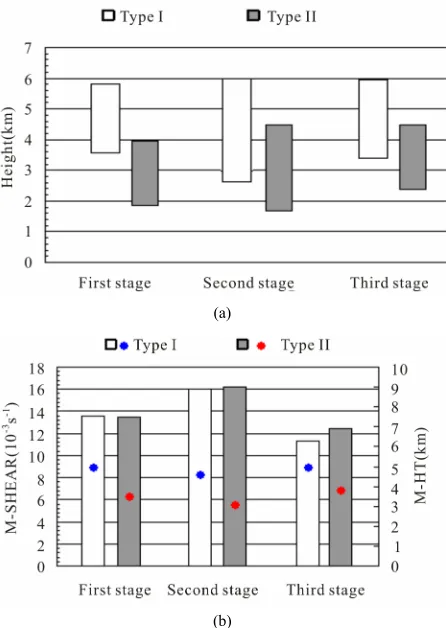
4.3.1. The Similarities and Differences between Type I Mesocyclone and Type II Mesocyclone Figure 4 showed the mesocyclone parameters and the
evolution trend during the three stages of mesocyclone for 32 isolated supercells and 29 embedded supercells. The mesocyclones of isolated supercells demonstrated the same evolution trend as the mesocyclones of embed- ded supercells. The mesocyclone formed in the middle and lower levels of an updraft. The M-BASE obviously
0 10
(a)
[image:4.595.57.287.112.223.2](b)
Figure 3. TypeⅠand type II supercell storm parameters (a), and storm parameters in region I and region II for type I and type II supercells (b).
descended, the M-TOP slightly elevated, the M-DEPTH (height of top minus height of base) and the M-SHEAR obviously increased in the second stage. The M-BASE obviously ascended, the M-TOP slightly descended, the M-DEPTH and the M-SHEAR obviously decreased in the third stage.
The values of M-BASE, M-TOP, M-DEPTH and M-HT for type I supercells were significantly greater th- an those for type II supercells, while the values of M-SHEAR had almost no differences between type I and type II supercells. The values of M-BASE, M-TOP, M-DEPTH, and M-HT were 2.6, 6.0, 3.4, and 4.6 km respectively for type I supercells in the second stage, while those were 1.7, 4.6, 2.9, and 3.0 km respectively for type II supercells.
[image:4.595.58.287.263.377.2](a)
[image:5.595.313.537.84.394.2](b)
Figure 4. The trend of the average top and base (a), maxi-mum shear ((b), histogram) and maximaxi-mum shear height ((b), blue and red punctate) during the three stages of mesocyc-lone for type I and type II supercells.
[image:5.595.61.284.85.399.2]4.3.2. The Similarities and Differences between Type I Mesocyclone and Type II Mesocyclone in Region I
Figure 5 showed the mesocyclone parameters and the
evolution trend during the three stages of mesocyclone for 15 isolated supercells and 17 embedded supercells in region I. The evolution trend of mesocyclones was the same as Figure 4. The values of M-BASE, M-TOP,
M-DEPTH, and M-HT were 2.8, 6.2, 3.3 ,and 4.5 km respectively for type I supercells in the second stage, while those were 1.8, 4.5, 2.7 ,and 3.3 km respectively for type II supercells.
4.3.3. The Similarities and Differences between Type I Mesocyclone and Type II Mesocyclone in Region II
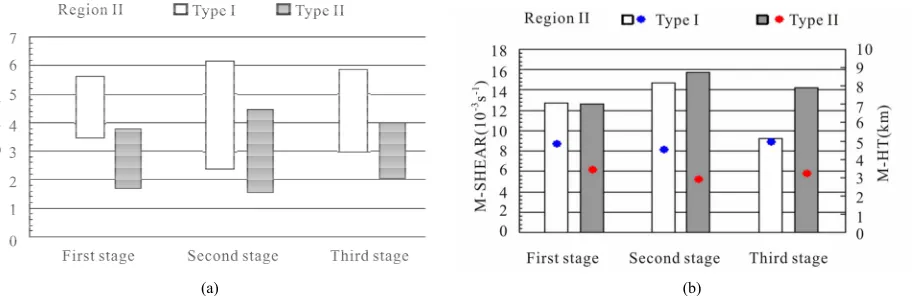
Figure 6 showed the mesocyclone parameters and the
evolution trend during the three stages of mesocyclone for 13 isolated and 16 embedded supercells. The evolu- tion trend of mesocyclones was the same as Fig.4. The values of M-BASE , M-TOP, M-DEPTH and M-HT were 2.4, 6.2, 3.9 and 4.6 km respectively for type I
su-(a)
(b)
Figure 5. The trend of the a age top and base (a),
maxi-.9 and 2maxi-.9 km respectively for type II supercells, al-
4.3.4. The Differences of Mesocyclones between
Comp rameters in regionI and
ercells, the average value of M-SHEAR in
4.4. Limitation
with default algorithm adaptable pa- ra
ver
mum shear ((b), histogram) and maximum shear height ((b), blue and red punctate) during three stages of mesocyclone for type I and type II supercells in region I.
2
though the value of M-SHEAR for type II supercells was higher than that for type I supercells in region II.
Region I and Region II
arisons of mesocyclone pa
region II (Figures 5 and 6) showed that the mesocyclone
base in region II was significantly lower than that in re-gion I. The M-BASE for type I and type II supercells in region II was 2.4 and 1.5 km,while in region I that was 2.8 and 1.8 km.
For type I sup
region II was obviously less than that in region I, es- pecially in the mature stage of mesocyclones. The M- SHEAR was 14.8 × 10⁻³ s−1 in region II while that was 17.3 × 10⁻³ s−1 in region I in the mature stage of meso- cyclones.
1) The B9MA
[image:6.595.76.532.87.235.2]
(a) (b)
Figure 6. The trend of the a ((b), blue
the fact that circulations do not require a depth of 3 km.
as not cal-cu
e average statistical charac- te
5. Conclusions
ers and severe weather phenomenon
rameters had different evolution ch
vated, the M-DEPTH and the M-SHEAR obviously in-
ells and embedded supercells determined the di
wledgements
the National Natural Sci- rant No. 41140036), and the
[1] K. A. Brow re of Convective
Storms,” The ine, Vol. 91, No.
s which Travel to the Right of
verage top and base (a), maximum shear ((b), histogram) and maximum shear height and red punctate) during three stages of mesocyclone for type I and type II supercells in region II.
This is the limitation of the B9MA but can show evolu- tionary characteristics of long-lived mesocyclones such as evolution of mesocyclone base and depth.
2) The parameter of mesocyclone strength w
lated and analysed in this paper. In the mid-1990s, the mesocyclone strength nomogram was used to evaluate manually measurements of observed rotational velocity and range in the United States. Nomogram strength thre- sholds were based on Oklahoma supercells. In 1995, the integrated rotational strength (IRS index), calculated by summing all 2D rotational strength indices from circula-tion base to top, was implemented and used. But IRS index has not been applied in WSR-98D. So, there is no parameter of mesocyclone strength in the digital B9MA product. The relationship between mesocyclone strength, storm strength and storm damage could be more complex and needs further research.
3) The results displayed th
ristics of long-lived mesocyclones, some cases with short-lived mesocyclones may not have similar evolu- tionary characteristics.
The storm paramet
had significantly differences between isolated supercells and embedded supercells. The isolated supercell storm parameters such as DBZM, HT, C-VIL, and TOP, were significantly higher than the embedded supercell storm parameters. Isolated supercells had significantly higher probability of hail, large hail and heavy rains, but lower probability of gust than embedded supercells. There was a higher probability of tornado occurrence in the region of Jianghuai Plain.
The mesocyclone pa
the
aracteristics in the three stages. The mesocyclone formed in the middle and lower levels of an updraft. The M-BASE obviously descended, the M-TOP slightly ele-
creased in the mature stage. The M-BASE obviously ascended, the M-TOP slightly descended, the M-DEPTH and the M-SHEAR obviously decreased in the dissipat- ing stage.
The mesocyclone parameter differences between isola- ted superc
fferences in the reflectivity structure and weather phe- nomenon. The higher values of M-BASE and M-TOP for isolated supercells indicated that the strong rotating up- draft can reach a higher height inside a supercell storm, favorable for the evolution, strength, and longevity of the isolated supercells and for the overhang of high reflecti- vity core and the growth of large hail. So the isolated su- percells had significantly higher probability of hail or large hail.
6. Ackno
This work was supported by ence Foundation of China (G
Scientific and Technological Development Projects of Shandong Province (Grant No. 2010GSF10805).
REFERENCES
ning, “Cellular Structu Meteorological Magaz 1085, 1962, pp. 341-350.
[2] K. A. Browning, “Airflow and Precipitation Trajectories within Severe Local Storm
Winds,” Journal of the Atmospheric Sciences, Vol. 21, No. 6, 1964, pp. 634-639.
doi:10.1175/1520-0469(1964)021<0634:AAPTWS>2.0.C O;2
doi:10.1175/1520-0493(1998)126<0831:HDOFTG>2.0.C O;2
[4] E. J. Calianese, J. K. Jordan, E. B. Curran, A. R. Moller and G. Woodall, “The Mayfest High-Precipitation Super-cell of 5 May 1995—A Case Study,” The 21st
Confer-Sinica, Vol. 25, No. 2, 2011, pp. 211-ence on Severe Local Storms, San Antonio, 12-16 August 2002, pp. 105-108.
[5] X. G. Diao, J. J. Zhu and Z. H. Liu, “Analysis of Three Supercell Storms with Doppler Weather Radar Data,” Acta Meteorologica
223. doi:10.1007/s13351-011-0028-5
[6] D. W. Burgess, “Single Doppler Radar Vortex Recogni-tion: Part I—Mesocyclone Signatures,” The 17th Confer-ence on Radar Meteorology, Seattle, 26-29 October 1976,
fication and Tracking (SCIT) Al-pp. 97-103.
[7] J. T. Johnson, P. L. MacKeen, A. Witt, E. De Wayne Mitchell, G. J. Stumpf, M. D. Eilts and K. W. Thomas, “The Storm Cell Identi
gorithm: An enhanced WSR-88D Algorithm,” Weather and Forecasting, Vol. 13, No. 2, 1998, pp. 263-276.
doi:10.1175/1520-0434(1998)013<0263:TSCIAT>2.0.C
O;2
[8] G. J. Stumpf, A. Witt, E. D. Mitchell, P. L. Spencer, J. T.
4(1998)013<0304:TNSSLM>2.0.C Johnson, M. D. Eilts, et al., “The National Severe Storms Laboratory Mesocyclone Detection Algorithm for the WSR-88D,” Weather and Forecasting, Vol. 13, No. 2, 1998, pp. 304-326.
doi:10.1175/1520-043 O;2
[9] G. A. Tipton, E. D. Howieson, J. A. Margraf and R. R.
20-0434(1998)013<0367:OTWMTV>2.0. Lee, “Optimizing the WSR-88D Mesocyclone/Tornadic Vortex Signature Algorithm Using WATADS—A Case Study,” Weather and Forecasting, Vol. 13, No. 2,1998, pp. 367-376.
doi:10.1175/15 CO;2