ERAWATCH country reports 2010:
Hungary
Havas, Attila
Institute of Economics, CERS, HAS, IQ-TANOK bt
2011
ERAWATCH COUNTRY
REPORTS 2010:
Hungary
ERAWATCH Network – IQTANOK bt
Acknowledgements and further information:
This analytical country report is one of a series of annual ERAWATCH reports which are produced for EU Member and Countries Associated to the EU Seventh Research Framework Programme (FP7). ERAWATCH is a joint initiative of the European Commission's Directorate General for Research and Innovation and Joint Research Centre.
The analytical framework and the structure of the reports have been developed by the Institute for Prospective Technological Studies of the Joint Research Centre (JRCIPTS) with contributions from Directorate General for Research and Innovation and the ERAWATCH Network. The report has been produced by the ERAWATCH Network in the framework of the specific contract on ERAWATCH Research Inventory and Analytical Country Reports 2010 and 2011 commissioned by JRC IPTS.
In particular, it has benefited from comments and suggestions of Slavo Radosevic, who reviewed the draft report. The contributions and comments of Mariana Chioncel from JRCIPTS and DGRTD are also gratefully acknowledged.
The report is only published in electronic format and available on the ERAWATCH website. Comments on this report are welcome and should be addressed to jrcipts erawatchhelpdesk@ec.europa.eu.
Executive Summary
Hungary, with its population of 10 million (2% of the EU27 total) is a mediumsized EU Member State. Its GDP was 1.26% of the EU27 total in 2009. As for economic development, measured by GDP per capita (in PPS), the country ranked 2122 in the EU27 in 2009 (with Estonia), with 62.7% of the EU27 average.
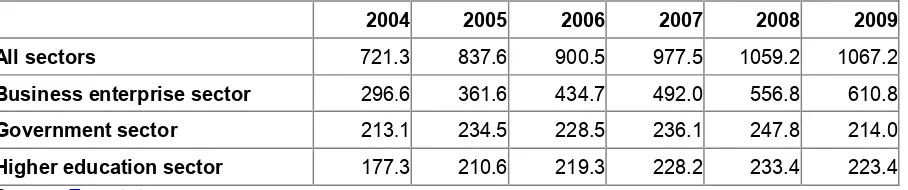
The Hungarian GERD (€1,067.2m) was 0.45% of the EU27 total in 2009. It increased from €721.3m in 2004 in every single year, particularly fast in 2005 (16.1%), then by 78% a year in 20062008, and by 0.8% in 2009. (Eurostat data, and author’s calculation) The share of businesses in financing GERD grew from 37.1% in 2004 to 46.4% in 2009, while that of public funds decreased from 51.8% to 42.0% (2004 2009). The share of FTE researchers in total employment increased from 0.39% in 2004 to 0.53% in 2009, while that of all FTE R&D employees from 0.59% to 0.79% (20042009).
The GERD/GDP ratio was stagnating around 0.91% in 20012008, and increased to 1.15% in 2009 (KSH). This rise is a combined effect of two factors: (i) given the global financial and economic crisis, the Hungarian GDP shrank by 6.7% (preliminary data, KSH), while (ii) GERD continued to rise in nominal terms. In spite of this, the Hungarian GERD/GDP trails the EU27 average (2% in 2009), and has been well below the Lisbon target (3%).
In order to keep the budget deficit at the target level of 3.8%, the new government decided to cut several types of expenditures in June 2010 in a way that would not harm directly the population. As a part of this broader measure, HUF16b (~€58.2m) was blocked from the Research and Technological Innovation Fund (that is, 36.6%). The Hungarian BERD has been increasing since 2004 both in nominal terms (from €296.5 to €610.8m) and as a percentage of GERD (from 41.1% to 57.2%), even in 2009. Yet, the BERD is still below the EU27 average (63.9% of GERD; 2008)
It seems unlikely that the R&D investment targets (GERD at 1.8% of GDP, while BERD at 0.9% of that by 2013) can be achieved simply by providing more public funding. The impact of STI policies aimed at leveraging R&D investments can only be enhanced if framework conditions are also significantly improved. Notably, the macroeconomic situation, the ‘twotier’ structure of the economy, the intensity and type of competition, the overall entrepreneurship culture, the quality and directions of projects conducted by the publicly financed R&D units have unfavourable impacts on RTDI activities of firms. The incentives provided by the STI policy schemes cannot counterbalance those effects. Structural reasons, which are difficult to address even by overall economic policies, let alone STI policies, can also be seen as obstacles. The bulk of BERD is performed by foreignowned firms, and their RTDI activities are largely determined by their parents’ strategies, while domestic STI policies can play a relatively minor role.
Knowledge Triangle
investment promotion and regional development policies – could not possibly be designed and implemented in a strategic, coherent and integrated framework. The implementing agencies are also frequently reorganised. These permanent changes in governance structures prevent organisational learning of policy design and implementation bodies, and this lack of stability also hampers the efficient functioning of these bodies.
No major changes have occurred in the national STI policy mix since 2009. The 84 page government programme, approved in May 2010, devotes 8 lines to R&D and innovation. A new technology and innovation policy document, underpinning the policy measures to be launched in 2011, would be finalised in January 2011.
Effectiveness of knowledge triangle policies
Recent policy changes Assessment of strengths and weaknesses
Research policy · The Law on Higher Education was amended in December 2008 to facilitate a more entrepreneurial approach
· The Law on the Hungarian Academy of Sciences (MTA) was amended in April 2009 to increase the financial autonomy of the MTA
· High quality of research in a number of scientific fields
· Research is not an attractive career, brain drain is a severe threat · Mismatch between the incentives of
academic researchers and the interests of businesses
Innovation policy · Withholding HUF16b (~€58.2m) from the Research and
Technological Innovation Fund; June 2010
· Significant funds allocated to RTDI in multiyear programming documents · Innovation performance is poor in
international comparison Education policy · Higher quota of publicly financed
students enrolled at S&E faculties · Schemes aim at raising the level of
qualified human resources
· Internationally respected S&E education system in several fields
· The level of qualified human resources for an enlarged research system would be inadequate
Other policies · No major changes in those policy domains, which affect RTDI performance
· STI policy measures cannot
counterbalance unfavourable framework conditions for business RTDI activities
European Research Area
The European Research Area does not feature prominently in Hungarian STI policy documents. It is only mentioned in the government’s midterm STI policy strategy in a footnote, when referring to important EU policy documents. ERA is mentioned in the National Lisbon Action Plan (200810) in connection with the National Research Infrastructure Survey and Roadmap project, joint programming, mobility schemes and international cooperation.
Assessment of the national policies/ measures supporting the strategic ERA objectives (derived from ERA 2020 Vision)
ERA objectives Main national policy
changes Assessment of strengths and weaknesses 1 Ensure an adequate supply of human resources for research and an open, attractive and competitive single European labour market for male and female researchers
· Higher quota of publicly financed students enrolled at S&E faculties
· Simplified visa procedures for foreign researchers introduced in December 2007
· Full compliance with the 1408/71 regulation concerning social security policies · The share of S&E graduates is less than half of the EU average · Small difference between male and female researchers’ salary · The same position after maternity leave is safeguarded · Several mobility schemes for Hungarian researchers, with scarce funding, though · Research positions at PROs are open to nonnationals, yet the share of foreign researchers is 2% in the total number of researchers 2 Increase public support
for research · Public funding for R&D increased from €373.7m (0.45% of GDP) in 2004 to €448.0m (0.48% of GDP) in 2009
· HUF16b (~€58.2m) “blocked” from the Research and Technological Innovation Fund · Low level of public R&D expenditures, around three quarters of the EU27 average (0.65% of the GDP in 2008) 3 Increase European co ordination and integration of research funding
· Hungarian participation in 46 ERANet projects (as of 2010), and several Joint Technology Initiatives (JTIs) · Given the size of the Hungarian economy and the level of public funding for R&D, Hungary cannot be a major player in these initiatives 4 Enhance research
capacity across Europe · Measures to create R&D jobs in the business sector, and make HEIs and PROs more attractive · The number of FTE researchers increased from 17,391 (2007) to 20,064 (2009), in spite of the crisis 5 Develop worldclass research infrastructures (including e infrastructures) and ensure access to them
· Measures to modernise RI are in place for a long time · A strategybuilding process
to underpin RI policies launched in 2008
· Participation in devising the ESFRI Roadmap, commitment to host one of the ELI sites · A few large RIs, all open to foreign researchers · An uneven technical level of RIs: a mix of uptodate and outdated facilities · Lack of a comprehensive RI investment strategy; suboptimal use of public funds 6 Strengthen research organisations, including notably universities
ERA objectives Main national policy
changes Assessment of strengths and weaknesses 7 Improve framework
conditions for private investment in R&D
· Tax incentives for private
R&D investment for long time · Volatile macroeconomic environment for businesses · High interest rates and crowding out effect of the fiscal deficit · Market conditions are not conducive to RTDI activities 8 Promote publicprivate cooperation and knowledge transfer
· Several STI policy measures foster industryacademia collaboration · Some improvement in the intensity of industryacademia collaboration 9 Enhance knowledge circulation across Europe and beyond
· Various schemes promoting Hungarian participation in EU FP and EUREKA projects are in place for a long time · Hungarian STI support schemes are open to nonnationals, but funding is limited for them 10 Strengthen international cooperation in science and technology and the role and attractiveness of European research in the world
· Bilateral STI cooperation agreements with 37
countries (on four continents) · Participation in multilateral
STI cooperation agreements and organisations · Active participation in FP, EUREKA, and COST projects 11 Jointly design and coordinate policies across policy levels and policy areas, notably within the knowledge triangle
· The Research and Science Policy Council, set up after a long ‘interval’ in September 2009, was dissolved on 15 December 2010
· Decision on 15 Dec 2010 to establish the National Research, Innovation and Science Policy Council · The Government’s midterm
STI policy strategy calls for evidencebased policy making practices · STI policy governance structures have been frequently reorganised · The highest level coordination body has worked intermittently · Policies affecting RTDI processes could not possibly be designed and implemented in an integrated framework · An S&T Observatory should have been set up originally by June 2008, then by the end of 2010, but it is not working yet 12 Develop and sustain excellence and overall quality of European research
· Measures to improve conditions required for excellence are in place for several years · High quality of research in a number of S&T fields in international comparison 13 Promote structural change and specialisation towards a more knowledgeintensive economy
· No structural policies, strictly defined
· Key technologies and related industries are identified in the New Hungary Development Plan and the Government’s midterm STI policy strategy · Strong performance in high and mediumhightech EIS indicators · The difference between statistical classification of sectors and the actual knowledgeintensity of activities performed in Hungary is not taken into account when devising policy measures 14 Mobilise research to address major societal challenges and contribute to sustainable development
· Most Hungarian STI policy schemes had been devised prior to the identification of the grand societal challenges in various EU policy documents · Enhancing competitiveness is a major objective of several STI policy schemes · Various other societal challenges are also addressed 15 Build mutual trust between science and society and strengthen scientific evidence for policymaking
· No specific measure to build mutual trust between science and society
TABLE OF CONTENTS
Executive Summary... 3
1 Introduction... 9
2 Performance of the national research and innovation system and assessment of recent policy changes... 9
2.1 Structure of the national innovation system and its governance ... 9
2.2 Resource mobilisation... 12
2.2.1 Resource provision for research activities... 13
2.2.2 Evolution of national policy mix geared towards the national R&D investment targets... 16
2.2.3 Providing qualified human resources ... 19
2.3 Knowledge demand ... 21
2.4 Knowledge production... 24
2.4.1 Quality and excellence of knowledge production ... 24
2.4.2 Policy aiming at improving the quality and excellence of knowledge production ... 26
2.5 Knowledge circulation ... 26
2.5.1 Knowledge circulation between the universities, PROs and business sectors ... 27
2.5.2 Crossborder knowledge circulation... 28
2.5.3 Main societal challenges ... 29
2.6 Overall assessment... 29
3 Interactions between national policies and the European Research Area... 32
3.1 Towards a European labour market for researchers ... 32
3.1.1 Stocks and mobility flows of researchers ... 33
3.1.2 Providing attractive employment and working conditions... 33
3.1.3 Open recruitment and portability of grants ... 35
3.1.4 Meeting the social security and supplementary pension needs of mobile researchers... 35
3.1.5 Enhancing the training, skills and experience of European researchers ... 35
3.2 Research infrastructures ... 36
3.2.1 National Research Infrastructures roadmap... 36
3.2.2 National participation in the ESFRI roadmap: Updates 20092010... 38
3.3 Strengthening research organisations... 38
3.3.1 Quality of the National Higher Education System... 39
3.3.2 Academic autonomy... 41
3.3.3 Academic funding... 42
3.4 Knowledge transfer ... 43
3.4.1 Intellectual Property Policies ... 43
3.5 Cooperation, coordination and opening up national research
programmes within ERA... 45
3.5.1 National participation in intergovernmental organisations and schemes... 45
3.5.2 Bi and multilateral agreements with other ERA countries ... 46
3.5.3 Other instruments of cooperation and coordination between national R&D programmes ... 47
3.5.4 Opening up of national R&D programmes... 47
3.6 International science and technology cooperation ... 47
3.6.1 International cooperation... 48
3.6.2 Mobility schemes for researchers from third countries ... 48
4 Conclusions... 48
4.1 Effectiveness of the knowledge triangle ... 48
4.2 ERA 2020 objectives a summary ... 50
References ... 53
1 Introduction
The main objective of the ERAWATCH Analytical Country Reports 2010 is to characterise and assess the evolution of the national policy mixes in the perspective of the Lisbon goals and of the 2020, postLisbon Strategy. The assessment will focus on the national R&D investments targets, the efficiency and effectiveness of national policies and investments into R&D, the articulation between research, education and innovation, and on the realisation and better governance of ERA. In doing this, the 15 objectives of the ERA 2020 are articulated.
The report builds on the 2009 report streamlining the structure and updating the 2009 policy assessment in the domains of human resource mobilisation, knowledge demand, knowledge production and scienceindustry knowledge circulation. The information related to the four ERA pillars covered in the 2009 report is also updated and it is extended in order to cover all six ERA pillars and address the corresponding objectives derived from ERA 2020 Vision.
Given the latest developments, the 2010 Country Report has a stronger focus on the link between research and innovation, reflecting the increased focus of innovation in the policy agenda. The report is not aimed to cover innovation per se, but rather the 'interlinkage' between research and innovation, in terms of their wider governance and policy mix.
2 Performance of the national research and
innovation system and assessment of recent
policy changes
The aim of this chapter is to assess the performance of the national research system, the 'interlinkages' between research and innovation systems, in terms of their wider governance and policy and the changes that have occurred in 2009 and 2010 in national policy mixes in the perspective of the Lisbon goals. The analysis builds upon elements in the ERAWATCH Country Report 2009, by updating and extending the 2009 policy assessment in the domains of resource mobilisation, knowledge demand, knowledge production and scienceindustry knowledge circulation. Each section identifies the main societal challenges addressed by the national research and innovation system and assesses the policy measures that address these challenges. The relevant objectives derived from ERA 2020 Vision are articulated in the assessment.
2.1 Structure of the national innovation system and its
governance
This section presents the main characteristics of the governance structure of the Hungarian national innovation system.
capita (in PPS), the country ranked 2122 in the EU27 in 2009 (with Estonia), with 62.7% of the EU27 average.
The Hungarian GERD (€1,067.2m) was 0.45% of the EU27 total in 2009. (Eurostat data, and author’s calculation) The share of FTE researchers in total employment increased from 0.39% in 2004 to 0.53% in 2009, while the share of all FTE R&D employees from 0.59% to 0.79% in the same period. The GERD/GDP ratio was stagnating around 0.91% in 20012008, and increased to 1.15% in 2009 (KSH), that is, well below the EU27 average (2.01% in 2008) and the Lisbon target (3%).
Main actors in STI policy governance
The science, technology and innovation (STI) policy governance structure has been in an almost permanent state of flux since the 1990s, including the highest level policymaking bodies, as well as the implementing agencies. These frequent changes in governance structures prevent organisational learning of policy design and implementation bodies, and this lack of stability also hampers their efficient functioning. Moreover, these frequent changes put a significant administrative burden on research performers. (ÁSz, 2008a, 2008b; Ernst & Young and GKI, 2010b; OECD, 2008)
Just to illustrate, two fundamental changes have occurred since May 2008, when a major government reshuffle took place, affecting the STI policymaking structures, too. A new position was created at that time: a minister without portfolio was appointed, responsible for “overseeing and coordinating R&D, technological innovation, and science policies”. Furthermore, the STI policy action plan for 2007 2010 (approved by the government on 29 August 2007) stipulated that the STI governance system should be overhauled. Some elements of this plan were introduced by a government decree, approved on 28 March 2009. The prime minister, however, resigned in April 2009, and these organisational changes had not been implemented, except for one: the highestlevel coordination body in the field of STI policy – called Science and Technology Policy Council (TTPK), headed by the prime minister – was abolished. The second fundamental change occurred in April 2009, when a new government was formed (supported by the same political party as in the case of the previous government), and the position of the minister without portfolio, responsible for coordinating R&D, technological innovation and science policies was dissolved.
Following the general elections held in April 2010, a new government took office on 29 May 2010, and thus further changes are still expected until all the major STI policy bodies are reorganised. The current situation (as of December 2010) can be summarised as follows. 1 The Education, Science, and Research Committee, together
with the Economic and Informatics Committee of the Parliament are the highestlevel political bodies in the field of STI policy.
A new highlevel STI policy coordination body had been created by a government decree in September 2009, called Research and Science Policy Council (to replace the dissolved Science and Technology Policy Council), with somewhat revised responsibilities. It had held its first and only meeting on 17 February 2010, chaired by the prime minister. It was disbanded on 15 December 2010 by a government decree stipulating the creation of the National Research, Innovation, and Science Policy
Council. It is chaired by the deputy prime minister, cochaired by the president of the Hungarian Academy of Sciences, and composed of three ministers (see below). The ministries with responsibilities for various domains and tasks of STI policies are the Ministry for National Economy (its minister also supervises the National Office for Research and Technology [NKTH]), the Ministry of National Development (its minister oversees the Research and Technological Innovation Fund [KTIA], the main national source for funding R&D and innovation policy schemes, as well as the National Development Agency, managing the measures cofinanced by the EU Structural Funds), and the Ministry of National Resources (supervising all levels of education, including higher education, and coordinating science policy).
[image:12.595.76.525.339.575.2]The Research and Technological Innovation Council (KuTIT) provides strategic guidance to the National Office for Research and Technology (NKTH). It is a 15 strong body, with 6 members delegated by the relevant ministries (mostly state secretaries), 6 by various business associations and 3 other representatives of the RTDI community.
Figure 1: Overview of the Hungarian STI policy governance structure (as of December 2010)
Source: compiled by the author. Note: The institutes of Hungarian Academy of Sciences conduct research, and hence the dual role of HAS is indicated by a combination of colours in the figure.
At the operational level, the National Office for Research and Technology (NKTH) devises R&D and innovation policy schemes, manages international R&D co operation in bilateral and multilateral relations and supervises the network of Hungarian science and technology attaches. In brief, NKTH submits its strategic proposals to KuTIT, and implements the Council’s decisions. STI policy observers – given the practice followed since 2004 – expect yet another major reorganisation of the NKTH in the coming months, for the third time since 2007, leading also to new STI policy schemes. 2
The measures cofinanced by the EU Structural Funds are managed by the National Development Agency.
The role of regions in STI policy governance
Hungary is a unitary and centralised country, where regions do not play a significant role in STI policymaking. The Regional Development Agencies and the Regional Innovation Agencies influence RTDI processes by devising regional innovation strategies, as well as administering calls funded by the Research and Technological Innovation Fund 3 and the Regional Operational Programmes.
Main research performers
The business sector has long been the largest research performer: it accounted for 57.2% of the Hungarian GERD in 2009 (up from 40.1% in 2001). 4 It also became the
largest employer of researchers in 2006, and its share in fulltimeequivalent (FTE) scientists and engineers reached 44.7% in 2009. Large, foreign owned firms, operating in a few sectors, account for the bulk of BERD (66.6%, 59.2%, and 58.2% in 2007, 2008, and 2009, respectively).
The government sector’s share in performing R&D is significant: 20.1% of GERD, while its weight in employment is even larger: 24.6% of total FTE researchers. The most important player in this sector is the Hungarian Academy of Sciences (MTA) with its extensive network of research institutes, and hence its substantial weight in the Hungarian research system. The MTA is a legal entity, a public body having self governing rights, with high degree of autonomy in scientific and financial respects. Its main tasks are to develop, promote, and represent science. It also gives its expert opinion to the Parliament or the Government, and can influence STI policies.
The largest number of research units is operated in the higher education sector, but the average size of these units is rather small (4.4 FTE researchers). HERD as a percentage of GERD was 20.9% in 2009.
Private nonprofit research institutes perform a tiny part of GERD (and thus not regarded as a separate “research performing sector” in Hungarian statistics).
2.2 Resource mobilisation
Since 2000, Europe has made evident progress towards ERA but at the same time it is clear that Europe's overall position in research has not improved, especially regarding R&D intensity, which remains too low. The lower R&D spending in the EU is mainly a result of lower levels of private investment. Europe needs to focus on the impact and composition of research spending and to improve the conditions for private sector R&D investments.
This section assesses the progress towards national R&D targets, with particular focus on private R&D and of recent policy measures and governance changes and the status of key existing measures, taking into account recent government budget data. The need for adequate human resources for R&D has been identified as a key challenge since the launch of the Lisbon Strategy in 2000. Hence, the assessment includes also the human resources for R&D. The main assessment criteria are the
3 It is stipulated that 25% of the Research and Technological Innovation Fund should be used to finance schemes fostering regional RTDI activities.
degree of compliance with national targets and the coherence of policy objectives and policy instruments.
2.2.1 Resource provision for research activities
This section briefly describes public research funding and the various funding modes and mechanisms prevalent in Hungary.
Progress towards R&D investment targets
The Government’s midterm STI policy strategy (20072013) stipulates that GERD should increase to 1.8% of the GDP by 2013 (up from 1.0% in 2006), while BERD should reach 0.9% of the GDP (from 0.45% in 2006). These goals seem to be overly optimistic: independent analysts had expressed serious doubts concerning the feasibility of these targets even before the global financial crisis. (OECD, 2008) Data have confirmed these doubts: the Hungarian GERD/GDP ratio remained at 1% in 20072008, and only grew in 2009, reaching 1.15%. (KSH) This increase is a combined effect of two factors: (i) given the global financial and economic crisis, the Hungarian GDP shrank by 6.7% (preliminary data, KSH), while (ii) GERD continued to rise in nominal terms (by 12.3% at current prices, in HUF). In spite of this, the Hungarian GERD/GDP trails the EU27 average (2.01% in 2009).
Provisions for R&D activities
The above, multiannual strategy document defines six priorities:
· “Expansion of companies’ research and development activities;
· Establishment of internationally recognized research & development, innovation
centres and research universities;
· Enhancing of the regions’ research & development & innovation (R&D&I)
capacity;
· Establishing a knowledge market which works on the principles of performance
recognition and competition through the globalization of knowledge production and dissemination;
· Investment in large scientific facilities, primarily in the regional centres and the
development poles, reducing regional differences (regional cohesion);
· The dynamic increase in yearly R&D expenditure, above all as a result of growth
in corporate expenditure.” (Government, 2007, p. 3)
The strategy document itself does not present SWOT analyses either at national or regional level. As already mentioned, major policymaking bodies have been frequently reorganised and several changes occurred in key positions in a short period, and thus no strategy document could possibly provide a predictable policy framework.
Public funding for research is allocated via the Research and Technological Innovation Fund; the Operational Programmes of the New Hungary Development Plan (these two funds provide support for innovation activities, too, besides R&D); the Hungarian Scientific Research Fund (OTKA); and other, minor schemes (financed by international sources).
from the central budget (that is, the share of these two sources should be 5050). This rule was not followed in 2010, however: the Act on the budget stipulated that ~€74m (HUF20b) could be the maximum contribution from public sources. 5
The vast majority of these funds are distributed on a competitive basis, but HEIs and PROs receive institutional funding, too. As for HEIs, however, there are no publicly available data to establish how much of the total HERD 6 is financed in this way.
Further, the use of normative support for research at universities is not monitored closely, i.e. education activities or general costs, such as heating and lighting, might also be financed by these sources. Besides normative public support for research, HEIs also apply for grants offered by national or foreign funding organisations.
As for the Hungarian Academy of Sciences (MTA), in the 2010 Budget Law it was allocated some €135.4m (HUF36.6b), that is, 2% less in nominal terms than in 2009. The amount provided by the central budget is complemented by the MTA’s (and its institutes’) own revenues, the volume of which is planned to be ~€43.8m (HUF11.8b) in 2010. Data on public support for other PROs are not publicly available, but that amount is negligible compared to the support received by the MTA.
Competitive (especially “bottomup”) funding for basic research is small. Several studies, however, have argued that a noteworthy share of competitive grants intended for applicationoriented research – obtained by PROs and universities – is in essence financing basic research. (Arnold et al., 2007; OECD, 2008)
No comprehensive analysis is publicly available to establish if an adequate balance between institutional and projectbased funding of research is provided.
The Operational Programmes (OPs) of the New Hungary Development Plan are a key source for financing RTDI in the period 200713. The budget of the most important Economic Development Operational Programme (EDOP), Priority 1, “R&D and innovation for competitiveness”, is €990m. 7 To compare, its yearly allocations
(on average) roughly correspond to the funds available from the Research and Technological Innovation Fund. Within the RTDI priority of the EDOP, primarily aimed at boosting marketoriented RTDI activities of firms, the following objectives have been set:
· promoting the demand for R&D results;
· developing R&D supply by providing the necessary human resources and
infrastructure;
· increasing the effectiveness of the research and innovation market (p. 51) by
developing a network of bridging organisations, technology parks and incubators as well as technology transfer offices;
· achieving a more effective utilisation of research results through enhanced co
operation between different domestic and foreign actors;
· improving the access to financial resources.
The Social Infrastructure OP (SIOP) also contains measures relevant for research, e.g. for upgrading research infrastructure at higher education institutes (HEIs).
5 Moreover, HUF16b (~€58.2m) was “blocked” from the 2010 budget of the Research and Technological Innovation Fund by the government in June 2010, see below in this section.
Though the EDOP also supports research infrastructures, the focus of that OP are projects carried out by firms, whereas the SIOP is dedicated exclusively to HEIs. In total, €310m is earmarked for these purposes in 20072013.
The Social Renewal OP’s 4th Priority Axis (“Developing the content and organisation of higher education to create a knowledgebased economy”) partly supports the “Expansion of the capacities of R&D&I&E [Research and development, innovation and education] of tertiary education, thus supporting the enhancement of institutional cooperation with businesses”. This amounts to €507m in 20072013, mainly with the objective of establishing “the HR and organisational conditions necessary for the enlargement of higher education’s Research & Development capacities in the interest of institutional cooperation with businesses.” (p. 144)
Firms conducting R&D activities receive tax incentives, too. Indirect government support through R&D tax incentives amounted to 0.08% of GDP in 2007, while direct government funding of BERD was 0.05% of GDP. (OECD, 2010b, p. 77) More recent data in this format are not available, but it should be mentioned that the share of public funding in BERD increased significantly: from 9.6% in 2007 to 15.5% 2009. BERD has also grown since 2007 (Table 1 in Section 2.2.2), and hence the amount of R&D tax incentives must have risen, too.
Given the general elections in April 2010, followed by local elections in October 2010, STI policies received hardly any attention from politicians throughout the year, and thus no STI policy changes occurred. It is in line with the fact that not much weight is given to R&D and innovation in the 84page government programme, approved in May 2010, either: a mere 8 lines are devoted to these issues. (Government, 2010) A new technology and innovation policy document, underpinning the policy measures to be launched in 2011, would be finalised in January 2011.
The new government, however, suspended all disbursements from the Research and Technological Innovation Fund in June 2010; 8 and new project proposals cannot be
submitted, either. 9 Different types of reasoning can be gathered for this decision: (i)
to check if previous funding decisions had been lawful; and (ii) to cut government spending. The government decree stipulates that HUF16b (~€58.2m) should be “blocked”, that is, 36.6% of the 2010 budget of the Research and Technological Innovation Fund. 10 (1132/2010. (VI. 18.) Korm. határozata)
There is no explicit longterm strategy to build mutual trust between science and society.
The socalled grand societal challenges had not been identified prior to the planning of the current main STI policy schemes, and thus it cannot be assessed if resource allocations reflect these challenges. However, enhancing competitiveness is a major rationale of EDOP schemes, and that of most schemes supported by the Research and Technological Innovation Fund (KTIA). Besides, several KTIA schemes, as well
8 See at http://www.nih.gov.hu/aktualishirekesemenyek/2010/innovaciosalapbol; only visible at the Hungarian version of the NKTH website. Since then the NKTH has received a special permission to fulfil some of its obligations visàvis some of the ongoing projects, that is, it could be only a partial compliance with its contractual obligations.
9 http://www.nkth.gov.hu/english/newseventsmeetings/announcement
10 Stakeholders – the Hungarian Association for Innovation and the Hungarian Biotechnology Association, among others – have heavily criticised this decision, see, e.g. http://index.hu/tudomany/2010/07/02/zavart_keltett_az_innovacios_alap_befagyasztasa/;
as the ones supported by the Social Infrastructure OP and the Social Renewal OP address various societal challenges.
2.2.2 Evolution of national policy mix geared towards the national R&D investment targets
This section gives an overview of the policies aimed at increasing private R&D investment.
Evolution of BERD
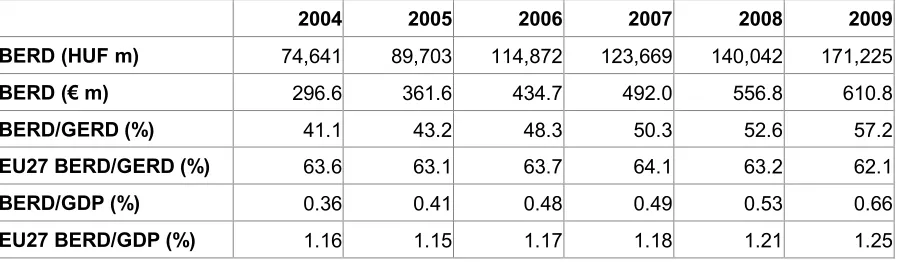
The Hungarian BERD has increased significantly since 2004 at current prices (by 105.9% by 2009), at 2000 prices, expressed in PPS (by 85.6%), as a percentage of GERD (by 39.2%) and GDP (by 83.3%). It grew even in 2009, in spite of the global financial and economic crisis, which hit Hungary rather hard. 11 Yet, the share of Hungarian BERD in GERD was 11.3 percentage points below the EU27 average in 2008, while the BERD/GDP ratio was 44% of the EU27 average. (Table 1)
[image:17.595.73.522.436.567.2]There are several schemes to encourage business R&D expenditures, and BERD has increased, indeed, since 2004. (Table 1) Of course, several other factors are also likely to contribute to this growth, especially firms’ strategies. In any case, the share of public funding in BERD increased significantly in the last few years: from 4.2% in 2004 to 8.6% in 2008; and thus exceeded the EU27 average (7.3% in 2008). The role of public resources in financing BERD further increased in 2009, and reached 15.5%. This is most likely due to the schemes cofinanced by the EU SF, but data on the actual sources of public funding for R&D activities are not available. Table 1: Evolution of BERD: Hungary compared to EU27, 20042009 (current prices)
2004 2005 2006 2007 2008 2009 BERD (HUF m) 74,641 89,703 114,872 123,669 140,042 171,225 BERD (€ m) 296.6 361.6 434.7 492.0 556.8 610.8 BERD/GERD (%) 41.1 43.2 48.3 50.3 52.6 57.2 EU27 BERD/GERD (%) 63.6 63.1 63.7 64.1 63.2 62.1 BERD/GDP (%) 0.36 0.41 0.48 0.49 0.53 0.66 EU27 BERD/GDP (%) 1.16 1.15 1.17 1.18 1.21 1.25 Source: Eurostat data, and author’s calculation
Policies towards increased private R&D investment
This subsection follows the approach developed by the Policy Mix Project, which has identified the following six ‘routes’ to stimulate R&D investment:
1. promoting the establishment of new indigenous R&D performing firms; 2. stimulating greater R&D investment in R&D performing firms;
3. stimulating firms that do not perform R&D yet; 4. attracting R&Dperforming firms from abroad;
5. increasing extramural R&D carried out in cooperation with the public sector or other firms;
6. increasing R&D in the public sector.
These routes cover the major possible ways of increasing public and private R&D expenditures in a country. Each route is associated with a different target group, though there are overlaps across routes. The routes are not mutually exclusive. As Hungarian STI policy measures do not differentiate between firms that do not yet perform RTDI activities and those that do, it is not possible to estimate the relative importance of these routes in Hungary. In general, promoting RTDI activities of firms (routes 13) is clearly at the centre of policy attention. As a rough estimate, 50% of the amount allocated to competitive RTDI funding directly promoted firms’ RTDI activities in 2009. Further, R&D and innovation is usually targeted simultaneously, therefore most measures have a wider scope than fostering R&D investments. Finally, several of the larger programmes (e.g. the National Technology Programme) support joint research projects with the participation of private and public research units. The Structural Funds play a central role in each route via several Operational Programmes (OP). 12
In sum, policy measures are not planned following this logic, and thus the weight of the various routes cannot be established, either. As for the overall policy mix towards increased private R&D investment, professional associations, business interest organisations, as well as the State Audit Office have claimed that the number of STI policy schemes is too high, because these schemes are not welltargeted and clearly differentiated. Given the large number of these schemes, firms have to shoulder a significant administrative burden when searching for support and devising project proposals, and hence access to these schemes is not easy. A large number of SMEs, in particular, cannot afford to devote the required amount of time to identify the relevant schemes and develop applications. Further, the activities of implementation agencies also become unnecessarily complicated, and decision making processes are too long, cumbersome, and insufficiently transparent. The reports by committees appraising project proposals are not always made available for the applicants. 13,14 As the Hungarian Association for Innovation has pointed out
several occasions, even after a funding decision has been made, it takes unduly long time before the contracts are signed (let alone disbursements), not least because new project documents are demanded even at this stage of the procedure.
Only four nationally funded STI policy schemes have been evaluated since 2006, 15 while schemes cofunded by the EU Structural Funds must be evaluated, following the EU rules (exante, midterm and expost evaluations).
12 For further details, see the 2009 ERAWATCH Country Report.
13 The evaluation report on the operation of the KTIA in 20042009 summarised the relevant findings as follows: “Owing to a lack of stability and to frequent organisational changes, the timing of managing the grants and the projects (e.g. contract preparations, reimbursement of costs) was highly hectic and this has had a damaging effect on the quality of technical performance.
We have observed weaknesses in the process of evaluating the proposals (e.g. there were incomplete procedure manuals, sketchy documentation, not sufficient information contained in the letters explaining rejection of proposals etc.). In addition, in some cases and referring to the first half of the period evaluated, some interviewees reported professional and ethical types of conflicts of interest and other not purely professional considerations (about external impacts beyond the operation and regulation of the Fund) experienced in the decision making process (an indepth casebycase assessment was beyond the scope of our review.)” (Ernst & Young and GKI, 2010a, pp. 45)
14 The NKTH claims, however, that the full appraisal reports (anonymously) are made available to applicants on request. (NKTH, 2006, p. 17)
Innovationoriented procurement policies are not part of the Hungarian STI policy mix.
Besides STI policies per se, several other policies affect private R&D investment via influencing its framework conditions. Macroeconomic policies have failed to create a stable, predictable environment for businesses. Economic growth has been volatile at least since the mid1990, due to the stopgo type policies to a large extent. Inflation has constantly been above the target. Government behaviour has also been unpredictable (e.g. the tax code has been rewritten frequently). Both the general government deficit and the general government debt (as a percentage of GDP) have been rather high, i.e. the economy has suffered from twin deficit, as well as a high level of government borrowing. Businesses, in turn, felt the crowding out effect of the mounting fiscal deficit. In sum, the macroeconomic environment has been unfavourable for RTDI activities of firms.
Administrative costs incurred by businesses are high by international standards, and that is especially unfavourable for SMEs. The tax system is also putting significantly higher administrative burden on companies, and the total tax rate is significantly higher than the OECD average. 16
Survey results suggest that the share of genuine entrepreneurial businesses is rather small in Hungary. The most important motivation to set up a business is “no possibility for being employed”, 17 (MVKA, 2004) while among the motives for opting
for a selfemployed status „a business opportunity” is ranked only fourth. (EC, 2004) After decades of a highly skewed size distribution of companies, dominated by large firms in the centrally planned economy era, the share of SMEs in the Hungarian economy has become fairly similar to that in the European Economic Area (EEA) already by the early 2000s (52.6% vs. 51%, respectively; 2003), while the share of mediumsized enterprises is higher (18.3% vs. 15.7%). The weight of small firms might suggest a high degree of entrepreneurship. Yet, the share of innovative Hungarian SMEs – especially that of small firms – is rather low in international comparison, and way below the share of innovative large Hungarian businesses. (CIS data)
As for competition legislation and oversight, Hungary has caught up with typical OECD practice, thanks to the entry to the European Union to a large extent. (OECD, 2007a) The government has not sheltered industry through standard protectionist measures. The Competition Office applies harsh penalties when cartel practices are noticed and can be proved. Regulation itself, however, does seem to be sufficient to create strong enough competitive pressures, which, in turn, would foster competition. Respondents to Hungarian CIS surveys indicated that financial constraints are the
evaluating the proposals. The Fund does not use indicators to monitor the progress of its midterm strategy, programmes or projects or to monitor direct and indirect impacts.
In the reviewed period, NKTH commissioned independent experts only occasionally with the task of evaluating the Fund’s operation, and no such evaluation was directed towards the Fund’s operations or the programmes as a whole. Thus, NKTH could not experience the benefits of constructive feedback. The majority of these evaluation reports were not disclosed to public.
The current management of NKTH (in office since September 2008) also perceived the above weaknesses and efforts have been made to improve the most important areas.” (Ernst & Young and GKI, 2010a, p. 5)
most severe barriers to innovation, but marketrelated factors have also been selected by a large proportion of enterprises as highly important hampering factors. Table 2: Factors hampering innovation activities, 20022004; 20042006* (%)
20022004 20042006 Innov. innov. Non Innov. innov. Non
enterprises enterprises Lack of funds within your enterprise or enterprise group 27.5 21.0 28.8 25.5 Lack of finance from sources outside your enterprise 19.6 12.2 19.9 17.0 Innovation costs too high 26.3 23.9 27.3 28.2 Lack of qualified personnel 7.5 6.5 14.0 8.9 Lack of information on technology 1.8 2.6 3.6 4.9 Lack of information on markets 3.5 3.7 3.8 5.6 Difficulty in finding cooperation partners for innovation 4.8 7.8 6.6 8.8 Markets dominated by established enterprises 14.7 16.6 15.4 17.6 Uncertain demand for innovative goods or services 15.0 18.0 14.0 20.4 No need to innovate due to prior innovations 1.5 4.3 2.3 6.4 No need to innovate because no demand for innovations 2.7 6.1 4.0 10.5 Source: Eurostat; * percentage of firms selecting a given factor as a highly important one
Notes: Innovative enterprises are understood as firms active in technological innovations. More recent data are not available as these questions were not included in the Community Innovation Survey covering the 20062008 period.
The Hungarian IPR legislation is in accordance with the EU legislation and international treaties. The respective industrial property acts are suitable to comply with the requirements of a market economy and offer an adequate protection for the innovators.
In sum, the macroeconomic situation, the structure of the economy, the overall entrepreneurship culture together with the intensity and type of competition might influence firms’ innovation activities with such a power that STI policy schemes cannot offer strong enough incentives to overrule their unfavourable effects.
2.2.3 Providing qualified human resources
The share of human resources in science and technology (HRST) in the economically active population in the age group of 2564 increased from 31.7% in 2007 to 33.2% in 2009, but remained still below the EU27 average (40.1% in 2009). The share of scientists and engineers in total employment was 4.7% in 2009, compared to 5.8% as the EU27 average. (Eurostat)
Given the nature of individual decisions whether to pursue a research career, long term trends need to be considered to identify the major factors. Changes in the size of this segment of the job market had not been favourable for a rather long period. The research system had shrunk significantly in the early 1990s when industrial research facilities were hit especially hard by economic transition. The number of FTE researchers decreased by 40% between 1990 and 1996 (from 17,550 to 10,408), it first reached the 1990 level in 2006 (17,547), and then exceeded that level in 2009 (20,064). (KSH)
The higher education sector has employed the second largest number of FTE scientists and engineers since 2006, growing modestly to 6,164 by 2009 (that is, 30.7% of total FTE scientists and engineers).
The government sector employed 5,226 FTE scientists and engineers in 2006, decreasing to 4,928 in 2009, with a corresponding share of 24.6% in total FTE scientists and engineers.
As most Hungarian universities are public, the largest employer of scientists and engineers is still the public sector (higher education and government sectors combined).
To pursue a research career is less attractive for young talents than becoming a professional (medical doctor, lawyer, manager in large public or private organisations, etc.), which can be achieved in many cases without a PhD degree, i.e. better paid jobs can be taken up even earlier, and thus lifetime earnings would be definitely higher. Further, general working conditions for a researcher, e.g. access to funding, journals, books, and modern equipment – especially in the public sector – are not satisfactory, either.
The impacts of these unfavourable factors are reflected in several indicators. First, the ratio of tertiary education graduates (ISCED levels 56) among people aged between 20 and 29 years was 4.67% in 2008 in Hungary (fluctuating between 4.5 5.0% since 2005), below the EU27 average (6.55%). Second, this ratio for science and engineering (S&E) graduates was a mere 0.63%, while 1.43% for the EU27, i.e. the gap in this respect is much wider. Third, the same ratio for those who earned a PhD degree in the reference year (ISCED level 6) was just above the half of the EU27 average (0.08% vs. 0.15% in 2007), while an even larger difference can be observed for S&E PhD degree holders (0.02% vs. 0.06%). (Eurostat) Finally, brain drain is still an important threat: the highly qualified, young workers, especially those with S&E degrees are overrepresented within the group of Hungarians working abroad. (Csanádi et al., 2008)
The low share of S&E graduates is often mentioned in policy discussions as a major challenge. What also need to be considered is that a ‘desirable’ ratio of S&E students cannot be achieved in the shortrun: it is not a question of mechanically – and forcefully – increasing the number of enrolled students at the relevant faculties. 18 First, as a basic precondition, S&E education has to build on highquality primary and secondary education. Second, more attractive job prospects are needed to lure young talents towards S&E careers. Government policies alone can create these prospects in the public research sector only. When economic development, education, employment and STI policies are pooled together, devised and implemented in an orchestrated and effective way, they can also induce businesses to create this type of jobs, but the actual decisions and investment should be made by businesses. Thus, a much wider policy perspective is needed, as well as concerted public and private efforts, sustained for a longer timehorizon, to deal with this complex challenge.
Another challenge is that a mere 3.1% of the population aged 2465 years participated in lifelong learning 19 in 2007, i.e. less than onethird of the EU average (9.6%). (EIS, 2009)
Entrepreneurship and innovation management courses are widely available from private training companies, and also included in the curricula of some universities. Finally, heated debates started again in 2010 if education curricula put too much emphasis on creativity, critical thinking, problem solving, teamwork, and communication skills at the expense of learning facts and memorisers, or on the contrary, more time and efforts should be devoted to develop these skills.
2.3 Knowledge demand
This section focuses on knowledge demand drivers. A major driver of knowledge demand is the economic structure itself. The services sector has become the predominant one in many economies, and that is the case for Hungary, too. Agriculture, hunting, forestry, and fishing accounted for 4.2% of the Hungarian GDP in 2008, manufacturing for 21.7%, energy supply for 3.0%, construction for 4.4%, while services for 66.5%. (KSH, 2010) As for services, the most important sectors were trade and repair (11.9%), transport, storage and communications (7.9%), financial intermediation (4.1%), real estate and business services (18.7%), while public administration, education, and health accounted for 17.9%.
Until recently, however, data collection and analyses on RTDI processes have been concerned mainly with manufacturing industries in most countries, including Hungary. Further, manufacturing industry has been the most important recipient of foreign direct investment (FDI) with 35.4% of the total FDI in 2008, followed by real estate and business services (22.4%), trade and repair (13.5%), and financial intermediation (12.4%). The importance of FDI in manufacturing is also reflected by the fact that 62.4% of manufacturing value added was produced by firms with at least 10% foreign ownership. From a different angle, manufacturing accounted for 52.0% of the value added produced by firms with at least 10% foreign ownership. (KSH, author’s calculation) Hence, this subsection is focussing on manufacturing.
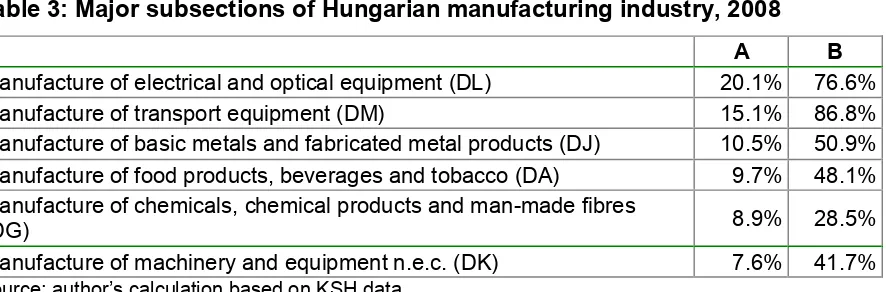
The most important subsections of manufacturing (using NACE Rev. 1.1) are described in Table 3, indicating their share in manufacturing value added, as well as their “foreign intensity”, that is, the weight of firms with at least 10% foreign ownership in producing sectoral value added. In brief, six subsections account for almost three quarters of manufacturing value added, and firms with foreign interest have a substantial weight in these segments of manufacturing.
Table 3: Major subsections of Hungarian manufacturing industry, 2008
A B
Manufacture of electrical and optical equipment (DL) 20.1% 76.6%
Manufacture of transport equipment (DM) 15.1% 86.8%
Manufacture of basic metals and fabricated metal products (DJ) 10.5% 50.9%
Manufacture of food products, beverages and tobacco (DA) 9.7% 48.1%
Manufacture of chemicals, chemical products and manmade fibres
(DG) 8.9% 28.5%
Manufacture of machinery and equipment n.e.c. (DK) 7.6% 41.7%
Source: author’s calculation based on KSH data
A: share in manufacturing value added; B: “foreign intensity”, that is, the weight of firms with at least 10% foreignownership in producing value added in a given subsection
Several sectors belonging to these manufacturing subsections – e.g. manufacture of office machinery and computers; manufacture of lighting equipment and electric lamps; manufacture of electronic valves and tubes and other electronic components; manufacture of television and radio transmitters and apparatus for line telephony and line telegraphy; manufacture of television and radio receivers, sound or video recording or reproducing apparatus and associated goods; manufacture of motor vehicles, trailers and semitrailers; manufacture of machine tools; manufacture of pesticides and other agrochemical products; manufacture of pharmaceuticals, medicinal chemicals and botanical products – are classified by the OECD as high tech or mediumhightech industries. That sectoral structure of the economy and FDI would suggest a strong demand for R&Dbased knowledge.
But exactly the dominant role of FDI in these sectors makes it possible to turn to parent companies or their partners based outside Hungary for knowledge. Foreign trade statistics on R&D services capture only a part of this type of knowledge transfer, 20 but available data clearly show the significance of knowledge inflow. The
overall value of imported R&D services stood at 83% of BERD in 2009, and two sectors accounted for a lion's share of these imports (automotive industry: 59.0%, pharmaceuticals: 8.4%). (author’s calculation based on KSH data)
Foreignowned firms do spend on R&D in Hungary, too, moreover, as already stressed, they account for the bulk of BERD (66.6%, 59.2%, and 58.2% in 2007 2009, respectively). 21 However, the overall amount of BERD, that is, €610.8m, is
rather small when compared to the R&D budget of large firms. Alstom spent slightly more on R&D (€613.0m) in 2009, and thus Hungary would rank 44 on the list of top R&D spending EU firms. 22 (IRIS, 2010)
20 These figures obviously cover only reported activities, and obviously exclude knowledge transfer when the price of R&D services is included in the price of imported components.
21 Foreign firms, besides conducting intramural R&D activities, also cooperate with Hungarian universities. Inzelt [2010] show that they have a significant impact on the internationalisation of research, e.g. there are more joint publications involving foreign than domestic companies, and the citation value per publication is significantly higher with the former.
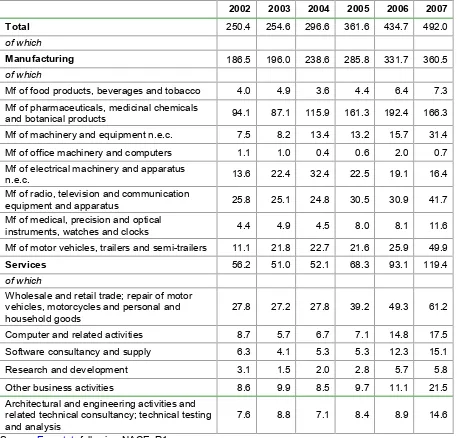
Furthermore, several of the sectors classified as hightech or mediumhightech ones, only spend tiny amounts on R&D in Hungary. (Table 4)
Table 4: Business enterprise R&D expenditure (BERD) by economic activity, selected sectors, 20022007 (million €, current prices)
2002 2003 2004 2005 2006 2007 Total 250.4 254.6 296.6 361.6 434.7 492.0 of which
Manufacturing 186.5 196.0 238.6 285.8 331.7 360.5 of which
Mf of food products, beverages and tobacco 4.0 4.9 3.6 4.4 6.4 7.3 Mf of pharmaceuticals, medicinal chemicals
and botanical products 94.1 87.1 115.9 161.3 192.4 166.3 Mf of machinery and equipment n.e.c. 7.5 8.2 13.4 13.2 15.7 31.4 Mf of office machinery and computers 1.1 1.0 0.4 0.6 2.0 0.7 Mf of electrical machinery and apparatus
n.e.c. 13.6 22.4 32.4 22.5 19.1 16.4 Mf of radio, television and communication
equipment and apparatus 25.8 25.1 24.8 30.5 30.9 41.7 Mf of medical, precision and optical
instruments, watches and clocks 4.4 4.9 4.5 8.0 8.1 11.6 Mf of motor vehicles, trailers and semitrailers 11.1 21.8 22.7 21.6 25.9 49.9 Services 56.2 51.0 52.1 68.3 93.1 119.4 of which
Wholesale and retail trade; repair of motor vehicles, motorcycles and personal and
household goods 27.8 27.2 27.8 39.2 49.3 61.2 Computer and related activities 8.7 5.7 6.7 7.1 14.8 17.5 Software consultancy and supply 6.3 4.1 5.3 5.3 12.3 15.1 Research and development 3.1 1.5 2.0 2.8 5.7 5.8 Other business activities 8.6 9.9 8.5 9.7 11.1 21.5 Architectural and engineering activities and
related technical consultancy; technical testing
and analysis 7.6 8.8 7.1 8.4 8.9 14.6 Source: Eurostat, following NACE_R1
These trends continued more recently, too (although sectors have been somewhat reclassified in NACE Rev.2): R&D expenditures in manufacturing of computers and peripheral components amounted to €0.4m in 2009, and €34.5m in manufacturing of communication equipment.