2017 3rd International Conference on Electronic Information Technology and Intellectualization (ICEITI 2017) ISBN: 978-1-60595-512-4
Analysis and Identification of Raw Egg Yolk
with the Hyperspectral Characteristics
Shiqi Huang and Wensheng Wu
ABSTRACT
The source of eggs is very rich and wide varieties, at the same time it is also an important source of nutrition for human body. But there is an important problem how to identify the quality and how to build the traceability system of eggs. This paper studied the classification and the freshness of eggs from hyperspectral characteristics of egg yolks. The spectral data of the yolks were collected by using the high resolution spectrometer and the data processing and comparative analysis operations were carried out. Finally, some beneficial conclusions are obtained, which provides new idea and methods for the quality testing of eggs.
INTRODUCTION
Egg is a very important source of nutrition food. It not only has high protein, low fat and a variety of nutrition elements, but also is very easy to be digested and absorbed. So everyone likes to eat it, and it has been deeply loved by the masses. At the same time, chickens are easy to breed and have no harsh conditions for the feeding environment. Therefore, the egg source can fully meet health needs of human.
Along with the development of the social changes and the continuous improvement of people's living standard, the requirement of people on egg quality is also more and more high, especially that the interior quality of the egg and the freshness is good or bad is directly related to its impacts to human health. At present, ________________________
there are some deficiencies in the method of grading and sorting of eggs, and internal quality testing methods, such as the destruction of samples, long time of detection and low efficiency. Therefore, how quickly, effectively and accurately to identify the egg quality is an important technical problem for solving the food safety and traceability.
There are various methods for identifying the egg quality, such as the use of various quality indexes of eggs (protein height, Hang Units, protein pH value) [1], using the senses to identify the quality [2,3], using instruments to detect features (optical features, visual features, dielectric features and spectral features) [4-7]. So far, all proposed methods have not considered the characteristics of the egg yolk. So this paper proposed the new method to detect the egg quality from the aspect of the egg yolk. The spectral data of egg yolks was measured by the spectral instrument. And the freshness and classification of eggs can be finished by spectral characteristics curves of egg yolks.
DESIGN OF MEASUREMENT EXPERIMENTS
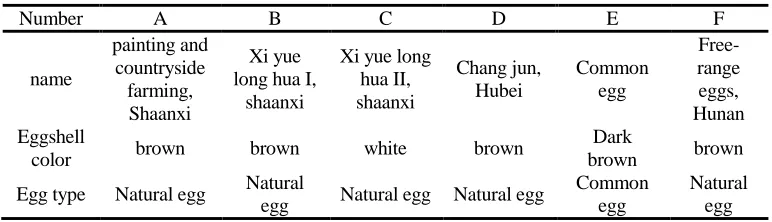
The spectral characteristics of egg yolks are measured with the FieldSpec3 spectrometer made by ASD Company in USA. The spectral range is from 350 nm to 2500 nm, including the entire visible, near-infrared and short-wave infrared. The spectral resolution is 3 nm between 350 nm and 1000 nm, and it is 10 nm in the range of from 1000 nm to 2500 nm. The sampling interval of spectrum is one nm in the actual applications with the FieldSpec3 instrument. Six egg types are designed and chose. While measuring, five eggs are randomly selected in every egg type, three eggs are used to perform the test experiments and other two eggs are for backup. The basic information of eggs is shown in Table 1. The experimental process is shown in Figure 1 and the main steps are as follows.
(1) Preparation work. The main work includes the expansion and connection of the instrument, startup of the computer and the spectral instrument, and the preparation of eggs.
[image:2.612.105.491.559.670.2](2) The preheating time of the spectrum instrument should not be less than 10 minutes.
TABLE 1. BASIC INFORMATION OF DIFFERENT EGG TYPES.
Number A B C D E F
name
painting and countryside
farming, Shaanxi
Xi yue long hua I,
shaanxi
Xi yue long hua II, shaanxi
Chang jun, Hubei
Common egg
Free-range eggs, Hunan Eggshell
color brown brown white brown
Dark
brown brown Egg type Natural egg Natural
egg Natural egg Natural egg
Common egg
Figure 1. The measurement process of the spectral characteristic of egg yolks.
(3) Get the egg yolks. Break the egg, get the yolk, and put it into in instrument or a bowl, waiting for the measurements.
(4) Obtain the spectral characteristic data of egg yolks. When the spectrum instrument is used to collect spectral data of the yolks, the sample times are designed by 50, i.e., repeating 50 times at every measurement, taking the average value as the measured result of each measurement point. There are five measurement points designed for each egg yolk. This process will continue until all the eggs are measured.
(5) Pretreatment of the obtained spectral data. The noise is included in the measurement process, so the data should perform the filtering processing. The size of the filtered window is 20 in this paper.
(6) Analyze and process the obtained spectral data for distinguishing the quality of egg yolks.
(7) Output the results.
COLLECTION AND ANALYSIS OF SPECTRAL DATA
The hyperspectral characteristic data of egg yolk of different eggs is collected. The corresponding pretreatment is carried out in the collection process, such as taking the mean of the multiple sampling and filtering the noise. The spectral characteristic curves of egg yolks of three eggs from A type are shown in Figure 2, and the three eggs are randomly selected. It can be seen in Figure 2 that the spectral characteristic curves of different egg yolks are almost same for the same type egg. And what Figure 3 shows is the mean characteristic curve of egg yolks of A type egg.
They are the hyperspectral data of egg yolks which are shown in Figures 4-8, and they denote different type egg from B to F, respectively. It can be seen in Figure 4 that there are some differences between the spectral curves of egg yolks. The difference is mainly reflected in the reflection value, but the shape of the waveform is almost same, which means that the freshness of the two eggs is different. The spectral data curve of egg yolks of C type egg in Figure 5, and the difference between different eggs is also caused by the different freshness of eggs. What Figure 6 shows is the spectral data of the egg yolks of D type egg. From this curve, there is not much difference between different eggs. The spectral features of egg yolks of E and F type eggs are shown in Figure 7 and Figure 8, respectively. The shapes of
Preheat of the field spectrometer Preparation
work for instrument
and egg measurement
Get the egg yolks
Calibration before
instrument measurement Obtain the spectral data of egg
yolks
curves are same in each figure, and only some reflection values are different, indicating that their freshness is different, that is, the length of storage time is different. With the growth of the egg storage time, the inside water of an egg gradually reduces, when the field spectrum instrument is used to measure the spectral features, the reflection value will be relatively less. That is, if the egg freshness is higher, the spectral reflection value is low, and the storage time is short. In other words, the higher the reflection value of the yolk is, the worse the freshness is, and the longer the preservation time is. By calculating the Haugh Unit of eggs and comparing with it, the law that the spectral curves reflect is same with that of Haugh Unit.
[image:4.612.105.494.253.353.2]
Figure 2. Spectral curve of egg yolks of A egg. Figure 3. Average spectral curve of A egg.
COMPARISON WITH THE DIFFERENT EGG TYPES
In order to compare the spectral characteristics of egg yolks of different egg types, the spectral characteristic data curves of each type egg yolk are obtained by counting the average value, which is shown in Figure 9. The spectral characteristic curve of egg yolks shown in Figure 10 is cut from Figure 9. The range of bands is from 400 nm to 1000 nm, i.e., the visible and near-infrared bands. Since their spectral curve is not very different in the range of short-wave infrared band, it is not considered when performing the comparison and analysis step with the spectral data. From Figure 9 and Figure 10, it is very clearly seen that the spectral characteristic curve of egg yolk of E egg type is obvious different with other five types. According to the priori information shown in table 1, the E egg type is the common egg type, while the other five types are natural eggs. Therefore, using the hyperspectral characteristics of egg yolks, natural eggs and common eggs can be easily identified. Other egg yolks features are shown in Figure 11 after the E egg type is removed. It can be known in Figure 11 that in the visible band 700 nm, the order of the reflection values if from big to small, i.e. A>B>C>F>D. The larger the reflection value is, the longer the egg is preserved. The same conclusion is obtained by measuring the PH values of egg whites.
400 600 800 1000 1200 1400 1600 1800 2000 2200 2400 0
0.1 0.2 0.3 0.4 0.5 0.6 0.7 0.8 0.9 1
Wavelength (nm)
R
e
fl
e
c
ta
n
c
e
v
a
lu
e
First egg yolk Second egg yolk Third egg yolk
400 600 800 1000 1200 1400 1600 1800 2000 2200 2400 0
0.1 0.2 0.3 0.4 0.5 0.6 0.7 0.8 0.9 1
Wavelength (nm)
R
e
fl
e
c
ta
n
c
e
v
a
lu
Figure 4. Spectral curve of egg yolk of the B egg. Figure 5. Spectral curve of egg yolk of the C egg.
Figure 6. Spectral curve of egg yolk of the D egg. Figure 7. Spectral curve of egg yolk of the E egg.
[image:5.612.100.491.91.494.2]
Figure 8. Spectral curve of egg yolk of the F egg. Figure 9. Spectral curve of different eggs.
The above experiments show that the egg can be classified as long as the spectral characteristic curves of the egg yolk are obtained, and the preliminary estimation of the freshness of eggs can be made. The egg shell color of C egg type is white, which is different from other brown egg shell. But the spectral curves of the egg yolk can't distinguish them from the egg shell color.
400 600 800 1000 1200 1400 1600 1800 2000 2200 2400 0 0.1 0.2 0.3 0.4 0.5 0.6 0.7 0.8 0.9 1
Wavelength (nm)
R e fl e c ta n c e v a lu e
First egg yolk Second egg yolk
400 600 800 1000 1200 1400 1600 1800 2000 2200 2400 0 0.1 0.2 0.3 0.4 0.5 0.6 0.7 0.8 0.9 1
Wavelength (nm)
R e fl e c ta n c e v a lu e
First egg yolk Second egg yolk Third egg yolk
400 600 800 1000 1200 1400 1600 1800 2000 2200 2400 0 0.1 0.2 0.3 0.4 0.5 0.6 0.7 0.8 0.9 1
Wavelength (nm)
R e fl e c ta n c e v a lu e
First egg yolk Second egg yolk Third egg yolk
400 600 800 1000 1200 1400 1600 1800 2000 2200 2400 0 0.1 0.2 0.3 0.4 0.5 0.6 0.7 0.8 0.9 1
Wavelength (nm)
R e fl e c ta n c e v a lu e
First egg yolk Second egg yolk
400 600 800 1000 1200 1400 1600 1800 2000 2200 2400 0 0.1 0.2 0.3 0.4 0.5 0.6 0.7 0.8 0.9 1
Wavelength (nm)
R e fl e c ta n c e v a lu e
First egg yolk Second egg yolk
400 600 800 1000 1200 1400 1600 1800 2000 2200 2400 0 0.1 0.2 0.3 0.4 0.5 0.6 0.7 0.8 0.9 1
Wavelength (nm)
R e fl e c ta n c e v a lu e
Figure 10. Spectral data of the yolk in visible Figure 11. Spectral curves of egg yolks of and near-infrared bands. different natural egg types.
CONCLUSIONS
This paper discussed the spectral characteristics of egg yolks. We design different experiments and measure their spectral data. After the processing and analysis to the obtained data, it is concluded that spectral characteristics of egg yolk can identify the egg types, and can also perform the qualitative description of egg freshness. The results are consistent with the other quality parameters. This shows that the spectral characteristics of egg yolks can be used to identify and analyze the quality of eggs
ACKNOWLEDGEMENT
The work was supported by Natural Science Foundation of China (No. 61379031, 41574008), Natural Science Basic Research Plan in Shaanxi Province of China (No. 2016JM6052) and Special Foundation for Special Talents of Xijing University (No. XJ17T04).
REFERENCES
1. Zhang, X. M., S. H. Lu, H. C. Jiao, et al. 2013. “Analysis of the Colorful Pheasant Egg Quality Traits of America,” China Poultry (in Chinese), 35(16): 52 -54.
2. Wang, Q. H. 2009. Study on detection method of egg safety quality. The Doctoral Dissertation of Hua Zhong Agricultural University, Wuhan, China.
3. Duman, M., A. Sekeroglu, A. Yildirim, et al. 2016. “Relation Between Egg Shape Index and Egg Quality Characteristics,” European Poultry Science, 80: 1-9.
4. Omid, M., M. Soltani, M. H. Dehrouyeh, et al. 2013. “An Expert Egg Grading System Based on Machine Vision and Artificial Intelligence Techniques,” Journal of food engineering, 118: 70-77. 5. Wang, H.,J. Mao, J. Zhang. 2016, “Acoustic Feature Extraction and Optimization of Crack
Detection for Egg Shell,” Journal of food engineering, 171: 240-247.
6. Deng, X., Q. Wang, H. Chen, et al. 2010. “Egg Shell Crack Detection Using a Wavelet-based Support Vector machine,” Computers and electronics in agriculture, 70(1):135-143.
7. Sun, J., B. Liu, H. P. Mao, X. H. Wu, H. Y. Gao, N. Yang. 2016. “Non-destructive Examination for Freshness of Eggs Based on Dielectric Properties and Yolk Index Regression Model.
Transactions of the Chinese Society of Agricultural Engineering (Transactions of the CSAE),
32(21): 290 -295.
4000 500 600 700 800 900 1000 0.1
0.2 0.3 0.4 0.5 0.6 0.7 0.8 0.9 1
Wavelength (nm)
R
e
fl
e
c
ta
n
c
e
v
a
lu
e
A egg yolk B egg yolk C egg yolk D egg yolk E egg yolk F egg yolk
400 500 600 700 800 900 1000 0
0.1 0.2 0.3 0.4 0.5 0.6 0.7 0.8 0.9 1
Wavelength (nm)
R
e
fl
e
c
ta
n
c
e
v
a
lu
e