2017 3rd International Conference on Electronic Information Technology and Intellectualization (ICEITI 2017) ISBN: 978-1-60595-512-4
Community Detecting by Signal and Flooding
Algorithm on Complex Networks
Baichao Wang, Haibin Yu, Yongfeng Wang, Yanyan Wei
and Jianpeng Liu
ABSTRACT
Community detecting has been the focus of many recent efforts on complex networks. In this paper, we propose a new community detecting algorithm. By signal transmission process on complex networks with Flooding algorithm, influence vectors of each node are got, and topological structure of each node is translated into geometrical relationships of spatial vectors. Thus, according to the nature of the clustering, the network structure of module is detected. In order to get the feasible spatial vectors, this paper puts forward the optimum passes method, which allows the reduction of the searching space and speeds up the convergence of algorithm. Thus, the search capability of community detecting is effectively strengthened. The proposed algorithm is tested on both computer-generated and real-world networks, and is compared with current representative algorithms in community mining. The evidence indicates that the algorithm is feasible and high accuracy.
INTRODUCTION
The study of complex networks has received an enormous amount of attention from scientific community in recent years. There are ubiquitous in all fields such as social and communication network, world wide web, metabolic network and many more. Through a large number of studies, researchers have discovered several statistical properties that many networks have in common, such as small world ________________________
property[1], scale free distribution[2] and so on. A new property that seems to be common to many networks is community structure. Community means high concentrations of edges within special groups of vertices, and low concentrations between these groups.
It is an important subject that how to find the communities of network. At present, the algorithms proposed by researchers have been roughly divided into three categories: heuristic algorithms, algorithms based on optimization method and algorithms based on similarity. The first category is to transfer the problem of community detection to the designing problem of predefined heuristic rules. For example, the heuristic rule of the GN algorithm is that the connection between cluster edge betweenness should be greater than the quantity of connection edge between ness and there are extremal optimization algorithm[4], the Wu - Huberman algorithm[5], etc. The second category is to transfer the clustering problem of complex network to an optimization problem, which is used to calculate the complex network community structure through the optimization of predefined objective function. For example, spectral clustering method[6]is to transfer from the network clustering problem to an optimization problem two times, and this type of algorithms optimize the predefined by computing eigenvector matrix "cut" function, such as Signal algorithm[7] and Potts algorithm[8]. The third category is the similarity between the nodes according to definition of the network topology structure, such as Correlation coefficient based on the structural congruence[9], nodes clustering centrality and so on. The most critical question is time complexity and accuracy of all community detection algorithms.
In this paper, by signal process on complex networks with Flooding algorithm[10],influence vectors of each node are got, and topological structure of each node is translated into geometrical relationships of spatial vectors. Thus, according to the nature of the clustering, the network structure of module is detected. In order to get the feasible spatial vectors, this paper puts forward the optimum passes method, which allows the reduction of the searching space and speeds up the convergence of algorithm. Finally, the optimal number of communities has been determined basing on the modularity Q and accuracy of nodes correct division. Then we apply the method to detect the communities in some real networks, such as College football network[3] and Scientific collaboration network[10]. After verification, the algorithm is compared with GN algorithm, the spectral clustering algorithm, signal[7] algorithm. The evidence indicates that the algorithm is feasible and high accuracy.
THE INTRODUCTION OF SIGNAL ALGORITHM
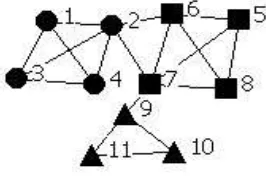
sends the signal averagely to its neighbors. Afterwards, the nodes with signals can also send signals averagely to their neighbors. One thing should be mentioned in this signal process is that the node can record the amount of signals it received, and at every time step, each node sends its present-owning signals to its neighbors. After the inspiration of a certain 3 or 4 time steps, the signal distribution over the nodes could be viewed as the influence of the source node to the whole network. For a network with n nodes, signal distribution can be characterized by and vector. Thus, by the above signal process on networks, the topological structure of nodes is converted into the geometrical relationships of vectors in Euclidian space. We can get the community structures of nodes by clustering these vectors. There is a simple network with three communities, and different graphics represent different communities as Fig.1.
Figure 1. Different graphics represent different communities.
According to the above ideas, the nodes 1,3,11 are regarded as information source and send its signals averagely to its neighbors at a time. After 4 time steps, the vectors are gotten:
X1={1.0000,0.4979,0.6839,0.6839,0.1017,0.1689,0.1668, 0.1017,0.1936,0.2157,0.1844};
X3={0.6791,0.4799,1.0000,0.6791,0.0667,0.1398,0.1178,0.0667,0.0256,0.0067, 0.0067};
X11={0.0044,0.0233,0.0044,0.0044,0.0463,0.0394,0.1304, 0.0463, 0.6167, 0.7889, 1.0000};
2 1
[
(
) ]
2
c n c c cl
d
Q
m
m
(1)
Here, nc is the number of clusters, lc the total number of edges joining vertices of module c and dc the sum of the degrees of the vertices of c. In Eq. (1), the first term of each summand is the fraction of edges of the graph inside the module, whereas the second term represents the expected fraction of edges that would be there if the graph were a random graph with the same expected degree for each vertex.
Because the signal passes only 3 or 4 times in algorithm, the small networks can effectively divide community structure of the networks. The networks possessing large numbers of nodes don’t find the best community structure, due to the edge node unable to obtain the information. To solve this problem, this paper proposes a method to find communities based on Flooding Algorithm. It is not only to solve the above problems effectively, but also improve the accuracy of community structure. For obtaining the optimal communities, the modularity Q is maximum and accuracy of community structure proposed by Ying[11] et al. must be reasonable. The accuracy refers to the degree of approaching a algorithm for partitioning the network community structure and the actual network community structure.
COMMUNITY DETECTING BY SIGNAL AND FLOODING ALGORITHM
Flooding Algorithm
The Flooding algorithm[12] will transmit signal like flood to ensure to reach the destination. The basic idea of algorithm is that if it is the first time for each router to receive information, the information must be transmitted to all the nodes connected with their own, or discarded automatically. All routers will follow the same principle, and transmit this information to the destination.
Improvement of Signal Transmission Times
overflow. Then, we will obtain advantageous community structure. The following two experiments will prove the reasonableness of this conclusion.
In order to compare our algorithm with others, first we test it on computer-generated random graphs with a well-known predetermined community structure. Each graph has N = 128 nodes divided into 4 communities of 32 nodes each. Edges between two nodes are introduced with different probabilities depending on whether the two nodes belong to the same group or not: every node has <kintra> links on average to its fellows in the same community, and <k>links to the outer-world, keeping <kintra>+<kinter>=16. With the development of <kinter>more and more big, the community structure becomes increasingly fuzzy[3] .We record the fraction of nodes classified correctly when we set different value of signal transmission times T as Fig.2.
Fig.2 Comparison diagram of accuracy of different T.
By varying <kinter>.We set 2,3,4,8, MSP (Maximum Shortest Path) as signal transmission times. Each value is the average of 100 runs in the same case. We can see that t the accuracy with T=MSP is better than others.
Figure 3. Comparison diagram of modularity Qof different Tby varying <kinter>.
Comparison of Accuracy with Other Algorithms
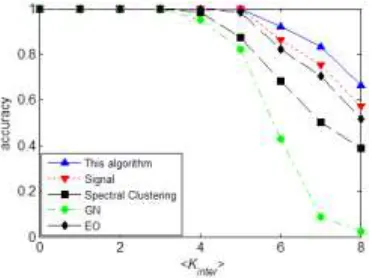
In order to test and verify the effectiveness and accuracy of algorithm, we use it to compare with GN algorithm (GN)[3], Extremal Optimization (EO)[4], Spectral Clustering algorithm[6], Signal[7] as Fig.4.
Figure 4. Comparison diagram of accuracy of different T by varying <kinter>.
[image:6.612.216.402.327.466.2]EMPIRICAL RESULTS ON SOME REAL NETWORKS
Because topology structure of the actual network and computer generated networks is not same, as a further test of our algorithm, this paper adopts three networks such as American University football network and scientific collaboration network.
United States College Football
[image:7.612.213.412.346.524.2]College football network was provided by Mark Newman in 2000[3]. The network is a representation of the schedule of Division I games for the 2000 season: vertices in the network represent teams and edges represent regular-season games between the two teams they connect. The 115 teams are divided into 12 conferences. There are 7 games between members of the same conference, but there are 4 games between members of different conferences. There are 613 games in the network. There is College Football Club structure diagram with nodes of different shapes and colours representing different conferences and the edges representing match as Fig.5.
Figure 5. The network of college football games for year 2000.
TABLE 1. THIS ALGORITHM CAN GET THE EXPERIMENTAL RESULTS TABLE.
Number Nodes 1 1,510,17,24,42,94,105 2 2,26,34,38,46,90,104,106,110 3 3,7,14,16,33,40,48,61,65,101,107 4 4,6,11,41,53,73,75,82,85,99,103,108 5 8,9,22,23,52,69,78,79,109,112 6 12,25,29,51,70,91
7 3,15,19,27,32,35,37,39,43,44,55,72,86,100 8 18,21,28,57,63,66,71,77,88,96,97,114 9 20,30,31,36,56,80,81,83,95,102 10 47,50,54,68,74,84,89,111,115 11 59,60,64,98
12 45,49,58,67,76,87,92,93,113
From the table we can see that there are 107 nodes being classified correctly. In other words, the correct classification accuracy is 93.04% better than 90.43% of Signal, 67.13% of GN and 71.94% of EO. At the moment, the modularity Q of network is 0.5898 better than 0.536 of Signal and 0.579of EO.
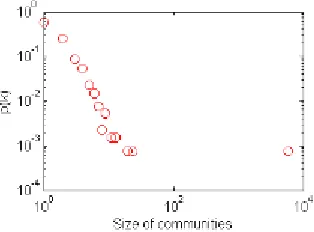
Scientist Collaboration Network
[image:8.612.231.388.514.630.2]CONCLUSIONS
In this paper, we improve the existing algorithm of Signal based on Flooding algorithm, then put forward a kind of effective algorithm of detecting community structure. Through verification, after the inspiration of MSP (Maximum Shortest Path) steps on the network, the signal distribution of the nodes denoted by an n-dimensional vector is the best. At the moment, we make a comparison between our algorithm and other relatively mature ones such as EO, CNM and GN algorithms in some networks. Results verified by both ad hoc and real networks have proved the proposed algorithm is effective and a high degree of accuracy. This algorithm not only applies to a small network, but also network of the scale of nodes can be accurately divided. One problem of our algorithm is that it only makes use of the static data network. So the dynamic data network is our main research direction in future work.
REFERENCES
1. Watts D J, Strogatz S H. Collective dynamics of ‘small-world’ networks[J]. Nature. 1998, 393(6638): 440-442.
2. Albert R, Jeong H, Barabási A L. The internet's achille's heel: error and attack tolerance of complex networks[J]. Nature. 2000, 406(2115):378-382.
3. Michelle Girvan, M. E. J. Newman. Community structure in social and biological networks[J]. Proc. Natl. Acad. Sci. 2001, 99: 7821~7826.
4. Duch J, Arenas A. Community detection in complex networks using extreme optimization[J]. Physical Review E, 2005, 72:027104.
5. Wu F, Huberman B A. Finding communities in liner time: A physics approach. Eur. Phys. J. B, 2004, 387:331~338.
6. Donetti L, Munoz M A. Detecting network communities: A new systematic and efficient algorithm. Stat. Mech. Theor. Exp. 2004, P10012.
7. Hu Yan-qing, LiMeng-hui, Zhang Peng. Community detection by signal on complex networks[J]. Phys Rev E.2008.78.
8. J. Reichardt and S. Bornholdt. Detecting Fuzzy Community Structures in Complex Networks with a Potts Model[J]. Phys. Rev. Lett. 2004, 93, 218701.
9. Wasserman S, Faust K. Social Network Analysis. Cambridge: Cambridge University Press, 1994.
10. Filippo Radicchi, Claudio Castellano, Federico Cecconi, Vittorio Loreto, Domenico Parisi. Defining and identifying communities in networks[J]. Proc. Natl. Acad. Sci. 2004, 101:2658~2663.
11. Ying Fan, Menghui Li, Peng Zhang, Jinshan Wu, Zengru Di. Accuracy and precision of methods for community identification in weighted networks[J]. Physica A 377 (2007) 363-372.
12. E Shih, S Cho, N Iekes. Physical layer driven protocol and algorithm design for energy-efficient wireless sensor network[C]. In: Proceedings of ACM MobiCom, Rome, Italy, 2001:272-286. 13. Chuanjun Pang, Fengjing Shao, Rencheng Sun, Shujing Li. Detecting Community Structure in
Networks by Propagating Labels of Nodes. Sixth International Symposium on Neural Networks (ISNN2009).
14. M. E. J. Newman. Scientific collaboration networks: I[J]. Network construction and fundamental results, Phys. Rev. E 64, 016131 (2001)