R E S E A R C H A R T I C L E
Open Access
Towards characterizing the regional
cerebral perfusion in evaluating the
severity of major depression disorder with
SPECT/CT
Jinming Li
1,2†, Yuan Yang
3†, Yuankai Zhu
1, Liqiang Zhou
1, Yunfeng Han
1, Tao Yin
1, Zhaoting Cheng
1,
Guopeng Zhang
1, Yanxia Shen
1and Jing Chen
1*Abstract
Background:Major depressive disorder (MDD) is a common mental disorder worldwide, but now there is a lack of clinically effective assessment and management of MDD. In this study, we used technetium-99 m ethylcysteinate dimer ([99mTc]ECD) SPECT/CT to characterize the regional cerebral blood flow (rCBF) status of MDD patients, and to explore an objective image assessment model of MDD which is non- or minimally-invasive, convenient and accurate in a clinical setting.
Methods:The severity of MDD was assessed by three trained psychiatrists, based on scores obtained from HAMD and HAMA. [99mTc]ECD rCBF SPECT/CT was performed in 20 healthy controls and 74 unipolar MDD patients before receiving the treatment. The CT attenuation-corrected SPECT images data were automatically registered, analyzed simultaneously by 3D-SSP and eZIS.
Results:The mean score of HAMD and HAMA in the MDD patients was 25.49 ± 6.00, and 23.12 ± 5.83, respectively. There was a positive correlation between two scores. The MDD women had higher HAMD scores than MDD men. The decreased rCBF of MDD patients in frontal lobes (bilateral B11, B47 and right B4, B6, B10, B46), temporal lobe (right B21, B41, B42) and cingulated cortex (bilateral B24, B33), while their increased rCBF in occipital lobe (bilateral B17, B19 and left B18). Additionally, the depression severity was negatively correlated with decreased rCBF in left ventral anterior cingulate cortex B24, and was positively correlated with decreased rCBF in left inferior prefrontal gyrus B47 and increased rCBF in right associative visual cortex B19. The anxiety severity was negatively correlated with decreased rCBF in left subgenual cortex B25.
Conclusions:Although the mechanism underlying the correlation is not yet fully understood, our findings indicated that the rCBF SPECT/CT may provide an objective assessment for MDD severity. It might be used monitoring therapeutic efficacy in the management of MDD.
Keywords:Major depressive disorder, Cerebral blood flow, SPECT/CT, [99mTc]ECD
* Correspondence:lindaxcx@vip.163.com
†Equal contributors
1Department of Nuclear Medicine, Tongji Hospital, Tongji Medical College,
Huazhong University of Science and Technology, Wuhan, Hubei Province 430030, China
Full list of author information is available at the end of the article
Background
Major depressive disorder (MDD) is a common men-tal disorder worldwide. It is characterized by a per-sistent low mood and a loss of interest or pleasure [1]. MDD is also a disabling condition that adversely affects the sufferers’ whole lives. Moreover, MDD can lead to suicide. Over 800,000 people die by suicide every year, and most of them are suffering from MDD [2]. However, fewer than 10% of MDD sufferers have ever received effective treatments, and one of the most significant barriers is lack of effective assess-ment and manageassess-ment of MDD [2].
Today, the most widely used criterion for assessing MDD is the fourth edition of the Diagnostic and Statistical Manual of Mental Disorders (DSM-IV) published by American Psychiatric Association, and the 10th revision of International Statistical Classifi-cation of Diseases and Related Health Problems (ICD-10) list by the World Health Organization. DSM-IV is more popular among mental health pro-fessionals [3]. The Hamilton Rating Scale for Depres-sion (HAMD) is a multiple-item scale for measuring the severity of depression. However, it has been criti-cized for its subjectivity [4]. There is a demand for objective assessment of MDD, which is non- or minimal-invasive, convenient and accurate in a clin-ical setting.
Since the late 1970s, functional neuroimaging, includ-ing sinclud-ingle photon emission computed tomography (SPECT), positron emission tomography (PET), mag-netic resonance imaging (MRI) and fusing imaging (SPECT/CT, PET/CT or PET/MRI) has been extensively used in MDD [5–9]. Regional cerebral blood flow (rCBF) SPECT is a nuclear medicine imaging method in routine clinical practice, and is also one of the earliest functional neuroimaging studies in MDD [10]. According to previ-ous research, there is almost complete agreement that blood flow in the frontal lobe is reduced in MDD pa-tients [9, 11–14], but the controversies still exist in the extent of the rCBF involvement [15–17]. It has been speculated that the various patterns of rCBF abnormal-ities in MDD patients may be related to the various clin-ical presentation of MDD [15–17].
In this study, the rCBF status of MDD patients was characterized with technetium-99 m ethylcysteinate dimer ([99m
Tc]ECD) SPECT/CT. The localization of ab-normal rCBF was represented by Brodmann areas. In addition, we explore the relationship in MDD patients be-tween the imaging features, clinical presentation and the severity of the symptoms. It is expected that the conven-tional nuclear medicine imaging could help add an object-ive image assessment model of MDD in current psychiatric practice that relies mainly on self-reporting of symptoms and clinical interviews.
Methods
Subjects
74 patients (21 men and 53 women) who fulfilled the DSM-IV criteria1for unipolar MDD were enrolled in this study, with age ranging from 20 to 72 years (mean 41.9 years old). All patients were outpatients from the de-partment of psychiatry, Tongji Hospital of Tongji Medical College, Huazhong University of Science and Technology (HUST). The severity of MDD was assessed by three trained psychiatrists, based on scores obtained from HAMD and Hamilton Rating Scale for Anxiety (HAMA). 20 healthy controls (8 men and 12 women) were recruited through local advertisements, ranging from ages 22 to 59 (mean 38.0 years old). All MDD patients and healthy con-trols subjects were right handed, had never taken psycho-tropic medication, and had no central nervous system disorders and other medical disorders clearly affecting cerebral blood flow and cognitive function.
This study was approved by the local ethics committee at Tongji Hospital of Tongji Medical College, HUST (Permit Number: TJ-C20141220). All subjects received a detailed description of the study and gave written in-formed consent.
SPECT/CT
99
Mo-99mTc generator was provided by Beijing Atomic High-tech Co., Ltd., China. The ECD kit was purchased from Jiangsu Atom Medicine Research Institute Jian-gyuan Pharmaceutical Factory, China. The radiochemical purity of99mTc]ECD was over 95%.
[99mTc]ECD rCBF SPECT/CT was performed using a hybrid system (Discovery NM/670, General Electric) at the department of Nuclear Medicine, Tongji Hospital of Tongji Medical College, HUST, in 20 healthy controls and 74 unipolar MDD patients before receiving treat-ment. The hybrid system consists of a double-headed SPECT equipped with low-energy high-resolution colli-mators and a 16-detector row CT. The SPECT reso-lution is 9.9 mm. All subjects were administrated 740 MBq (20 mCi) [99mTc]ECD after resting 30 min with eyes closed in a dimly quiet room. Followed resting an-other 30 min, SPECT/CT fusing imaging were per-formed with a 20% window width centered at 140 KeV and a 128 × 128 matrix. Reconstructed images were dis-played as CT images, SPECT images, and fusion images in the axial, coronal, and sagittal planes as well as max-imum intensity projection images.
Image analysis
(Department of Internal Medicine, University of Mich-igan, Ann Arbor, MI, USA). All CT attenuation-corrected SPECT data were automatically registered, an-alyzed and compared with a normalized database using 3D-SSP. A Z-score-based semi-quantitative analysis was used, and the Z-score of 1.5 was set as a cutoff point to identify the brain areas with abnormal rCBF. The localization of abnormal rCBF was presented by Brod-mann areas (B). Besides, regions of interest (ROIs) were drawn on the transverse sections of the SPECT/CT fu-sion images by one operator over caudate nucleus, glo-bus pallidus, hippocampus and cerebellum, which cannot be identified clearly by B. The mean counts of cerebellum were measured correcting for background counts, which mostly remains unchanged rCBF in all subjects according to our observational study. The frac-tion of mean counts in the targeted area ROI-to-cerebellum ROI was calculated as [99mTc]ECD uptake index (UI).
The same CT attenuation-corrected SPECT images data were also processed using statistical parametric mapping (SPM12; Functional Imaging Laboratory, Uni-versity College London, London, UK) and easy Z score imaging system (eZIS; Fijifilm Ri Pharma Co., Kanazawa, Japan).
Statistical analysis
Data were processed using the IBM SPSS Statistics V19.0 (SPSS Inc., Chicago, IL, USA). Results were expressed as mean ± SD. A P value (P<0.05) is consid-ered statistically significant. Student t-test was used to compare the difference in the HAMD score / HAMA
score between groups, and to identify abnormal rCBF between healthy controls and MDD patients. Pearson correlation analysis and multiple linear regression ana-lysis were used to infer causal relationships between re-gional cerebral Z-scores and HAMD scores / HAMA scores in MDD patients. The result of eZIS was visual-ized using xjView toolbox (http://www.alivelearn.net/ xjview).
Results
The mean HAMD score and the mean HAMA score in the MDD patients were 25.49 ± 6.00 and 23.12 ± 5.83, re-spectively, and as for healthy controls, the mean scores were 2.70 ± 1.42 and 0.65 ± 0.88, respectively. There was a positive correlation between two scores for MDD pa-tients (r= 0.732,p= 0.000) (Fig.1).
It is still controversial whether there are correlations between the MDD severity and the patient characteris-tics. In this study, the HAMD score showed no correla-tions with the ages of MDD patients (r= 0.134, p= 0.255). The MDD women (26.66 ± 5.11) had higher HAMD scores than the MDD men (22.52 ± 7.08, t= 2.801,p= 0.007).
Compared with the normal controls data, 3D-SSP ana-lysis showed that the MDD patients had decreased rCBF in frontal lobe (bilateral B4, B9, B10, B11, B47 and left B8 and right B6, B44, B46), parietal lobe (left B312), temporal lobe (right B21, B41, B42), cingulated cortex (bilateral B24, B32) and hypophysis. And it also showed in the MDD patients increased rCBF in parietal lobe (right B7), temporal lobe (right B28), occipital lobe (bi-lateral B17, B19 and left B18) and cingulated cortex (left
[image:3.595.58.540.478.714.2]B23 and right B31, B33). The detailed Z-scores were shown in Table 1. There was no statistically significant difference between MDD patients and normal controls for rCBF in hippocampus, caudate nucleus and globus pallidus (Table2).
The HAMD score had a negative correlation with de-creased rCBF in left ventral anterior cingulate cortex B24, a positive correlation with decreased CBF in left
inferior prefrontal gyrus B47 and increased rCBF in right associative visual cortex B19 (R= 0.400, F = 4.453, p= 0.006). In addition, there was a negative correlation be-tween the HAMA score and decreased rCBF in left sub-genual cortex B25 (r=−0.309,p= 0.007).
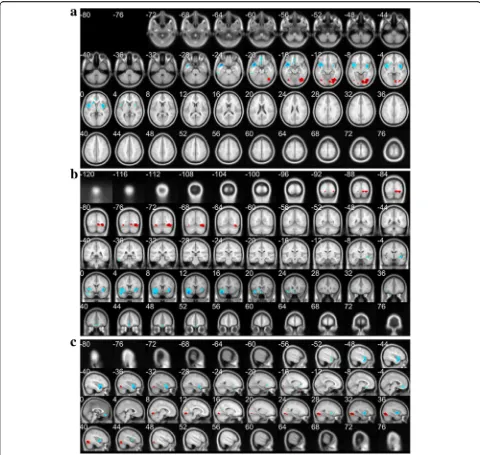
The differences of rCBF between MDD patients and normal controls were significant at the cluster lever (PFWE-corr< 0.05) in the SPM and eZIP analysis. The re-sults were listed in Table 3, and showed in Fig.2 which was drawn from xjView toolbox and showed the de-creased and inde-creased rCBF foci in MDD patients.
According to 3D-SSP and eZIP analysis, the consistent results showed the decreased rCBF of MDD patients in frontal lobes (bilateral B11, B47 and right B4, B6, B10, B46), temporal lobe (right B21, B41, B42) and cingulated cortex (bilateral B24, B33), while their increased rCBF in occipital lobe (bilateral B17, B19 and left B18).
Discussion
[image:4.595.305.538.121.231.2]MDD is a heterogeneous disorder with various clinical presentation and inconsistent response to treatment. But its pathogenesis is inadequately understood [6, 18]. The mechanism that underlies the altered rCBF in MDD pa-tients is not fully elucidated, however, previous studies [19, 20] suggested that the depressive symptoms were associated with reduced parasympathetic and increased sympathetic tone resulting in a broad range of hemodynamic changes, including elevated systemic vas-cular resistance. In addition, activation of immune-inflammatory pathways in MDD may also contribute to the process. Our study showed that more severe MDD patients would experience more anxiety. It has been sug-gested to be caused partly by brain chemistry neuro-transmitter imbalances [21]. Antidepressant medication and behavioral therapy can help MDD patients over-come both depression and anxiety. However, clinicians have observed when depression occurs together with anxiety, symptoms are more severe than when depres-sion or anxiety occurs alone, furthermore, it may be Table 1Z-scores of the increased/decreased rCBF areas in MDD
patients from 3D-SSP
Z-score t
value pvalue
MDD CON
INC: B7 R 4.60 ± 1.78 3.74 ± 1.97 2.371 0.019
B17 L 6.12 ± 1.22 4.80 ± 1.76 4.703 0.000
R 5.47 ± 1.70 4.30 ± 1.45 3.685 0.000
B18 L 6.35 ± 0.96 5.72 ± 0.99 3.323 0.001
B19 L 6.70 ± 0.80 6.38 ± 0.80 2.033 0.044
R 6.19 ± 1.08 5.41 ± 1.13 3.593 0.000
B23 L 3.43 ± 1.92 2.67 ± 1.84 2.050 0.043
B28 R 1.60 ± 2.83 0.00 ± 0.00 4.873 0.000
B31 R 4.52 ± 1.96 3.59 ± 2.00 2.414 0.017
B33 R 3.36 ± 2.53 2.49 ± 1.89 2.086 0.039
DEC: B123 L 1.79 ± 2.28 2.77 ± 1.93 2.312 0.023
B4 L 1.46 ± 1.99 2.39 ± 2.09 2.354 0.020
R 6.39 ± 1.09 6.77 ± 0.37 2.658 0.009
B6 R 2.17 ± 2.05 3.18 ± 1.82 2.590 0.011
B8 L −3.84 ± 1.97 −2.99 ± 1.75 2.276 0.025
B9 L 1.72 ± 1.61 2.69 ± 1.17 3.653 0.000
R 1.79 ± 1.67 2.74 ± 1.58 2.941 0.004
B10 L 1.55 ± 1.70 2.73 ± 1.78 3.466 0.001
R 1.33 ± 1.77 2.91 ± 1.58 4.723 0.000
B11 L 2.50 ± 2.15 3.41 ± 1.86 2.357 0.021
R 2.81 ± 2.16 3.74 ± 1.94 2.256 0.026
B21 R 2.89 ± 1.88 3.70 ± 1.88 2.205 0.030
B24 L 1.61 ± 1.84 2.26 ± 1.32 2.162 0.033
R 3.60 ± 1.64 4.18 ± 0.91 2.436 0.016
B32 L 1.72 ± 1.61 2.95 ± 1.31 4.398 0.000
R 1.72 ± 1.66 3.31 ± 1.25 5.772 0.000
B41 R 1.45 ± 1.86 2.30 ± 2.01 2.260 0.026
B42 R 1.67 ± 1.91 2.46 ± 1.87 2.115 0.037
B44 R 2.25 ± 1.92 3.22 ± 1.65 2.817 0.006
B46 R 1.96 ± 1.99 3.02 ± 1.94 2.739 0.007
B47 L 1.90 ± 1.88 2.92 ± 1.21 3.515 0.001
R 2.46 ± 1.84 3.46 ± 1.29 3.392 0.001
hypophysis 6.84 ± 0.45 7.00 ± 0.00 3.109 0.003
Lleft,Rright,DECthe decreased rCBF areas,INCthe increased rCBF areas,
rCBFregional cerebral blood flow,MDDmajor depressive disorder,
[image:4.595.55.291.217.710.2]CONcontrol
Table 2Quantitative assessment of rCBF changes in caudate nucleus, globus pallidus and hippocampus from regions of interest method
UI (mean ± SD) t
value pvalue MDD group Control group
HIP L 0.698 ± 0.103 0.718 ± 0.087 0.789 0.435
R 0.677 ± 0.074 0.667 ± 0.088 0.527 0.600
CAU L 0.850 ± 0.110 0.854 ± 0.117 0.141 0.888
R 0.799 ± 0.102 0.800 ± 0.096 0.043 0.966
GLO L 0.928 ± 0.110 0.967 ± 0.129 1.361 0.177
R 0.910 ± 0.117 0.957 ± 0.099 1.657 0.101
MDDMajor depressive disorder,HIPHippocampal gyrus,CAUCaudate nucleus,
likely to develop treatment-resistant depression [22]. Additionally, our study also showed that the severity of depression had no correlations with age, and that women were found more likely than men to develop se-vere depression, the possible reasons may be as follows: women are more likely than men to show mood amplifi-cation; women have a greater propensity to be more pas-sive than men; women may be exposed to more stressful life events than men [23].
To minimize the deviation errors caused by analysis software packages, 3D-SSP and eZIP image-processing programs were applied in the same CT attenuation-corrected SPECT images data of MDD patients and nor-mal controls. According to previous studies [24,25], the difference between 3D-SSP and eZIP lies in smoothing process after anatomic standardization. The smoothing process by eZIP is based on an SPM algorithm and ef-fectively enhances the signal-noise ratio of images, which might overestimate cerebral hypoperfusion [24, 25]. So we apply corrections for multiple comparisons based on family-wise error (FEW), and PFWE-corr< 0.05 is consid-ered statistically significant in eZIP analysis. On the other hand, due to uninvolving such a smoothing process the preanalysis image reconstruction conditions might affect the results of 3D-SSP. Therefore, in 3D-SSP analysis all CT attenuation-corrected SPECT images data of MDD patients were compared with a normalized database and those of normal controls data simultan-eously. Finally, the consistent results from 2 statistical image analysis methods were defined as the abnormal rCBF status of MDD patients. By 3D-SSP and eZIP ana-lysis, we concluded that the decreased rCBF of MDD pa-tients was in frontal lobes (bilateral B11, B47 and right B4, B6, B10, B46), temporal lobe (right B21, B41, B42)
and cingulated cortex (bilateral B24, B33), while their in-creased rCBF was in occipital lobe (bilateral B17, B19 and left B18). Thus it can be seen that the rCBF abnor-malities of MDD patients appear in bilateral cerebral hemisphere, and the hypoperfused regions showed right-hemisphere dominance while the area of hyperperfusion had a slight left-hemisphere dominance.
In the previous studies about brain structure [7, 26], metabolism [27] and perfusion [17], the medial pre-frontal cortex (mPFC) and anterior cingulate cortex (ACC) in MDD patients have been found increased functional connectivity, which was related to one of pos-sible pathophysiological mechanisms of depression—— -dysfunction of default mode network (DMN) [21, 28]. The hypoperfused areas of frontal lobes and cingulated cortex in MDD patients of this study largely coincided with what have been reported in the past [9,16,29,30]. Although there was no consensus in regard to the hypo-perfusion of temporal lobe and the hyperhypo-perfusion of oc-cipital lobe, some researchers [9] have mentioned the abnormal perfusion of these cerebral regions in patients with treatment-resistant depression, and other re-searchers [31] suggested that abnormal activation of the occipital lobes may be an initiating factor cognitive dis-order in depressed patients. We found there was no sig-nificant difference in the cerebellar blood flow of MDD patients as compared with that of normal controls, which was inconsistent with the findings of Gardner et al28
[image:5.595.58.542.99.283.2], in which cerebellum resulted to be heavily impli-cated in a large cohort of patients with persistent de-pressive disorder (PDD). The discrepancy may be due to the various clinical presentations of MDD patients, and interindividual variability in the patterns of functional connections between brain regions also existed in the Table 3Talairach Coordinates and Z-scores of areas with rCBF changes in MDD patients
Number of clusters
Co-ordinates Region Z-score
(PFWE-corr< 0.05)
X Y Z
INC: 2 -32 -80 -10 left occipital lobe (B17、B18、B19、B37) 5.91
-8 -82 -8 5.43
36 -70 -14 right occipital lobe (B17、B18、B19、B37) 4.87
DEC:4 38 14 -24 right temporal lobe (B22、B38、B41、B42), right insula and right frontal lobe (B11、B44、B45、B47)
6.07
42 16 -12 5.30
46 6 -24 5.09
-32 4 -4 left insula, left frontal lobe (B11、B44、B45、B47), left temporal
lobe (B22、B38、B41、B42) andaleft anterior cingulate cortex (B24、B33)
5.30
-38 -2 -2 5.07
20 22 0 right frontal lobe (B4、B6、B10、B11、B44、B45、B46、B47), right temporal lobe (B21、B22、B38、B41、B42), right insula and
aright anterior cingulate cortex (B24、B33)
4.50
8 22 -20 right frontal lobe (B4、B6、B10、B46) 4.40
LLeft,RRight,DECThe decreased rCBF areas,INCthe increased rCBF areas,rCBFRegional cerebral blood flow,PFWE-corr p-value with FEW correction in %, FEW family-wise error
a
specific MDD symptom clusters [17,28]. The MDD pa-tients involved in our study mostly have high HAMD scores and HAMA scores with the most common com-plaints——feeling down and insomnia, and this may be the reason why the different distribution of abnormal rCBF appeared in the MDD patients of this study.
In addition, our present study revealed that among these recruited MDD patients with relatively high HAMD and HAMA scores, the depression severity was negatively correlated with decreased rCBF in left ventral anterior cingulate cortex B24, and was positively corre-lated with decreased rCBF in left inferior prefrontal
[image:6.595.57.537.87.542.2](22–59 years) is smaller than that of MDD patients (20– 72 years). Further studies are required to resolve these issues.
Conclusions
In conclusion, blood flow abnormalities were found in bilateral brain hemisphere of MDD patients with right-hemisphere dominant hypoperfused regions and a slight left- hemisphere dominance in the area of hyperperfu-sion. The depression severity was associated with de-creased rCBF in B24 and B47 of left hemisphere, and increased rCBF of right B19. The rCBF SPECT/CT may provide an objective assessment for MDD severity. And it might be used monitoring therapeutic efficacy in the management of MDD.
Abbreviations
[99mTc]ECD:[99mTc]ethylcysteinate dimer; 3D-SSP: Three-dimensional
stereotactic surface projection; ACC: Anterior cingulate cortex; B: Brodmann areas; CT: Computed tomography; DMN: Default mode network; DSM-IV: The fourth edition of the Diagnostic and Statistical Manual of Mental Disorders; eZIS: easy Z score imaging system; HAMA: Hamilton Rating Scale for Anxiety; HAMD: Hamilton Rating Scale for Depression; HUST: Huazhong University of Science and Technology; ICD-10: The 10th revision of International Statistical Classification of Diseases and Related Health Problems; MDD: Major depressive disorder; mPFC: Medial prefrontal cortex; MRI: Magnetic resonance imaging; PET: Positron emission tomography; rCBF: Regional cerebral blood flow; ROIs: Regions of interest; SPECT: Single photon emission computed tomography; UI: Uptake index
Acknowledgements
We thank Dr. Xiaofan Zhang and Dr. Wei Zou (Department of Neurology, Tongji Hospital, Tongji Medical College, HUST), Mr. Jian Hu and Mr. Jian Zhou (Department of Nuclear Medicine, Tongji Hospital, Tongji Medical College, HUST), for assistance in data collection.
Funding Not applicable.
Availability of data and materials
The datasets used and/or analysed during the current study are available from the corresponding author on reasonable request.
Authors’contributions
CJ and YY conceived and designed the experiments. LJM, YY and CJ were major contributors in writing the manuscript. YY and CJ analyzed and interpreted the MDD patient clinical data. LJM, ZYK, CJ, CZT and SYX analyzed and interpreted the imaging data. LJM, ZLQ, HYF, ZGP and YT contributed to acquisition imaging data. All authors read and approved the final manuscript.
Ethics approval and consent to participate
This study was approved by Ethical Committee of Tongji Hospital, Tongji Medical College, Huazhong University of Science and Technology (Permit Number: TJ-C20141220). All subjects received a detailed description of the study and gave written informed consent.
Consent for publication Not applicable.
Competing interests
The authors declare that they have no competing interests.
Publisher’s Note
Springer Nature remains neutral with regard to jurisdictional claims in published maps and institutional affiliations.
Author details
1Department of Nuclear Medicine, Tongji Hospital, Tongji Medical College,
Huazhong University of Science and Technology, Wuhan, Hubei Province 430030, China.2Department of Nuclear Medicine, Renmin Hospital of Wuhan University, Wuhan, Hubei Province 430060, China.3Department of Neurology,
Tongji Hospital, Tongji Medical College, Huazhong University of Science and Technology, Wuhan, Hubei Province 430030, China.
Received: 9 October 2017 Accepted: 8 March 2018
References
1. Belmaker RH, Agam G. Major depressive disorder. N Engl J Med. 2008;358(1): 55–68.
2. Alimohammadi AM, Mehrpisheh S, Memarian A. Epidemiology of Cases of Suicide due to Hanging who Referred to Forensic Center of Shahriar in 2011. International Journal of Medical Toxicology & Forensic Medicine. 2013; 3(4):121–125.
3. Andrews G, Slade T, Peters L. Classification in psychiatry: ICD-10 versus DSM-IV. Br J Psychiatry. 1999;174:3–5.
4. Maske UE, Buttery AK, Beesdo-Baum K, Riedel-Heller S, Hapke U, Prevalence BMA. Correlates of DSM-IV-TR major depressive disorder, self-reported diagnosed depression and current depressive symptoms among adults in Germany. J Affect Disord. 2016;190:167–77.
5. McGrath CL, Kelley ME, Holtzheimer PE, Dunlop BW, Craighead WE, Franco AR, Craddock RC, Mayberg HS. Toward a neuroimaging treatment selection biomarker for major depressive disorder. JAMA Psychiatry. 2013;70(8):821–9. 6. Zhang K, Zhu Y, Wu S, Liu H, Zhang W, Xu C, Zhang H, Hayashi T, Tian M.
Molecular, functional, and structural imaging of major depressive disorder. Neurosci Bull. 2016;32(3):273–85.
7. Lener MS, Iosifescu DV. In pursuit of neuroimaging biomarkers to guide treatment selection in major depressive disorder: a review of the literature. Ann N Y Acad Sci. 2015;1344:50–65.
8. Kerestes R, Davey CG, Stephanou K, Whittle S, Harrison BJ. Functional brain imaging studies of youth depression: a systematic review. Neuroimage Clin. 2014;4:209–31.
9. Nagafusa Y, Okamoto N, Sakamoto K, Yamashita F, Kawaguchi A, Higuchi T, Matsuda H. Assessment of cerebral blood flow findings using 99mTc-ECD single-photon emission computed tomography in patients diagnosed with major depressive disorder. J Affect Disord. 2012;140(3):296–9.
10. Banas A, Lass P, Straniewska D. Single photon emission computed tomography (SPECT) for the diagnosis of depressive disorders, neurotic and eating disorders. Psychiatr Pol. 2005;39(3):497–507.
11. Hu S-Y, Shi G-Q, S-e W, Qiu J. Changes in regional cerebral blood flow with Chaihu-Shugan-San in the treatment of major depression. Pharmacognosy Magazine. 2014;10(40):503.
12. Brockmann H, Zobel A, Joe A, Biermann K, Scheef L, Schuhmacher A, von Widdern O, Metten M, Biersack HJ, Maier W, et al. The value of HMPAO SPECT in predicting treatment response to citalopram in patients with major depression. Psychiatry Res. 2009;173(2):107–12.
13. Oda K, Okubo Y, Ishida R, Murata Y, Ohta K, Matsuda T, Matsushima E, Ichimiya T, Suhara T, Shibuya H, et al. Regional cerebral blood flow in depressed patients with white matter magnetic resonance hyperintensity. Biol Psychiatry. 2003;53(2):150–6.
14. Navarro Vc GC, Lomeña F, Mateos JJ, Marcos T. Frontal cerebral perfusion dysfunction in elderly late-onset major depression assessed by 99MTC-HMPAO Spect. NeuroImage. 2001;14(1):202–5.
15. Watanabe M, Umezaki Y, Miura A, Shinohara Y, Yoshikawa T, Sakuma T, Shitano C, Katagiri A, Takenoshita M, Toriihara A, et al. Comparison of cerebral blood flow in oral somatic delusion in patients with and without a history of depression: a comparative case series. BMC Psychiatry. 2015;15(1):42.
16. Takahashi S, Ukai S, Tsuji T, Kose A, Shoyama M, Yamamoto M, Okumura M, Shinosaki K. Cerebral blood flow in the subgenual anterior cingulate cortex and modulation of the mood-regulatory networks in a successful rTMS treatment for major depressive disorder. Neurocase. 2013;19(3):262–7. 17. Périco CA-M, Skaf CR, Yamada A, Duran F, Buchpiguel CA, Castro CC, Soares
18. GBoDS C. Global, regional, and national incidence, prevalence, and years lived with disability for 301 acute and chronic diseases and injuries in 188 countries, 1990-2013: a systematic analysis for the global burden of disease study 2013. Lancet. 2015;386(9995):743–800.
19. Ménard C, Hodes GE, Russo SJ. Pathogenesis of depression: insights from human and rodent studies. Neuroscience. 2016;321:138–62.
20. Matthews SC, Nelesen RA, Dimsdale JE. Depressive symptoms are associated with increased systemic vascular resistance to stress. Psychosom Med. 2005; 67(4):509–13.
21. Monteggia LM, Malenka RC, Depression DK. The best way forward. Nature. 2014;515(7526):200–1.
22. Chi KF, Korgaonkar M, Grieve SM. Imaging predictors of remission to anti-depressant medications in major depressive disorder. J Affect Disord. 2015; 186:134–44.
23. Parker G, Brotchie H. Gender differences in depression. Int Rev Psychiatry. 2010;22(5):429–36.
24. Onishi H, Matsutake Y, Matsutomo N, Kai Y, Amijima H. Effect of prefiltering cutoff frequency and scatter and attenuation corrections during normal database creation for statistical imaging analysis of the brain. J Nucl Med Technol. 2011;39(3):231–6.
25. Onishi H, Matsutake Y, Kawashima H, Matsutomo N, Amijima H. Comparative study of anatomical normalization errors in SPM and 3D-SSP using digital brain phantom. Ann Nucl Med. 2011;25(1):59–67.
26. Shad MU, Muddasani S, Rao U. Gray matter differences between healthy and depressed adolescents: a voxel-based morphometry study. J Child Adolesc Psychopharmacol. 2012;22(3):190–7.
27. Tomasi D, Wang GJ, Volkow ND. Energetic cost of brain functional connectivity. Proc Natl Acad Sci U S A. 2013;110(33):13642–7. 28. Finn ES, Shen X, Scheinost D, Rosenberg MD, Huang J, Chun MM,
Papademetris X, Constable RT. Functional connectome fingerprinting: identifying individuals using patterns of brain connectivity. Nat Neurosci. 2015;18(11):1664–71.
29. Neuropsychological GGM. Neuroimaging evidence for the involvement of the frontal lobes in depression: 20 years on. J Psychopharmacol. 2016;30(11): 1090–4.
30. Gardner AÅD, Öberg J, Jacobsson H, Jonsson C, Larsson S, Pagani M. Towards mapping the brain connectome in depression: functional connectivity by perfusion SPECT. Psychiatry Res. 2014;223(2):171–7. 31. Li J. Xu C, Cao X, Gao Q, Wang Y, Wang Y, Peng J, Zhang K. Abnormal
activation of the occipital lobes during emotion picture processing in major depressive disorder patients. Neural Regen Res. 2013;8(18):1693–701.
• We accept pre-submission inquiries
• Our selector tool helps you to find the most relevant journal
• We provide round the clock customer support
• Convenient online submission
• Thorough peer review
• Inclusion in PubMed and all major indexing services
• Maximum visibility for your research
Submit your manuscript at www.biomedcentral.com/submit