2017 2nd International Conference on Artificial Intelligence and Engineering Applications (AIEA 2017)
ISBN: 978-1-60595-485-1
Traffic Video Vehicle Shadow Elimination Algorithm
Based on Principal Component Analysis
JIAO WANG, JIAPENG HAN, ERQUAN LIU and ZHAOHUI FAN
ABSTRACT
In order to eliminate the shadows in vehicle detection, the accuracy of traffic monitoring is improved. In this text, the foreground object is extracted by background subtraction method. The orientation of the shadow region is determined by the PCA, which can reduce the complexity of algorithm. The shadow area is similar to background to weaken shadow. The foreground is extracted again by the same method after weaken shadow. The shadow area is transformed into the background and separated from the moving object. The experimental results show the average value of three groups video of comprehensive indexes is obtained that the algorithm is improved by 10.3% and 13.3% compared with the color and edge based shadow elimination algorithm. Thus, the shadow detection and elimination algorithm work well and the performance is reliable.
KEYWORDS
Vehicle detection, PCA algorithm, shadow elimination, weaken shadow.
INTRODUCTION
At present, vehicle detection has become a hot spot in the field of Intelligent Transportation Research. Due to the influence of light and self-shielding, it has a negative impact on vehicle detection. Therefore, many scholars at home and abroad have proposed a variety of ways to eliminate vehicle shadows. Chen W J et al [1] combined the shadow geometry model to locate the boundary with the body to eliminate the shadow. Qiu Y C et al [2] proposed an algorithm based on color features and edge features to achieve the goal of shadow elimination.
In this paper, the foreground object is extracted by background subtraction method. The orientation of the shadow region is determined by the PCA, which can reduce the complexity of algorithm. The shadow area is similar to background to weaken shadow. The foreground is extracted again by the same method after weaken shadow. The shadow area is transformed into background and separated from the moving object.
_________________________________________
VEHICLE SHADOW ELIMINATION ALGORITHM BASED ON PCA
In this article, based on the brightness linear attenuation characteristics and texture features, the shadow region is transformed into similar distribution in the background region, shadows can be eliminated.
PCA Algorithm to Analyze the Shadow Area Direction
If the shadow region is detected in eight directions, computational redundancy will be undoubtedly left. In order to reduce the search space of the shadow area, the principal component analysis is used to determine the direction of the shadow region. PCA is a kind of orthogonal linear transform algorithm to convert the data to a new coordinate system. By data specific mapping, the maximum variance of the data is projected as the first coordinate (1st), next variance of the data is the second coordinate (2nd). And so on, the PCA algorithm maximizes the similarity and diversity between the data in this way. Based on this algorithm, the direction of the search shadow region is limited to the 1st and 2nd directions. Compared to the previous eight directions, the computational burden is reduced by 3/4.
In order to determine the final direction of the shadow area, a step-by-step method is adopted in this paper.
1) The initial 1st and 2nd coordinate axes are determined by averaging five consecutive frames of images.
2) Monitor the angle of the 1st and 2nd coordinate changes in the subsequent image and compare it with the initial axis.
3) If the change angle is greater than the set threshold N, then the shadow region
will be detected from the 2nd main axis; otherwise, the 1st principal axis is detected. Experimental results show that when N is 8, the shadow direction detection results
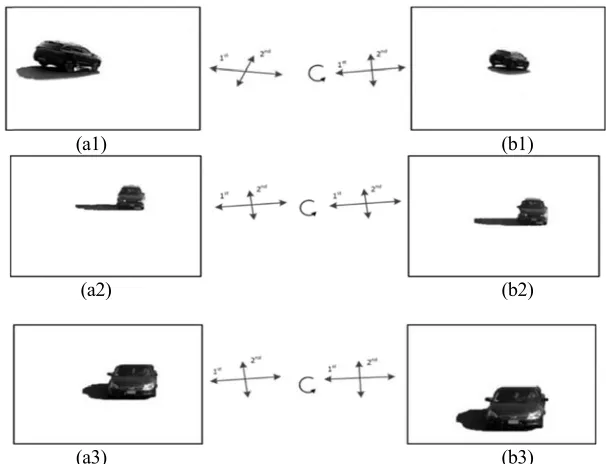
are more in line with the actual situation. The PCA analysis determines the direction of the shadow area, as shown in Fig.1.
(a1) (b1)
(a2) (b2)
[image:2.612.145.448.463.695.2](a3) (b3)
The graph shows three different sets of data, using this method to detect the validity of the shadow direction. The axis varies in the direction of the arrow. In the first data set (Fig.1(a1), (b1) ), the calculated coordinate axis of subsequent frame axis is compared with the initial coordinate axis, the change angle is greater than the threshold
N, the direction of detection should be changed from 1st to 2nd. The second and third
data (Fig.1 (a2), (b2) and Fig.1 (a3), (b3)) sets are similar to the first data set. The change angle of the coordinate axis is very small, which is lower than the threshold value N. The vast majority of shadows in the two data sets are observed on the 1st
coordinate axis, which is validated the effectiveness of the proposed shading direction algorithm in this article.
Build Shadow Area Weakening Model
This text makes full use of the color distribution information of the shadow area and the background area, weaken the shadow area so that it is similar to the background. That can separate from the moving object.
[image:3.612.109.491.392.547.2]In order to weaken the shadow, need to analyze characteristics of shadow and its corresponding background area. First, a traffic detection video containing shading regions is taken as a sample. Then, a shadow region is determined from image sequence, and find the image corresponding to background area without shadow. Last, calculate each region three RGB channel histogram. R, G, and B three channel histograms of no shadow areas are shown in Fig. 2.
Figure 2. At top, the histograms for each R, G and B channel of the region without shadows. At bottom, the histograms for R, G and B channel of the shadowed region.
The experiment can be obtained that intensity of shadow area is lower than that of the background area, but the gray value is more concentrated. According to the characteristics of histogram, this text determines the shadow area by calculating the average value and variance of R, G, and B three channel pixels in the region.
In the shadow region, the three channels of R, G, and B are darkened and the scatter
gray values of the corresponding region when it is bright. Extend the histogram so that it has the same variance as the corresponding background image. Therefore, there is a corresponding contrast rate, which can weaken the shadow area and make it similar to the corresponding background color distribution.
Brightness distribution contrast describes bright and dark spots in the image with different intensity. In an image, contrast can be calculated by Eq. (1).
2 1
0 1
0( (, ) )
1
N i Mj Ii j Imoy M
N
C (1)
Where N, M are the pixel value of the input image,I(i, j)is the brightness value of
the coordinate value(i, j),Imoyis the brightness mean of the whole image.
In order to calculate the contrast, a shadow area is first determined. Using the RGB color space, the contrast between the shadow region and its corresponding background area on each channel is calculated.
2 1
0 1
0
(
(
,
)
)
1
N i Mj K moy
K
J
i
j
I
M
N
C
(2)WhereK {R,G,B},JK(i, j)is the brightness value of the point whose coordinates
are(i, j),Imoyis the mean of the coordinates of(i, j)points on the K channel, N and M
are the pixel value of the area. In the same way, calculate the contrast of the shadow area on each color channel. Based on formula, the ratiocofkof both of them can be
calculated.
Ksh K
k C C
cof / (3)
WhereCKshis the contrast of the shadow area? Then the color component of the
foreground region shadow can be changed by the following equation.
F R R Cof
R (4)
F G G Cof
G (5)
F B B Cof
B (6)
WhereRF ,GFand BF are respectively extracted from the luminance values of
moving targets on R, G and B channels. Applying this coefficient to extracted shaded
foreground images, the difference between the shadow and the background is small, which can remove the shadow.
ALGORITHM VERIFICATION AND EVALUATION
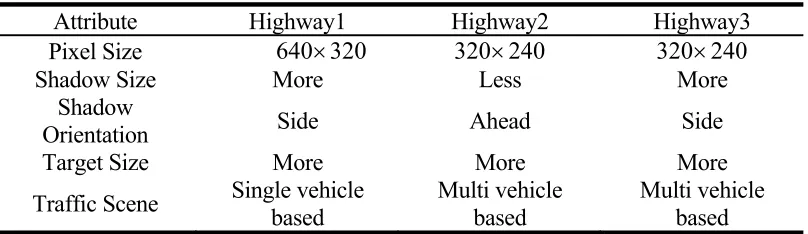
MATLAB Video Toolbox, Highway2 and Highway3 are taken from ChangeDetection2014 data sets. The detailed properties of the image sequence are shown in Table 1. In the PCA analysis algorithm, the value of parameter N is 8. The
[image:5.612.98.502.167.284.2]experimental environment of the algorithm is MATLAB2016a, and PC is configured as Intel Core, i5CPU, 8.0GB, RAM.
TABLE 1. TABLE OF IMAGE SEQUENCE ATTRIBUTE.
Attribute Highway1 Highway2 Highway3
Pixel Size 640320 320240 320240
Shadow Size More Less More
Shadow
Orientation Side Ahead Side
Target Size More More More
Traffic Scene Single vehicle based Multi vehicle based Multi vehicle based
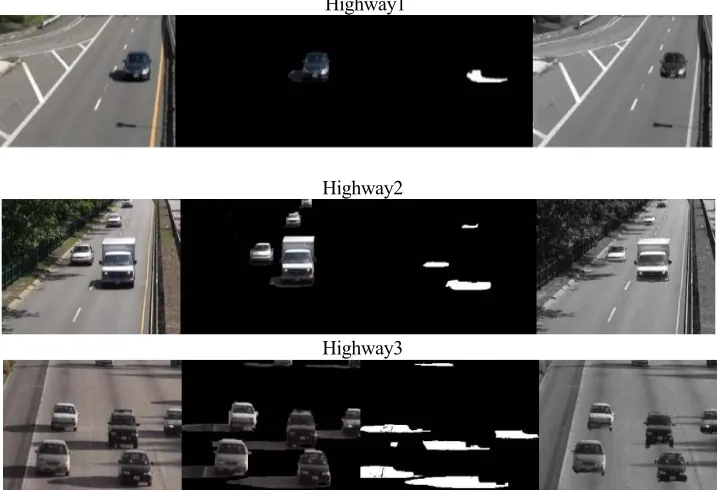
The validity of the algorithm is tested by Table 1 image sequences, and the experimental results of different image sequences are shown in Fig.3.
From the experimental results of the Highway1 image sequence in Fig.3, we can see that the image sequence is mostly single vehicle, the shadow area detection and attenuation are not affected by white lane, and the moving vehicle is kept intact.
From the experimental results of the Highway2 image sequence in Fig.3, we can see that the shadow area is small in the image, trees along the road lead to shadow in the background image itself. On the whole, the shadow detection and attenuation effect is good, and the vehicle shape acquisition is more complete.
From the experimental results of the Highway3 image sequence in Fig.3, we can see that there are many vehicles in the image, and there is shadow overlap with the vehicle. Part of the road color is similar to the shadow color, which makes it difficult to detect shadows.
Highway1
Highway2
Highway3
[image:6.612.116.475.72.317.2](a) Input image (b) Foreground extraction (c) Shadow detection (d) Shadow segmentation Figure 3. Experiment results of different image sequence.
In order to evaluate the validity and rationality of the algorithm in an accurate and objective way, in this text, two representative color and edge features are selected to compare with the proposed algorithm, the statistical code for the performance of the algorithm comes from the ChangeDetection2014 data sets. Compare the performance of the algorithm by using the evaluation index in the literature [4] and the average of the two, shadow detection rate , Shadow resolutionand composite index are defined as follows:
S S
S
FN TP
TP
(7)
F F
F FN TP
TP
(8)
2 )
(
(9)
Where S is shadow in Eq. (7), F is foreground in Eq. (8).TPS is the number of
shadow pixels to be correctly identified,FNSis the number of shadow pixels not to be
correctly identified,TPFis the number of pixels in the foreground of a vehicle to be
correctly identified,FNFis the number of pixels in the foreground of a vehicle not to be
correctly identified,TPF is that the total number of pixels in the foreground of a vehicle
The performance evaluation results of the three algorithms are shown in Table 2. The experimental results show that the comprehensive index of this algorithm is obviously higher than the other two algorithms. The average value of the three sets of video comprehensive indexes is obtained that the algorithm has improved by 10.3% compared with the color based shadow elimination algorithm, compared with the edge based shadow elimination algorithm, the proposed method has improved by 13.3%. The results of shadow detection and elimination are satisfactory and the algorithm performance is reliable.
TABLE 2. APPRAISAL RESULT OF THREE ALGORITHMS/%.
Algorithm Highway1 Highway2 Highway3
Color
Feature 96.11 69.37 82.74 94.16 63.47 78.82 97.71 60.17 78.94
Edge
Feature 61.60 97.45 79.53 56.53 93.59 75.16 62.72 96.22 79.47
Paper
Algorithm 91.15 93.08 92.12 80.24 92.17 86.21 86.64 87.39 87.02
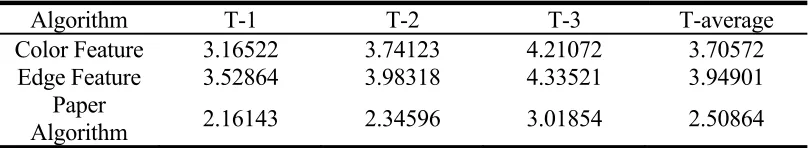
TABLE 3. APPRAISAL RESULT OF THREE ALGORITHMS/MS.
Algorithm T-1 T-2 T-3 T-average
Color Feature 3.16522 3.74123 4.21072 3.70572
Edge Feature 3.52864 3.98318 4.33521 3.94901
Paper
Algorithm 2.16143 2.34596 3.01854 2.50864
In order to verify the computational efficiency of the algorithm, in this article, three algorithms are used to calculate the three sets of experimental videos. The computational efficiency of the three algorithms is shown in Table 3. T-1/MS, T-2/MS and T-3/MS time spend on video Highway1, Highway2 and Highway3. T-average/MS averages the time between three groups of videos for an algorithm. The experimental results show that this algorithm has great advantages in computational efficiency, and the PCA analysis method reduces the complexity of the algorithm.
SUMMARY
[image:7.612.96.501.356.430.2]comprehensive indexes is obtained that the algorithm is improved by 10.3% and 13.3% compared with the color and edge based shadow elimination algorithm. Thus, the shadow detection and elimination algorithm work well and the performance is reliable.
REFERENCES
1. Chen W.J.,Wang M.Y. Eliminate Algorithm of Vehicle Shadow [J]. Jisuanji Yu Xiandaihua. (2011) No. 09, p. 30-32.
2. Qiu Y.C., Zhang Y.Y., Liu C.M. Vehicle shadow removal with multi-feature fusion [J]. Journal of Image and Graphics. Vol. 20(2015) No. 03, p. 0311-0319.
3. Zhao J., YiF L., Lin X.H. Moving Objects Detection Based on Gaussian Models with HSV [J]. Applied Mechanics &Materials, (2013), p. 333-335: 1020-1023.