2018 International Conference on Modeling, Simulation and Optimization (MSO 2018) ISBN: 978-1-60595-542-1
Modeling and Simulation of Regional Industrial Clusters Under the
Mechanism of Competing Interaction Based on MAS
Mei-xia WU
1, Zhi-qing ZHANG
1,2and Shi-zhi WANG
1,*1College of Management, Wuhan University of Science and Technology, Wuhan, 430081, China
2Center for Service Science and Engineering, Wuhan University of Science and Technology,
Wuhan, 430081, China *Corresponding author
Keywords: MAS, Regional industrial cluster, Evolution path of enterprises clusters.
Abstract. In this paper, the MAS modeling theory is applied to the modeling of regional industrial clusters, and the cooperative profit model and scale development model of the enterprises under competitive cooperation mechanism are established. According to the characteristics of enterprise collaborative cooperation, the collaborative cooperation rules and movement rules of enterprise agents are established to research the impact of space resources and business growth rate on regional industrial clusters, and use Repast platform to simulate the evolution path of enterprise clusters. The experimental results show that when developing regional economy, the government should make full use of the advantages brought by industrial clusters and adopt different measures in different stages of regional economic development so as to guide the regional economy to maintain a sustained and healthy development.
Introduction
In recent years, much attention has been paid to the principled research and practice on industrial agglomeration[1,2]. Industrial cluster theory is the result of continuous development of industrial
agglomeration theory, that is, the new theory of industrial agglomeration. Scholars have defined industrial clusters from the perspectives of culture, government, system and so on, and summarized the relevant conclusions[3-5]. Based on the research of foreign scholars, the domestic scholars have
studied the formation mechanism and the related causes of industrial agglomeration in our country, and discussed the influence of agglomeration on the regional economy in our country, given some rational suggestions on how to take the advantage of industry agglomeration to improve the regional economic development[6-9]. The research on the evolutionary process of industrial agglomeration, at
home and abroad, is mostly based on theoretical analysis and lack of quantitative interpretation and analysis. The evaluation of industrial agglomeration is mostly based on a single indicator, which is not comprehensive enough.
Coordinated Evolutionary Model of Regional Industrial Cluster Based on MAS Theory
Principles and Ideas of Modeling
In the market economy environment, competition and cooperation co-exist between enterprises. Within a certain time and space, under the premise of limited resources, enterprises compete with each other to increase their market share, meanwhile, enterprises are required to cooperate with other enterprises in order to promote the development of the industry for long-term benefits. During competition and cooperation, enterprises have complex interactions between the external environment and other enterprises, which form a dynamic and complex system. MAS is autonomous, intelligent and collaborative, which provides a good method to simulate the industrial agglomeration.
Coordinated Evolutionary Model
The interaction between competition and cooperation drives the enterprises toward agglomeration, enabling enterprises to obtain long-term cooperation and their own benefits. Like the life cycle of an industry, the life cycle of an enterprise is a sigma curve like S-curve, which grows to its peak and then reaches a near-steady state. Therefore, according to the cooperative relationship among cluster enterprises, the logistic growth model can be constructed to describe the self-organization evolution of cluster cooperative competition system.
Assumptions of the model are as follows. ① Suppose that the number of enterprises in the cluster is n, each period of enterprise growth scale is xi(t); ② Assuming that the enterprise ri only achieves
its internal growth rate by its own ability under the constraints of the limited resources (and does not consider the stagnation or regression of the firm's growth when it does not reach the maximum production scale);③ ki represents the largest enterprise that can grow under the constraints of the
scarcity of economic resources; ④ aij is Co-operation coefficient, indicates the impact of one
enterprise on the other in the cooperation,(1aij 1).
Co-existence between enterprises, that is, enterprises coordinate and learn from each other. In the process of enterprises learning, learning outcomes are affected by the distance of them. Therefore, the cooperation effect between two enterprises decreases with the increase of spatial distance between them. the following formula shows the effect of the two enterprises' cooperation process.
ij b ij
ij l d e
a (1)
Where l is influence factor of co-operation effect coefficient,b is influence factor of distance
between i and j on the enterprises’ cooperative income ,dij is the distance between i and j,eij is the
impact of the cooperation success rate between two enterprises on this cooperation. Assume that ijis the positive probability of return of enterprise i ,when it cooperate with enterprise j, where ijis the
ratio of the number of successful cooperation and the total number of cooperation, and ij
0,1 .ifij
, randomly generated, is not less thaneij,there is eij=ij-1.otherwise, eij =ij.
Under the above assumptions, the development of the enterprises follows the Sigma curve and is described by the logistic model. When an enterprise faces the market independently, the size of the enterprise in the period t is expressed by the following formula:
i i i i i k t x t x t r dt t
dx ( )
1 ) ( ) ( ) ( (2)
j j ij i i i i i k t x a k t x t x t r dt tdx ( ) ( )
1 ) ( ) ( ) ( (3)
In line with the two formulas above, during the collaboration period t, the enterprises’ profit isF
xi
t
and the formula can be given as follows.
j j j ij i i i k t x a t x t r t xF ( ) () (4)
Behavior Rules of Enterprises Agents and Program Flow
Cooperation Rules of Agents. On the one hand, historical-cooperation rate between enterprises will affect the success rate of their re-cooperation. In the cooperation process, cooperation is considered as successful if it is beneficial to one side. On the other hand, the distance between enterprises affects the possibility of cooperation. The closer the distance is, the greater the chance of cooperation is.
According to the distance matrix between enterprises and the historical cooperation success rate, the cooperation network between enterprises can be constructed with the following steps.
Step.1: assume that the initial network contains n nodes, the distance matrix between each node is
D, where the maximum distance is dMax, and the current number of cooperation is m.
Step.2: in the cooperation matrix C, for any agent node i and j, the cooperative-relationship
distance between them iscij, and cij dMaxdij.
Step.3: normalize cooperative-relationship distance between agent nodes. the normalized result is
1 1 1 1 0
n j j i ij c .Step.4: generate a random number r, if there is cij rcij1, then, Judge whether the current
enterprise i and enterprise j can reach a cooperation agreement. If there is no edge between the node
iand node j and the probability of successful historical cooperation between the enterprise i and the
enterprise j is greater than the probability of cooperation failure, an edge is added between the node
iand the nodej.
Step.5: Repeat Step.4, until there are m edges in the network.
Movement Rules of Agents. Agents in the environment move constantly in the constructed virtual space. The Enterprise Agent constantly updates relevant information such as cooperative benefits and updates its location in time. The moving behavior of the Agent is similar to the PSO algorithm, specific movement rules are as follows.
Step.1: initialize, set the learning factor of Agent to c1 and c2, generate each particle displacement
change randomly, as
v1,v2,,vn
.Step.2: calculate the fitness of each particle, represented byF
xi
t
. According to the above,
x t
F i Expresses the current cooperation revenue the ith agent.
Step.3: compare the current fitnessF
xi
t
with the best value of their own history pbest.If
x t
F i is better thanpbest, then assignF
xi
t
to pbest, Simultaneously, update the coordinatesof pbest as
pbestx,pbesty
.Step.4: The velocity of the particle is updated according to the following two equations, resulting in a new position of next period.
t c v
t c
pbest
t P
t
c
gbest
t P
t
vi 1 0 i 1 i i 2 i , Pi
t1 Pi
t vi
t1Wherec0, c1 and c2 are learning factors of the enterprises, c0is a random number between 0 and
operating cycle: 0 (0.950.2)0.2
t
c . Pi
t is the enterprises’ location matrix in the period t. vi
tis enterprises’ displacement change matrix, randomly generated at the beginning.
Program Flow. According to the rules above, the implementation of the program are designed as follows.
Step.1: calculate the distance and cooperation probability between business nodes.
Step.2: compare the operating cycle and the commissioning cycle. If the operating cycle is greater
than the commissioning cycle, execute Step.3; otherwise, proceed to Step.4.
Step.3: calculate the cooperation of enterprise nodes, update the success rate of cooperation
between enterprises, and then proceed to Step.2.
Step.4: judge whether there is a cooperation relationship between enterprises. If yes, go to Step.5;
otherwise, go to Step.6.
Step.5: calculate the cooperation profit and the growth scale of enterprises, update the success rate
of cooperation between enterprises, then update the location of enterprise nodes, and perform Step.7. Step.6: calculate the growth size of enterprise nodes, and then perform Step.7.
Step.7:assess network aggregation degree, and determine whether to achieve the maximum
operating cycle. If so, the procedure is over; otherwise, back to Step.1.
Model Simulation
Evolution Path of Industrial Cluster
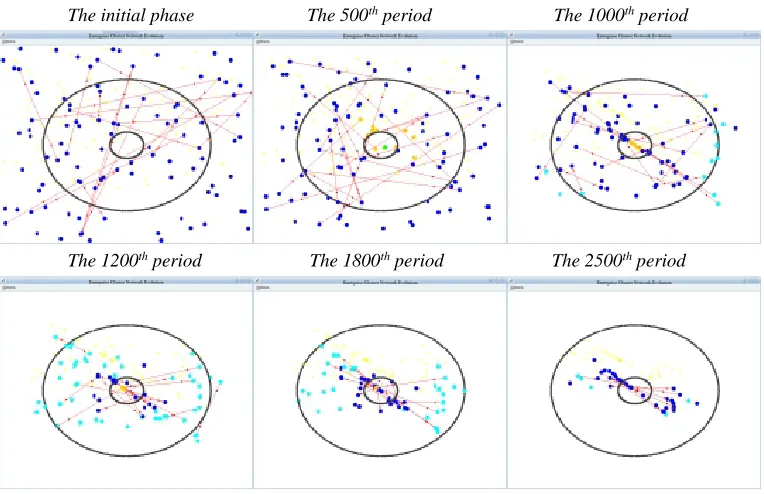
In this experiment, the number of firms is 150, the clustering threshold is 60, the degree of enterprises cooperation is 0.2. Based on the above models and rules, the Repast platform is used to simulate the evolution path of industrial clusters under the limited maximum growth size of enterprises and the different growth rate of enterprises respectively.
The initial phase The 500th period The 1000th period
[image:5.612.116.498.65.312.2]The 1200th period The 1800th period The 2500th period
Figure 1. Evolutionary cluster diagram in the space of a uniform distribution of resources.
Afterwards, test how the growth rate of the enterprise cluster affect the evolution of enterprises clustering. In the virtual space, the closer the enterprise node is to the center, the better resources the enterprise possess, and the greater the growth rate it has. As the simulated result showed in Figure 2, nodes with higher growth rate can find the central area that needs to be gathered faster, that is, the high-resource zone. At the same time, some enterprises with low growth rates can expand its size by coordination with other enterprises, and find the cluster center faster.
The initial phase The 400th period The 800th period
[image:5.612.115.499.413.658.2]The 1000th period The 1600th period The 2000th period
Figure 2. Evolutionary cluster diagram in the changing growth rate of enterprises.
Visual Evaluation of Clusters
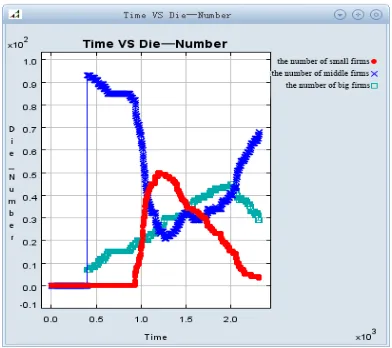
Figure 3. The classification statistics of the type of enterprises size.
As is showed in Figure 3, some middle enterprises gradually transform into big enterprises at the beginning. From a certain point, the big enterprises, middle enterprises and small enterprises transformed each other. Finally, when the cluster developed to a certain scale, the number of high-scale enterprises and the number of lower-scale enterprises drop while that of medium-sized enterprises gradually increases. That is because, in the space of resources unevenly distributed, the middle enterprises relocate to high-spatial-belt areas in order to obtain better opportunities for development and then expand their sizes. The benefits of cooperation result in the evolutionary effects of clustering. Clustering make the difference of enterprises in space increase. However, after the evolution of the enterprise clustering to a certain extent, resources are acquired by all enterprises , clustering leads to the close distance between enterprises, the stable success rate of cooperation, and the stable cooperation effects, which makes the enterprises begin to converge.
Summary
By analyzing the results of the evolutionary path of industrial clusters, some conclusions and suggestion can bei given as follows.
(1) Enterprises tend to gather around high-resource zones and high-scale businesses. Therefore, the urban area can develop the local economy by convenient political measures and perfect public infrastructures to attract enterprises and form an economic development zone. At the same time, the government can introduce some large-scale enterprises in the newly-built Economic Development Zone to promote the cooperation among enterprises in the development zone and the development of other scale enterprises.
(2) As is known from the above conclusion, that the differences of enterprise types are too small or too large will both affect the enterprise cluster. The size of the enterprises is constantly changing and the proportion of enterprises of different sizes are constantly adjusted in the cluster process, so that the government should take reasonable measures when the proportion of enterprises in the region is unreasonable, guide the relocation of enterprises and achieve sustained and healthy development of the regional economy.
Acknowledgement
References
[1] A. Smith, An Inquiry into the Nature and Causes of the Wealth on Nations, Business Press, 1972, pp. 37-76.
[2] A. Marshall, Principles of Economics, 8th ed., Macmillan, London, 1920, pp. 402-435.
[3] J.V. Henderson, Efficiency of Resource Usage and City Size, J. Journal of Urban Economics. 19(1996) 47-70.
[4] F. Pyke, W. Sengenberger, Industrial Districts and Local Economic Regeneration, J. Geneva. (2006) 227-229.
[5] Terutomo Ozawa, The “Hidden” Side Of “Flying-Geese” Catch-Up Model: Japan's Dirigiste Institutional Set Up and Deepening Financial Morass, J. Journal of Asian Economics. 12(2001) 471-491.
[6] C.M. Zhen, R.J. Ding, Analysis on the road and internal mechanism of industrial cluster study, J. Science and Technology Management Research. 5(2007) 186-187.
[7] M.F. Zhou, J. Wei, Research on governance pattern of industrial cluster and its evolutionary process, J. Studies in Science of Science. 28(2010) 95-103.
[8] D. Wu, Construction of Regional Competitive Advantages of Industrial Cluster - Based on the Interactive Relationship Between Industrial Clusters and Regional Innovation Ability, J. Regional Economy. 2(2012) 128-131.