Title: Transition phase clothing strategies and their effect on body temperature and 100m swimming performance.
Andy Galbraith and Aimee Willmott
University of East London, School of Health, Sport and Bioscience, Water Lane, Stratford, England. E15 4LZ.
Corresponding author: Andy Galbraith
University of East London
School of Health, Sport and Bioscience Water Lane, Stratford, E15 4LZ. United Kingdom
Tel: 0208 223 3371
E-mail: [email protected]
Word count: 3796
Disclosure Statement
Abstract
Objective: Effective warm ups are attributed to several temperature related mechanisms. Strategies during the transition phase, preceding swimming competition, have been shown to prolong temperature-related warm up effects. The purpose of this study was to evaluate the effects of two different clothing strategies during the transition phase, on subsequent 100 m maximal swimming performance.
Methods: Nine competitive swimmers (3 female, 21±3 yrs; 6 male 20±2 yrs, mean performance standard 702 FINA POINTS, mean 100 m seasons best time 61.54 s) completed their own 30 minute individual pool warm up, followed by 7 minutes changing time and a 30 minute transition phase, straight into a 100 m maximal effort time trial. During the transition phase swimmers remained seated, either wearing warm or limited clothing. Swimmers returned 1 week later, where clothing conditions were alternated.
Results: Post transition phase skin and core temperature remained higher in the warm clothing condition compared to the limited clothing condition (Mean Core: 36.90±0.17°C, 36.61±0.15°C, P<0.01; Mean Skin: 33.49±0.59°C, 31.94±0.59°C, P<0.01). 100 m finish times were 0.6% faster in the warm clothing condition compared to the limited clothing condition (62.63±7.69 s, 63.00±7.75 s, P<0.01).
Conclusion: Wearing warm clothing during a 30-minute transition phase improved swimming performance by 0.6%, compared to limited clothing.
Introduction
Swimming is a highly competitive sport that reaches its pinnacle every four years at the Olympic Games. Medals are won and lost by margins as small as 0.01 s, therefore athletes and coaches are constantly looking for methods that give them an advantage over their competitors (Pyne, Trewin, and Hopkins, 2004). Warm up routines preceding physical activity are commonly used to aid performance. When designed well, they can prime and prepare an athlete both mentally and physically to optimise performance (Taylor, Sheppard, and Plummer, 2009). Body movement during warm up increases muscle temperature, reduces muscle stiffness, improves contractile performance and readies skeletal muscles for exercise (Kilduff et al., 2013; McGowan et al., 2015). Optimal body temperature prior to swimming enables faster reaction times, which are crucial in sprint swimming, where fast reaction times equate to 30% of overall race speed (McGowan et al., 2016).
In sporting environments there is usually a period of time, called the transition phase, that follows the end of the warm up and precedes the start of competition (Kilduff et al., 2013). During this phase studies have reported drops in core and muscle temperature. For example, West et al (2013) reported that by 20 minutes post-warm-up, 40% of the rise in core temperature, gained via the warm-up, had been lost. Faulkner et al (2012) report similar findings for muscle temperature, detailing ~1.2°C drop in muscle temperature 30-minutes post-warm-up, which equated to a loss of ~45% of the muscle temperature gain afforded by the warm-up. A short transition phase is therefore important in order to maintain the effects of the warm up. A 5 minute transition between warm up and exercise performance did not result in a decrease in core temperature or impact subsequent exercise performance in the work of Frikha et al. (2016), however significant temperature drops have been highlighted 15 minutes post warm up (McGowan et al., 2017). A transition phase of 10 minutes has previously resulted in a 1.4% improvement in 200 m swim time, compared to a 45 min phase (Zachowski, Johnson, and Sleivert, 2007).
(FINA, 2015a; McGowan et al., 2015). Transition phase strategies may therefore offer an opportunity for athletes to gain an advantage over their competitors, by maintaining muscle and body temperature and maximising the benefits from the warm up. The use of heated garments worn in a land-based warm up, during a transition phase, has been shown to result in significantly higher core temperatures and 0.8-1.3% faster 100 m swimming time (McGowan et al., 2017; McGowan et al., 2016). Furthermore Wilkins and Havenith (2017) demonstrated that the use of heated garments during a 30-minute passive recovery transition phase, attenuated the decline in skin and muscle temperature compared with a control condition, resulting in a 0.8% improvement in 50 m swimming time. Heated clothing garments may not be affordable for all swimmers, however simple clothing strategies during the transition phase may provide a suitable alternative. No study to date has compared the effects of different standard clothing strategies, during the transition phase, on the maintenance of body temperature and the impact on subsequent swimming performance.
Methods Participants
Nine swimmers from the London Aquatic Centre Performance Programme volunteered to take part in the study. All swimmers completed normal training loads, during an anaerobic phase of training and were injury free for at least 4 weeks prior to testing. Participants competed over a range of distances (Table 1), however all participants were experienced at racing over 100 m. All participants provided written informed consent for this study and study protocols were submitted to, and approved by, the University of East London, School of Health, Sport and Bioscience research ethics committee. The work described has been carried out in accordance with the Declaration of Helsinki, for experiments involving human participants.
** Table 1 **
General study design
A randomised crossover design was used, where each swimmer completed two testing sessions with different transition phase strategies (limited clothing and warm clothing). Testing was carried out on consecutive Monday evenings between 4-6pm during usual training hours, following a weekend of rest. Participants were instructed to arrive for testing in a rested and fully hydrated state, at least 3 hours post-prandial and having abstained from caffeine intake for 12 hours.
During the transition phase the limited clothing condition involved wearing a standardised club T-shirt (65% polyester, 35% cotton), while the warm clothing condition involved wearing a standardised club T-shirt (65% polyester, 35% cotton), hooded top (80% polyester, 20% cotton; fabric weight: 320gsm), trousers (65% polyester, 35% cotton), gloves (95% polyester, 5% elastane), socks, and trainers.
Measurements
Core (Ttympanic) and skin (Tskin) temperature were recorded pre warm up (PreWU), immediately post warm up (PostWU), and then again before (PreTP) and after (PostTP) the 30-minute transition phase, prior to the start of the 100 m time-trial. Thermal comfort was recorded at the start of the 30-minute transition phase, at 10 and 20 minutes into the transition phase and at end of 30-minute transition phase. Reaction time (RT), 15 m, 25 m and 50 m split times as well as overall 100 m time were recorded. Immediately following the 100 m sprint, RPE was recorded.
All warm ups and time trials were carried out at the London Aquatic Centre 50 m pool. The pools atmospheric temperature and pool water temperature were recorded immediately prior to each testing session. Mean pool water temperature was recorded at 27.3±0.3°C, while mean pool atmospheric temperature was recorded at 27.9±0.2°C.
50 and 100 m time was recorded using Omega Electronic Timing System (Omega Quantam AQ electronic timing system, Swiss Timing Ltd, Corgemont, Switzerland) operated by a certified user, and recorded to the nearest tenth. 15 m and 25 m times were recorded using a Finis Stopwatch (3X-100model), by a level 3 qualified coach. The coach also took 50 m and 100 m times as backup times. All times were recorded from the sound of the starting buzzer (StartTime IV) to the desired distances.
measured between the starting buzzer and the first movement from the swimmer leaving the blocks. The time was reported in seconds to the nearest 0.1 s
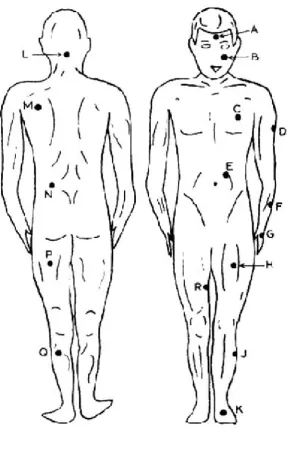
Tskin was recorded using a non-contact infrared thermometer (Thermoscan Singlie, DT-8861) at four sites of the body (Figure 1): Chest (C), Arm (D), Thigh (H) and Leg (J), in accordance with Ramanathan (1964), using markers outlined by Winslow (Mitchell and Wyndham, 1969). A 2 cm/2 cm square was drawn on each participant in permanent marker pen to standardise measuring sites, with Tskin recorded at a distance of 5 cm away from the skin surface. In a comparison with a wired lab-based system (Squirrel SQ2020 Series Data Logger, Grant Instruments, Cambridgeshire UK), the non-contact thermometer recorded values 0.19% (0.06±0.14°C) higher on average, from repeated measurements across the four sites using both devices. Core temperature (Ttympanic) was recorded via tympanic measurements, using a Braun ThermoScan ExacTemp (Braun GmbH, Kronberg, Germany). All measures were taken three times, with the mean value reported. Body temperature was calculated using the formula proposed by Burton (1935)
Mean Skin Temperature (MST) = 0.3 (C + D) + 0.2 (H + J)
Mean Body Temperature (MBT) = 0.64 (Ttympanic) + 0.36 (MST)
** Figure 1 **
Participants RPE (Borg, 1982) was recorded as soon as the 100 m swim was finished. Thermal comfort was assessed using the ASHRAE 7-point scale, in accordance with Zhang and Zhao(2008).
Statistical analysis
Statistical Analysis was carried out using SPSS software (version 22; SPSS Inc.) with significance set
at P<0.05. Data was checked for normality of distribution. Repeated measures ANOVA checked for
Results
Performance measures
There was a significant effect for clothing worn during the transition phase on all performance measures. The assumption of sphericity was violated and the Greenhouse-Geisser epsilon used (F 1.36, 10.89 = 7.09,
P=0.02, 𝜂𝜂𝑝𝑝2=0.47). Reaction time and all split times, were significantly faster after the warm clothing
transition phase, compared with the limited clothing transition phase. The warm clothing transition phase resulted in 0.59% improvement in 100 m swimming performance (62.63 ± 7.69 s vs. 63.00 ± 7.75 s; t8 = 3.97, P<0.01, d=0.1).
** Table 2 **
Thermal comfort
There was no significant difference in thermal comfort between the warm and limited clothing conditions at PreWU (0.0±0.5; 0.0±0.5), PostWU (-0.9±0.3; -0.7±0.5) or PreTP (-0.7±0.5; -0.2±0.4). Thermal comfort PostTP, was significantly higher (z = -2.70, P=0.01 d=>2.0) in the warm compared with the limited clothing condition (1.6±0.5; -1.2±0.7).
Skin and Core temperature
There was a significant effect for clothing worn during the transition phase on the temperature measures. The assumption of sphericity was violated and the Greenhouse-Geisser epsilon used (F1.84, 14.73 = 65.13,
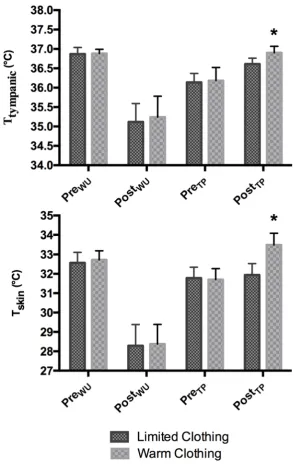
P<0.01, 𝜂𝜂𝑝𝑝2=0.89). There was no significant difference in Ttympanic and Tskin (°C) between the warm and limited clothing conditions at PreWU (Ttympanic 36.88±0.11; 36.87±0.17: Tskin 32.72±0.47; 32.57±0.54), PostWU (Ttympanic 35.24±0.54; 35.12±0.47: Tskin 28.38±1.01; 28.29±1.09) or PreTP (Ttympanic 36.18±0.34; 36.14±0.23: Tskin 31.70±0.57; 31.78±0.56). Ttympanic andTskin (°C) remained significantly higher PostTP in the warm clothing condition, compared to the limited condition (Ttympanic 36.90±0.17; 36.61±0.15, t
** Figure 2 **
RPE
Discussion
The key findings from this study were that Ttympanic, Tskin and thermal comfort, were all significantly higher PostTP in the warm clothing condition, when compared with the limited clothing condition. Consequently, participants recorded significantly faster (0.59%) 100 m swimming times in the warm clothing condition.
Body temperature begins to decline soon after the warm up ends, with notable reductions around 15 minutes post warm up (Mohr et al., 2004), therefore a short transition phase between finishing the warm up and commencing exercise performance is recommended. A short transition phase is not always possible in swimming events, where athletes must report to a call room ~15-20 minutes before the start of their scheduled race time (FINA, 2015a; McGowan et al., 2015). Consequently, strategies to maintain body temperature and extend the benefits of the warm up during the transition phase are important. The current study reveals that the quantity of clothing worn during the transition phase is an important factor in helping to reduce drops in Ttympanic and Tskin. This is the first study to report that a warm clothing strategy during the transition phase attenuates the decline in Ttympanic, Tskin and thermal comfort, resulting in a 0.59% improvement in 100 m swimming performance. Pyne et al (2004) suggest that a swimmers chance of medaling in a major competition can be markedly increased by improving performance by as little as 0.4%. The 0.6% improvement in performance offered here by a warm clothing transition phase strategy, seems a worthwhile consideration for swimmers of all abilities.
compared with a 45 minute phase. Whilst there may be a number of underlying reasons as to why a shorter a transition phase improved performance, better maintenance of body temperature during the shorter transition phase may play a key role. Further research is needed to investigate whether competitors in longer distance swimming events may also benefit from giving consideration to their transition phase clothing strategy.
the benefits of heated garments during passive recovery, reporting a 2.3°C higher skin temperature post recovery period and a 0.8% improvement in 50 m swimming performance, following the use of a heated jacket during a passive recovery transition phase, when compared with a standard tracksuit jacket. Although interestingly, no difference in core temperature post recovery period was reported between the conditions.
Land-based warm-ups alone and when combined with the use of passive heating, have previously been shown to attenuate the decline in muscle and core body temperature during a transition phase, leading to improved exercise performance (Faulkner et al., 2012; McGowan et al., 2016; McGowan et al., 2017; Wilkins and Havenith, 2017). Heated clothing garments may not be affordable for all swimmers, furthermore at national and international competitions swimmers must report to the call room ~15-20 minutes before the scheduled start of their race time (FINA, 2015a; McGowan et al., 2015). This period is not always conducive to a land-based warm-up, due to race hat and suit checks (FINA, 2015b). Therefore simple transition phase clothing strategies may be the best methods available to a number of swimmers. The current study demonstrates that adopting a warm clothing strategy, compared with a limited clothing strategy, during the transition phase, attenuates the decline in Ttympanic, Tskin and thermal comfort and results in a 0.59% improvement in 100 m swimming performance.
Practical applications
gains reported with heated garments appear to be slightly higher than those reported in the current study. For example, Wilkins and Havenith (2017) report a performance gain of 0.8% in a 50 m swim, following the use of a heated jacket during the transition phase. Thermal comfort data in the current study, demonstrated that participants did not report feelings of being too warm (+3 thermal comfort), therefore it is feasible to assume that swimmers would be comfortable enough to implement a warm clothing transition phase strategy, without feelings of thermoregulatory distress. Subjective feedback from the swimmers highlighted that in the limited clothing condition they felt as though they ‘could not get going’, which supports the faster reaction and split times, during the 100 m performance trial, seen in the warm clothing condition. All participants reported that they would implement a warm clothing strategy into their race day routines and carefully consider the clothing they wear during the transition phase. A further novel aspect of the current study, was that performance benefits were seen across the range of swimming strokes (butterfly, backstroke, breaststroke and freestyle), compared with previous research which focused on freestyle swimming (McGowan et al., 2016; McGowan et al., 2017; Wilkins and Havenith, 2017).
Pool warm-up considerations
An interesting additional finding from the current research was that Ttympanic and in particular Tskin, decreased during the pool warm-up. PostWU Ttympanic saw a decrease of 1.7°C, whilst Tskin decreased by 4.3°C from the PreWU values (Figure 2). This raises questions about the effectiveness of pool warm-ups at maintaining Ttympanic and Tskin, warranting further research into this area.
Limitations
times and their personal best times for that distance are also reflective of the fact that they fully engaged in the task.
Future research
Water temperature was shown to result in decreased Ttympanic and Tskin during the pool warm-up. Future research investigating the effects of PostTP temperature and its associated effects on backstroke swimming are recommended. Backstroke races start from the water, therefore temperature maintenance during the transition phase for these athletes may be of increased importance, to prevent further temperature drops below baseline during the time spent in the pool, prior to the start of the race. Including muscle temperature readings in future research, along with Ttympanic and Tskin, may add an additional level of detail to further advance our understanding of this topic.
Conclusion
Swimmers can be advised that combining active pool warms up with a warm clothing transition phase strategy, is a useful way to maintain warm up benefits and maximise sprint-swimming performance. A warm clothing strategy attenuated the decline in Ttympanic and Tskin during a 30 minute transition phase, improving 100 m swimming performance by 0.59% (0.37 s).
Key Findings
• An attenuated decline in Ttympanic, Tskin and thermal comfort, during a transition phase, can be achieved by simply adopting a warm clothing strategy during the transition phase.
• Where passive heating garments are not available, a warm clothing strategy during the transition phase improved 100 m swim performance by 0.59% (0.37 s).
References
Borg, G. A. V. (1982). Psychophysical Bases of Perceived Exertion. Medicine and Science in Sport. 14(5), 377-381.
Burton, A. C. (1935). Human calorimetry. 2. The average temperature of the tissues of the body. Journal of Nutrition, 9, 261-280.
Faulkner, S., Ferguson, R., Gerrett, N., Hupperets, M., Hodder, S., & Havenith, G. (2012). Reducing Muscle Temperature Drop after Warm-up Improves Sprint Cycling Performance. Medicine & Science in Sports & Exercise, 45(2), 359-365.
FINA. (2015a). Rule Code SW 3.2.5. Seeding of Heats: Semifinals and Finals. Retrieved from http://www.fina.org/sites/default/files/finaswrules_20150907.pdf
FINA. (2015b). Rule Code SW 10.8. The Race. Retrieved
from http://www.fina.org/sites/default/files/finaswrules_20150907.pdf
Frikha, M., Chaari, N., Mezghanni, N., & Souissi, N. (2016). Influence of warm-up duration and recovery interval prior to exercise on anaerobic performance. Biology of Sport, 33, 361-366.
Kilduff, L., Finn, C., Baker, J., Cook, C., & West, D. (2013). Preconditioning Strategies to enhance physical performance on the day of competition. International Journal of Sports Physiology and Performance, 8, 677-681.
McGowan, C. J., Pyne, D. B., Thompson, K. G., & Rattray, B. (2015). Warm-up strategies for sport and exercise: mechanisms and applications. Sports Medicine, 45, 1523-1546.
McGowan, C. J., Thompson, K. G., Pyne, D. B., Raglin J. S., & Rattay, B. (2016). Heated Jackets and Dryland-based Activation Exercises Used as Additional Warm-ups During Transition Enhance Sprint Swimming Performance. Journal of Sports Science and Medicine In Sport, 19, 354-358.
Mitchell, D., & Wyndham, C. (1969). Comparison of Weighting Formulas for Calculating Mean Skin Temperature. Journal of Applied Physiology, 26, 616-622.
Mohr, M., Krustrup, P., Nybo, L., Nielsen, J. J., & Bangsbo, J. (2004). Muscle temperature and sprint performance during soccer matches - Beneficial effect of re-warm-up at half-time. Scandinavian Journal of Medicine & Science in Sports, 14(3), 156-162.
Pyne, D. B., Trewin C. B., & Hopkins, W. G. (2004). Progression and Variability of Competitive Performance of Olympic Swimmers. Journal of Sports Science, 22, 613–620.
Raccuglia, M., Lloyd, A., Filingeri, D., Faulkner, S., Hodder, S., & Havenith, G. (2015). Post-warm-up muscle temperature maintenance: blood flow contribution and external heating optimisation. European Journal of Applied Physiology, 116, 395-404.
Ramanathan, N. L. (1964). A new weighting system for mean surface temperature of the human body. Journal of Applied Physiology, 19, 531-533.
Ueda, T., & Kurokawa, T. (1995). Relationships Between Perceived Exertion and Physiological Variables During Swimming. International Journal of Sports Medicine, 16(6), 385-389.
West, D. J., Dietzig, B. M., Bracken, R. M., Cunningham, D. J., Crewther, B. T., Cook, C. J., & Kilduff, L. P. (2013). Influence of post-warm-up recovery time on swim performance in international swimmers. Journal of Science and Medicine in Sport, 16(2), 172-176.
Wilkins, E. L., & Havenith, G. (2017). External heating garments used post-warm-up improve upper body power and elite sprint swimming performance. Proceedings of the Institution of Mechanical Engineers, Part P: Journal of Sports Engineering and Technology, 231(2), 91-101.
Zachowski T., Johnson E., & Sleivert G.G. (2007). Effects of Varying Post Warm-Up Recovery Time on 200-m Time-Trial Swim Performance. International Journal of Physiology Performance, 2, 201-211.
Zhang, Y., & Zhao, R. (2008). Overall thermal sensation, acceptability and comfort. Building and Environment, 43, 44-50.
Table 1.
Participant characteristics
Participant
Gender Age
(yr)
Height
(cm)
Weight
(kg)
Main Stroke Main
Distance
100m
Time*
(sec)
FINA
points
**
1
F
24
173.5
65.7
Butterfly
200/400 62.64
713
2
M
18
182.2
80.1
Breaststroke
100/200 64.81
733
3
M
18
181.5
70.8
Freestyle
100/200 50.81
786
4
F
19
175.1
62.5
Freestyle
50/100
57.68
735
5
F
20
174.0
60.6
Breaststroke
50/100
74.72
638
6
M
19
176.2
68.0
Breaststroke
50/100
64.27
739
7
M
21
181.1
72.0
Breaststroke
50/100
69.12
605
8
M
19
180.4
78.0
Freestyle
100/200 54.47
638
9
M
22
180.3
74.0
Butterfly
200/400 55.30
731
Mean
(+ SD)
20
178.3
70.2
61.5
702
* 100m times are swimmers fastest 100m swims within the last 12 months in a 50m swimming pool
**FINA points are a numerical value differing from the World Record (WR) in each event. WR = 1000 points.
Table 2. Mean (± SD) performance times (s) in the limited and warm clothing conditions.
Time Point Limited Clothing Warm Clothing Difference Effect Size (d)
RT 0.71 ± 0.06 0.69* ± 0.06 -0.02 ± 0.02 0.3
15m 8.12 ± 1.37 8.04* ± 1.39 -0.08 ± 0.07 0.1
25m 12.79 ± 1.46 12.70** ± 1.45 -0.09 ± 0.06 0.1
First 50m 29.63 ± 3.82 29.50** ± 3.80 -0.13 ± 0.10 0.03 Second 50m 33.36 ± 4.00 33.13* ± 3.94 -0.24 ± 0.26 0.1
100m 63.00 ± 7.75 62.63** ± 7.69 -0.37 ± 0.28 0.1
[image:19.595.77.532.465.644.2]Figure 2. Mean Ttympanic and Tskin across the four time points, during the warm and limited
clothing conditions. Error bars are presented as ±SD. *Significantly (P < .01) higher than limited