R E S E A R C H A R T I C L E
Open Access
Suicide rates and income in São Paulo and Brazil:
a temporal and spatial epidemiologic analysis
from 1996 to 2008
Daniel H Bando
1, Andre R Brunoni
1,3, Isabela M Benseñor
1,2and Paulo A Lotufo
1,2,4*Abstract
Background:In a classical study, Durkheim noted a direct relation between suicide rates and wealth in the XIX century France. Since that time, several studies have verified this relationship. It is known that suicide rates are associated with income, although the direction of this association varies worldwide. Brazil presents a heterogeneous distribution of income and suicide across its territory; however, evaluation for an association between these
variables has shown mixed results. We aimed to evaluate the relationship between suicide rates and income in Brazil, State of São Paulo (SP), and City of SP, considering geographical area and temporal trends.
Methods:Data were extracted from the National and State official statistics departments. Three socioeconomic areas were considered according to income, from the wealthiest (area 1) to the poorest (area 3). We also considered three regions: country-wide (27 Brazilian States and 558 Brazilian micro-regions), state-wide
(645 counties of SP State), and city-wide (96 districts of SP city). Relative risks (RR) were calculated among areas 1, 2, and 3 for all regions, in a cross-sectional approach. Then, we used Joinpoint analysis to explore the temporal trends of suicide rates and SaTScan to investigate geographical clusters of high/low suicide rates across the territory. Results:Suicide rates in Brazil, the State of SP, and the city of SP were 6.2, 6.6, and 5.4 per 100,000, respectively. Taking suicide rates of the poorest area (3) as reference, the RR for the wealthiest area was 1.64, 0.88, and 1.65 for Brazil, State of SP, and city of SP, respectively (p for trend <0.05 for all analyses). Spatial cluster of high suicide rates were identified at Brazilian southern (RR = 2.37), state of SP western (RR = 1.32), and city of SP central (RR = 1.65) regions. A direct association between income and suicide were found for Brazil (OR = 2.59) and the city of SP (OR = 1.07), and an inverse association for the state of SP (OR = 0.49).
Conclusions:Temporospatial analyses revealed higher suicide rates in wealthier areas in Brazil and the city of SP and in poorer areas in the State of SP. We further discuss the role of socioeconomic characteristics for explaining these discrepancies and the importance of our findings in public health policies. Similar studies in other Brazilian States and developing countries are warranted.
Background
Suicide rates vary widely between and within countries, since it is a complex phenomenon, related to several sin-gularities. Some general demographic risk factors are known as sex (men), age-strata (young, elderly) and eth-nicity (European). Other factors contribute to suicide
and include: genetic loading, personality characteristics (impulsivity, aggression), psychiatric and physical disor-ders (pain, incapacity), life events (loss, trauma), social isolation, availability of means, substance abuse, eco-nomic condition [1,2].
The highest suicide rates are in Eastern Europe (former USSR countries) and the lowest rates, in some Latin American countries [1,3]. Disparate geographic distribu-tion of suicide has been recognized for the past two cen-turies, with the first seminal observations of Morselli [4] and Durkheim [5], who acknowledged an endemic pattern of suicide in the late XIX century in Europe. Morselli noted * Correspondence:palotufo@hu.usp.br
1
Doctoral Program of Sciences, Faculdade de Medicina, University of São Paulo, São Paulo, Brazil
2
Clinical and Epidemiological Research Center, Hospital Universitário, University of São Paulo, São Paulo, Brazil
Full list of author information is available at the end of the article
a higher suicide rate in Denmark and central Germany, while Durkheim observed the same in northern France, a finding confirmed recently by Baller & Richardson [6] in an analysis using the same data.
The first population-based suicide studies date from the early nineteenth century Europe, highlighted through the work of Jean-Pierre Falret, Esquirol disciple [7,8]. Later, many other studies emerged as led by Morselli, Masaryk, Guerry, Tarde, Winslow, Wagner [4,5,7,9]. Methodologically, the most consistent work belonged to Emile Durkheim, which combined the available empir-ical data with a well-defined sociologempir-ical theory [5]. "The suicide”, Durkheim's masterpiece, inaugurated the modern sociology and was one of the first ecological studies, a major influence in epidemiology. Durkheim's theory is based on two concepts: social integration and social regulation. Suicidal behavior is common in soci-eties where there is a low degree of social integration, culminating in the egoistic suicide. The individual is protected from egoism by religions with strong group ties (e.g. Catholic Church) and family ties. Suicidal be-havior is also common in societies where there is a low degree of social regulation, culminating in the anomic suicide. Social regulation can be understood as external regulatory forces on the individual. Economic cycles (depression or prosperity) and income level are exam-ples of factors that could modulate anomic suicide. Durkheim is commonly criticized for not providing a specific explicit definition of these social variables. Some derivations, extensions and reinterpretations of his theory were attempts to overcome such omission [10-13]. Despite the criticism, he remains one of the most well-known names of suicidology [14]. Sociolo-gists, psycholoSociolo-gists, epidemioloSociolo-gists, psychiatrists have used the same basic methodology established by Dur-kheim [3]. In the late XIX century, France history was marked by great economic development, which was ac-companied by one of the highest suicide rates ever observed. When Durkheim claimed that "poverty pro-tects against suicide," he based his observation on two area-based comparisons. He noted higher suicide rates in France compared to poorer countries, and also that suicide rates were higher in regions of France with greater wealth concentration. This finding raised the hypothesis that economic development could be related to individualism and, ergo, to social isolation and sui-cide. We aimed to evaluate the same relationship in Brazil and São Paulo regions using Geographic Infor-mation System (GIS) and statistical technics. However, the relationship between wealth and suicide is not straightforward; on the contrary, it is complex and changes throughout time and space. In Europe, for in-stance, different patterns were observed at the begin-ning of the twentieth century [15].
In this context, several methodological aspects hinder analysis of this phenomenon. For instance, different study designs have been used to evaluate suicide rates in relation to socioeconomic factors, although most have been ecological. There are also multiple indexes that can be used to evaluate socioeconomic characteristics (e.g. poverty/deprivation, unemployment, Gross Domestic Product (GDP), average income, etc.). Also, most studies were performed in developed countries. Partially because of these questions, results have been heterogeneous.
A systematic review of ecological studies in North America, Europe, Australia, and New Zealand, dating from 1897 to 2004, reported an inverse relation between socioeconomic characteristics and suicide [16]. Other re-cent ecological studies performed in the United States [17], Japan [18], Taiwan [19], Australia [20], England [21], Finland [22,23] and Italy [24] also demonstrated an in-verse relationship. Moreover, an ecological study that grouped data from the G7 countries in 2007 observed an inverse relation between income and male suicides [25]. However, other ecological studies found different results. One worldwide, cross-sectional study performed in the late 1990s included data from 52 countries and identified a dir-ect association between per capita GDP and male suicide rates in all regions except former socialist economy coun-tries, which had abnormally high suicide rates [3]. Another study using World Health Organization (WHO) data fo-cused on countries with a medium Human Development Index (HDI) and found that education and telephone dens-ity was directly related to suicide while a high Gini index was inversely related to suicide [26].
Longitudinal studies also present interesting findings. One study using data from 1960 to 1999 included data from 21 countries grouped into three categories accord-ing to GDP per capita; results showed notably that coun-tries with higher income presented higher suicide rates than poorer countries [27]. Other longitudinal studies also observed this trend [28-30].
Therefore, the relationship between income and sui-cide varies, although it seems that it is mediated by socioeconomic development and income level. In this context, Brazil covers a wide area with almost 200 mil-lion inhabitants with very distinct cultural and socioeco-nomic characteristics, as shown by indexes such as the Gini coefficient and the HDI. In addition, although the overall suicide rate in Brazil is low, in Brazilian urban centers the rates vary from 5 to 15 per 100,000 [31-33]. Few studies have evaluated temporal trends of suicide in Brazil [34,35] and none has explored its relationship with income including spatial distribution.
relationship between suicide and income in Brazil and its regions. We also verified whether such relationship is related to socioeconomic characteristics.
Methods
Study design
We designed an epidemiological study considering sui-cide mortality data in three different regions (Figure 1): (1) a nation-wide comparison of the 27 States in Brazil and also its 558 micro-regions; (2) a within-state com-parison, including the 645 municipalities in the State of
São Paulo (SP); (3) a city-wide comparison, among the 96 neighborhoods that compose the city of São Paulo.
[image:3.595.58.541.227.714.2]To explore our hypothesis that suicide, income, and socioeconomic disadvantage are related, we chose regions with distinct socioeconomic patterns. Regions were charac-terized by the Gini index, the HDI, and the GDP per capita. The Gini coefficient is a measure of income in-equality, ranging from 0 (total equality) to 1 (total inequal-ity). The HDI is based on life expectancy, education, and GDP per capita, also ranging from 0 (minimum develop-ment) to 1 (maximum developdevelop-ment). Remarkably, these
regions present distinct indexes of Gini, HDI, and GDP per capita (Table 1). We chose the city and State of São Paulo for analysis because considering economy and population aspects, they are the most relevant regions of Brazil.
Data extraction
We collected data from Brazilian and São Paulo State Death registry databases for the period 1996 to 2008. All the analyses were conducted on people aged 15 years and over separately for men and women [36]. The age-adjusted rates for suicide were calculated using the WHO standard population as a reference [37]. Rates are per 100,000 individuals per year. Deaths considered sui-cide were those that used codes corresponding to “intentional selfharm”, codes X60 to X84 according to the International Classification of Diseases and Deaths (ICD-10). We chose the data from 1996 onwards as to avoid bias, since during this period the ICD-10 was implemented. The databases assessed were those of the Ministry of Health National Unified System Department of Information Technology [38]. For the city of São Paulo, these data are reviewed by the Death Records Im-provement Program, but is the same base [39]. All data are from official health statistics sources used in Brazilian ecological studies.
The total number of inhabitants in São Paulo and Brazil and average income per capita were based on the National Census (2000). Population projections was based on SEADE Foundation [40]. Average income is strongly correlated with Human Development Index (HDI), Gini index and education (For nation-wide ap-proach the Pearson Correlation was: +0.92, -0.66, +0.87, respectively; p-value < 0.01). So, we decided to use the average income, because it is one of the most common socioeconomic indicators used in this study design [16]. It is a simple measurement that allows comparisons with other studies [26] and is a reliable information extracted from the National Census. All data of the investigated variables are of free access [38-41].
Data synthesis
For each region, income was categorized in tertiles according to its distribution in three areas, from the wealthiest (area 1) to the poorest (area 3) [27].
Data analysis
We performed the following analyses:
[image:4.595.56.548.100.206.2]a)Descriptive analysis,cross-sectional approach (1996–2008), in which we described age-adjusted Table 1 Sociodemographic aspects of the three study regions
Study regions (composition)
Area (Km2) Population (million) Population density HDI Gini index GDP per capita
Brazil 8514876 170 20 0.766 0.606 6473
(27 States)
State of São Paulo 248209 37 149 0.820 0.566 11345
(645 counties)
City of São Paulo 1509 10 6915 0.841 0.620 15286
(96 neighborhoods)
Population Density (inhabitants/Km2
); HDI: Human Development Index; GDP: Gross Domestic Product (Brazillian Real–R$). National Census (IBGE, 2000 [41]).
Table 2 Suicide rates by income and sex for the three regions, 1996–2008
Regions Sex Rate per 100,000
Area 1 (wealthiest)
Area 2 (mid-income)
Area 3 (poorest)
All areas
Brazil Total 7.1 6.2 4.3 6.2
Men 11.8 10.0 6.9 10.2
Women 2.8 2.5 1.8 2.5
State of São Paulo Total 6.6 6.9 7.4 6.6
Men 11.0 11.3 12.3 11.1
Women 2.5 2.4 2.5 2.5
City of São Paulo Total 6.2 6.2 3.8 5.4
Men 9.7 10.5 6.3 8.9
[image:4.595.63.538.571.733.2]suicide rates per gender and income area in the three regions: Brazil, State of São Paulo, and city of São Paulo; relative risks (RRs) and 95% Confidence Interval (CI) were estimated using the poorest area as the reference.
b)Temporal analysis,in which we used Joinpoint Regression Program 3.4.3 (developed by National Cancer Institute [42]) to identify and estimate points of inflection in suicide rate trends. Joinpoint
regression is a log-linear model that uses Poisson regression, creating a Monte Carlo permutation test to identify points where the trend line changes significantly in magnitude or in direction. The analysis starts with the minimum number of joinpoints (a zero joinpoint, which is a straight line) and tests whether one or more joinpoints are significant and should be added to the model (in our analysis, we allowed a maximum of three joinpoints). In the final model each joinpoint (if any was
detected) indicates a significant change in the slope. The permutation test, which estimates the optimal number of joinpoints, was applied after all analyses at a significance level of 0.05. The annual percentage change (APC) and 95% CI were estimated for the time segments on both sides of the inflection points. c)Spatial analysis,which employs a series of
geographical information system (GIS) techniques and statistical methods. ArcGis was used to explore spatial patterns of suicide rates and average monthly income. SaTScan [43] was applied to identify the spatial clusters of high/low suicide rates across the territory. Spatial scan statistical test was
implemented to detect whether the suicide cases were randomly distributed. In this analysis, the suicide RR of each spatial unit was calculated using a Poisson model, and the mean RR of each cluster (including one or more administrative unit) was also
computed with the SaTScan. The average annual mortality of the whole period was defined as the reference for the RR in each cluster. The longitude and latitude of the centroids in each spatial unit were used in the analysis. The most likely clusters were indicated through the likelihood ratio test and indicated as circular windows, to test the hypothesis that these areas had a high/low rate as compared to other areas. Statistical significance of a given cluster was ascertained using Monte Carlo procedures. The final step consisted in verifying association between the suicide risk clusters and average income through logistic regression. The dependent logit variable contrasted risk cluster against the remaining non-risk cluster areas. Results were significant at a p level <0.05 and Hosmer and Lemeshow test was used to check model adjustment. Logistic regression analysis was carried out using Statistical Package of Social Sciences (SPSS), version 12.
Results
Descriptive analysis
Table 1 shows sociodemographic data by region. Income is more equally distributed in the State of São Paulo (according to the Gini Index) and less equally distributed in the city of SP. The city of SP presents the highest HDI and Brazil the lowest, although the city has also the highest GDP per capita (Table 1), which explains the high HDI index.
[image:5.595.57.540.563.726.2]From 1996–2008, there were 98,904 suicides (78,723 men) in Brazil, 21,066 suicides (16,945 men) in the State of São Paulo, and 5,589 suicides (4,283 men) in the city of SP. The State of São Paulo presented the highest male/female ratio (4.4) and the city of São Paulo showed the lowest (3.7). Suicide rates in Brazil, the State of São Paulo, and the city of São Paulo were 6.2, 6.6, and 5.4 per 100,000 inhabitants, respectively (Table 2).
Table 3 Relative risk of suicide by income and sex for the three regions, 1996–2008
Region Sex Relative Risk
Area 1 (wealthiest)
Area 2 (mid-income)
Area 3 (poorest)
Brazil Total 1.64* (1.63 to 1.68) 1.43* (1.40 to 1.46) 1
Men 1.70* (1.66 to 1.73) 1.44* (1.40 to 1.47) 1
Women 1.54* (1.48 to 1.59) 1.40* (1.34 to 1.46) 1
State of São Paulo Total 0.88* (0.84 to 0.93) 0.92* (0.87 to 0.98) 1
Men 0.89* (0.84 to 0.95) 0.92* (0.86 to 0.99) 1
Women 1.03 (0.90 to 1.17) 0.98 (0.84 to 1.14) 1
City of São Paulo Total 1.65* (1.54 to 1.77) 1.64* (1.53 to 1.76) 1
Men 1.54* (1.42 to 1.67) 1.68* (1.55 to 1.81) 1
Women 2.04* (1.76 to 2.36) 1.52* (1.31 to 1.77) 1
Taking the poorest area (area 3) as reference, the RR of suicide in more wealthy regions (areas 1 and 2) was significantly higher in Brazil and the city of São Paulo (Table 3). Conversely, the State of São Paulo showed an inverse relation, i.e. more wealthy areas were associated with a lower suicide risk. All RRs were significant, except for that of females in the State of São Paulo.
Temporal analysis
All analyses considered data from 1996 to 2008. In Brazil, suicide rates in area 1 decreased significantly, while they increased in areas 2 and 3 (Figure 2A). In the State of SP, suicide rates in area 1 showed a significant decrease from 1996–2000, thereafter remaining stable until the end of the period. Rates in the other areas decreased significantly during the whole period (Figure 2B). Finally, in the city of SP, suicide rates in area 1 decreased significantly over the whole period; rates in area 2 decreased significantly up to 2003, and thereafter increased significantly until the end of the study period. Rates in area 3 remained stable (Figure 2C).
Spatial analysis
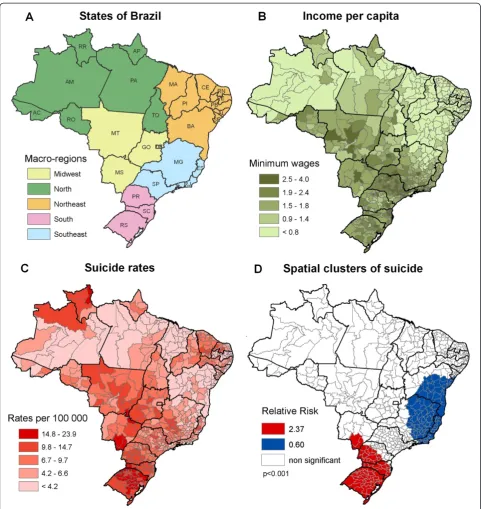
The income map distribution for Brazil shows that the North and Northeast macro-regions had lower income than the Southeast and South regions (Figures 3A, 2B). The Southeast region presents the highest income per capita. On the suicide rate map (Figure 3C) rates were higher in the South, mostly in the State of Rio Grande do Sul. Central and Southeastern regions had intermedi-ate rintermedi-ates, while North and Northeast regions had the lowest suicide rates.
The overall suicide rate in Brazil was 6.2 per 100,000. Spatial scan test identified two significant clusters: one cluster of high suicide rates (up to 12.7 suicides per 100,000), with a RR of 2.37, and another cluster of low rates (4.1 suicides per 100,000) with a RR = 0.60. The former cluster is located in the South region, encom-passing 73 micro-regions; the latter cluster includes 98 micro-regions and comprises the east border, including the states of Rio de Janeiro, Espírito Santo, Minas Gerais and Bahia States (Figure 3). The cluster of high suicide rate showed a direct and significant association with in-come (Table 4).
Income distribution in the state of SP showed that wealthier regions are concentrated in the mid-east, mostly around São Paulo and Campinas (Figures 4A, 4B), while poorer regions are in the south and west of the State. The overall suicide rate was 6.6 per 100,000 and the spatial pattern of suicide was unclear at visual inspection. The mid-region of São Paulo seemed to have lower rates, with outliers of higher rates to the west (Figure 4C).
Spatial scan test revealed a huge high-risk cluster with 8.2 suicides per 100,000 (RR = 1.32). A suicide protection cluster located in Campinas and north of São Paulo mid-regions was also identified (Figure 4D). Here an verse and significant relation between suicide and in-come was observed (Table 4).
Suicide rate in the city of SP was 5.4 per 100,000. The city has a high per capita income and high suicide rates in the central, south central and west areas (Figure 5A, 5B, 5C). Congruently, spatial analysis identified clusters of higher suicide risk in the wealthier areas (RR = 1.65). A cluster of suicide protection was also identified at the south region (Figure 5D). Thus, a direct and significant association between suicide risk and income was verified (Table 4).
Discussion
Our study used ecological data to explore whether income and suicide were related in Brazil. Although ecological studies are considered methodologically problematic since they are based on aggregate data, ours has the strength of performing not only descriptive but also temporal and spatial analyses. While descriptive analysis assesses the magnitude of association between suicide and income in the different regions, the temporal analysis takes into ac-count all these attributes over time. Finally, spatial analysis surveys for clusters of high suicide risk within regions. Taken together, these are useful tools for the evaluation and implementation of suicide interventions.
The descriptive approach showed that for Brazil and the city of SP, suicide rates were higher in wealthier areas; the opposite relation was found for the State of SP, i.e. the wealthiest area had the lowest suicide rate. Remarkably, this was confirmed by spatial analysis show-ing similar associations for all regions– i.e., a direct re-lation between income and suicide in Brazil and the city of SP, and an inverse relation for the State of SP.
Temporal analysis also showed interesting findings – one being that trends for different areas in Brazil and the State of SP converged at the end of the study period. This could be related to general improvements in health care and citizenship observed in Brazil in the last dec-ade. On the other hand, the city of SP showed no such convergence. This could be related to the fact that the city maintained its high income inequality over the study period. Spatial analysis identified clusters with high and low suicide rates in Brazil, State of SP, and city of SP. Brazil had the highest relative risk of suicide, and also the lowest relative risk, comparing the south versus east/ northeast regions. Considering the clusters of high sui-cide rates, the State of SP showed the lowest relative risk.
State of SP, where suicide was inversely related with in-come. Interestingly, the State of SP presents a lower Gini index than the other regions. A systematic review of eco-logical studies from 1897 to 2004 showed that most stud-ies (70%) reported an inverse association between income
[image:8.595.57.539.87.597.2]and suicide; most (88%) were also performed in developed countries [16]. Recent ecological studies conducted in developed countries show similar patterns, the majority finding an inverse relationship between suicide and in-come [17,18,20-23,25,44-46].
The same was noted in longitudinal approach studies [47-49] and using GIS techniques [19,50]. The spatial clusters of suicide in Japan were assessed using data from 1985 and 1995 for prefectures. Researchers used GIS techniques and models showed that suicide rates were higher in less populated areas, areas with more eld-erly persons, and in more religious areas. They suggested an influence of traditional Japanese culture that endorses suicide [51]. A study identified a marked change in the spatial epidemiology of suicide in young men from 2001
to 2005. Suicide rates in London had declined while they had increased in Wales [52]. In London neighborhoods, from 1996 to 1998, a study identified spatial dependency and a direct relationship between deprivation and sui-cide in males aged 30–49 years [53].
Some studies found a direct relation between suicide and income [3,26]. The lack of studies in developing countries still persists; in China (Shandong) an inverse relationship between suicide and income was identified [54]. Conversely, a study focusing on developing coun-tries revealed a direct association between income (indexed by high education levels, high telephone dens-ity, and high cigarette consumption) and suicide. One possible explanation for these findings is that, in devel-oping countries, social deprivation might be more accepted by the population, while in developed countries notions of self-worth and equality are valued [26]. An-other interesting explanation is proposed by Paugam [55], after Castel [56]: authors who distinguish between
[image:9.595.56.292.111.168.2]disqualifying and integrated poverty. The latter, which
Table 4 Association between suicide risk cluster and income, logistic regression
Level B p OR 95% CI
Brazil 0.955 <0.01 2.598 1.840-3.669
State of São Paulo −0.697 <0.01 0.498 0.370-0.671
City of São Paulo 0.067 <0.01 1.069 1.031-1.108
B: coefficient; p: significance; OR: Odds Ratio; CI95%: 95% Confidence Interval.
[image:9.595.56.540.358.704.2]best suits Brazil and the city of São Paulo (higher Gini coefficient), is observed in societies in which poverty is compensated by a solidarity response within family, neighborhood, and region. Integrated poverty was, in fact, the social reality that Durkheim referred when he claimed that “poverty protects” [3]. On the other hand, disqualifying poverty, which is more common in
developed countries, might be related to demotion and loss of social status. Becoming poor in a rich society is, in fact, different than being poor in a poor society, and such loss of social status might lead to frustration and later to suicide [13].
[image:10.595.56.541.86.602.2]probably have various effects on death records and lead to misclassification of suicide [1,2]. Another aspect is related with data quality. It is possible that the quality of the information have influenced suicide trends in Brazil. A study based on vital information provided by the Min-istry of Health Brazilian system identified more deficient information in the poorest macro-regions [57], although this issue has improved in recent years. So, it is possible that the significant suicide increase in area 3 in Brazil could be an artifact. For the nation-wide comparison, we did a sensitivity analysis, based on two periods: 1996– 2002 and 2003 onwards. We focused on area 3 because it was the poorest and presented the highest variation on suicide rates. We also analyzed the age-adjusted death rates by "Ill-defined and unknown causes of mortality" (code R99 of ICD-10). For the first period (1996–2002) suicide remained stable and death by“R99”showed a sig-nificant increase (APC = +12.2). For the second period (2003–2008) suicide increased significantly (APC = +3.7) and death by“R99”decreased significantly (APC =−15.2). There was an improvement in data quality from 2003 on-wards, and also a slightly and significant increase on sui-cide rates. Thus, partially, we can assume that the significant suicide increase in area 3 in Brazil was due to an artifact, but suicide is a rare event, the APC was lower. Fur-ther research must be conducted to clarify these patterns. Spatial analysis using satscan has a limitation. For each area unit, the software considers the respective centroid and its radius, according to the suicide rate. This can bias the clus-ter detection, mostly in large areas with spatial variations in the population density. Despite this limitation in a recent review of software for space-time disease surveillance (in-clude ClusterSeer, SaTScan, GeoSurveillance, Surveillance package for R), satscan was highlighted as the most devel-oped and robust software for cluster detection [58].
Conclusion
In conclusion, we performed a descriptive, temporal, and spatial analysis regarding income level and suicide in dif-ferent regions of Brazil. Results showed that the direc-tion of associadirec-tion varied, albeit resembling similar patterns observed worldwide, with a direct and inverse association in less and more unequal areas, respectively. Taken together, these findings suggest that income and suicide in Brazil are related, although socioeconomic re-gional characteristics might act as a moderator variable. Future studies comparing suicide rates in other Brazilian States and developing countries should take into account these results by performing separate analyses by region. Also, these results highlight that the association between suicide and income in Brazil varies importantly accord-ing to the considered region. The result of the present study is not conclusive. It helps to understand the phenomenon of suicide, generates new hypotheses for
other study designs and can be useful for prevention strategies.
Competing interests
The authors declare that they have no competing interests.
Authors’contributions
DHB undertook data extraction and analysis and wrote the first draft. ARB wrote the revised version. IMB and PAL formulated research questions and contributed to writing the drafts. All the authors contributed to the preparation of the final manuscript and approved the submission.
Author details
1Doctoral Program of Sciences, Faculdade de Medicina, University of São Paulo, São Paulo, Brazil.2Clinical and Epidemiological Research Center, Hospital Universitário, University of São Paulo, São Paulo, Brazil.3Department of Neurosciences and Behavior, Instituto de Psicologia, University of São Paulo, São Paulo, Brazil.4Clinical and Epidemiological Research Center, Hospital Universitário, Av Lineu Prestes 2565, 3° andar–Centro de Pesquisas Clínicas, Cidade Universitária, São Paulo, SP, Brazil.
Received: 30 September 2011 Accepted: 16 August 2012 Published: 28 August 2012
References
1. Hawton K, van Heeringen K:Suicide.Lancet2009,373(9672):1372–1381. 2. WHO:World report on violence and health: Self-directed violence.
http://www.who.int/violence_injury_prevention/violence/global_campaign/ en/chap7.pdf.
3. Baudelot C, Establet R:Suicide: The hidden side of mordernity. Cambridge: Polity Press; 2008.
4. Morselli EA:Suicide: an essay on comparative moral statistics. New York: Appleton; 1882.
5. Durkheim É:Suicide: a study in sociology. New York: Simon & Schuster; 1951. 6. Baller RD, Richardson KK:Social Integration, Imitation, and the Geographic
Patterning of Suicide.Am Sociol Rev2002,67:873–888.
7. Giddens A:Introduction.InSuicide and the meaning of civilization. Edited by Masaryk TG. Chicago and London: The University of Chicago Press; 1970:xix–xli.
8. Hacking I:The Taming of Chance. Cambridge: Cambridge University Press; 1990.
9. Masaryk TG:Suicide and the meaning of civilization. Chicago and London: The University of Chicago Press; 1881/1970.
10. Douglas JD:The Social Meanings of Suicide. Princeton: Princeton University Press; 1970.
11. Gibbs JP, Martin WT:Status integration and suicide: a sociological study. Eugene: University of Oregon Books; 1964.
12. Lester D:Suicide from a sociological perspective. Springfield: Charles C Thomas; 1989.
13. Henry AF, Short JF:Suicide and homicide: some economic, sociological, and psychological aspects of aggression. New York: Free Press; 1954. 14. Shneidman ES:Comprehending Suicide: Landmarks in 20Th-Century
Suicidology. Washington, DC: American Psychological Association; 2001. 15. Halbwachs M:The causes of suicide. New York: The free press; 1930/1978. 16. Rehkopf DH, Buka SL:The association between suicide and the
socio-economic characteristics of geographical areas: a systematic review.Psychol Med2006,36(2):145–157.
17. Tondo L, Albert MJ, Baldessarini RJ:Suicide rates in relation to health care access in the United States: an ecological study.J Clin Psychiatry2006, 67(4):517–523.
18. Fukuda Y, Nakamura K, Takano T:Cause-specific mortality differences across socioeconomic position of municipalities in Japan, 1973–1977 and 1993–1998: increased importance of injury and suicide in inequality for ages under 75.Int J Epidemiol2005,34(1):100–109.
19. Chang SS, Sterne JA, Wheeler BW, Lu TH, Lin JJ, Gunnell D:Geography of suicide in Taiwan: spatial patterning and socioeconomic correlates.
Health Place2011,17(2):641–650.
21. Rezaeian M, Dunn G, St Leger S, Appleby L:Ecological association between suicide rates and indices of deprivation in the north west region of England: the importance of the size of the administrative unit.
J Epidemiol Community Health2006,60(11):956–961.
22. Maki N, Martikainen P:The role of socioeconomic indicators on non-alcohol and non-alcohol-associated suicide mortality among women in Finland. A register-based follow-up study of 12 million person-years.Soc Sci Med2009,68(12):2161–2169.
23. Maki NE, Martikainen PT:Socioeconomic differences in suicide mortality by sex in Finland in 1971–2000: a register-based study of trends, levels, and life expectancy differences.Scand J Public Health2007,35(4):387–395. 24. Martiello MA, Giacchi MV:Ecological study of isolation and suicide in
Tuscany (Italy).Psychiatry Res2012, [Epub ahead of print].
25. Ying YH, Chang K:A study of suicide and socioeconomic factors.Suicide Life Threat Behav2009,39(2):214–226.
26. Vijayakumar L, Nagaraj K, Pirkis J, Whiteford H:Suicide in developing countries (1): frequency, distribution, and association with socioeconomic indicators.Crisis2005,26(3):104–111.
27. Moniruzzaman S, Andersson R:Economic development as a determinant of injury mortality - a longitudinal approach.Soc Sci Med2008,66(8):1699–1708. 28. Ceccherini-Nelli A, Priebe S:Economic factors and suicide rates:
associations over time in four countries.Soc Psychiatry Psychiatr Epidemiol
2010,46(10):975–982.
29. Desaulniers J, Daigle MS:Inter-regional variations in men's attitudes, suicide rates and sociodemographics in Quebec (Canada).Soc Psychiatry Psychiatr Epidemiol2008,43(6):445–453.
30. Yang B, Lester D, Yang CH:Sociological and economic theories of suicide: a comparison of the U.S.A. and Taiwan.Soc Sci Med1992,34(3):333–334. 31. Bando DH, Barrozo LV:Suicídio na cidade de São Paulo - Uma análise sob a
perspectiva da geografia da saúde. São Paulo: Ed. Humanitas; 2010. 32. Bando DH, Brunoni A, Fernandes T, Bensenor IM, Lotufo PA:Suicide rates
and trends in São Paulo, Brazil according to gender, age and demographic aspects: A Joinpoint Regression Analysis.Rev Bras Psiquiatr
2012,34(3):286–293.
33. Diekstra RF:The epidemiology of suicide and parasuicide.Acta Psychiatr Scand Suppl1993,371:9–20.
34. Mello-Santos C, Bertolote JM, Wang YP:Epidemiology of suicide in Brazil (1980–2000): characterization of age and gender rates of suicide.Rev Bras Psiquiatr2005,27(2):131–134.
35. Lovisi GM, Santos SA, Legay L, Abelha L, Valencia E:[Epidemiological analysis of suicide in Brazil from 1980 to 2006].Rev Bras Psiquiatr2009, 31(Suppl 2):S86–S94.
36. Vichi M, Masocco M, Pompili M, Lester D, Tatarelli R, Vanacore N:Suicide mortality in Italy from 1980 to 2002.Psychiatry Res2010,175(1–2):89–97. 37. Ahmad OB, Boschi-Pinto C, Lopez A, Murray C, Lozano R, Inoue M:A new
WHO standard population. Age standardization of rates: a new WHO standard. GPE Discussion Paper Series. Geneva: World Health Organization; 2001:31.
38. DATASUS:Departamento de Informática do Sistema Único de Saúde. http://www2.datasus.gov.br/DATASUS/index.php.
39. Programa de Aprimoramento das Informações de Mortalidade.
http://ww2.prefeitura.sp.gov.br//cgi/deftohtm.exe?secretarias/saude/TABNET/ SIM/obito.def.
40. SEADE:Fundação Sistema Estadual de Análise de Dados. www.seade.gov.br. 41. IBGE:Instituto Brasileiro de Geografia e Estatística. www.ibge.gov.br. 42. National Cancer Institute. Joinpoint regression Program, version 3.4.3.
http://surveillance.cancer.gov/joinpoint.
43. Kulldorff M, SaTScan TM:Software for spatial, temporal, and space-time scan statistics. v9.0. http://www.satscan.org/.
44. Auger N, Zang G, Daniel M:Community-level income inequality and mortality in Quebec, Canada.Public Health2009,123(6):438–443. 45. Milner A, McClure R, De Leo D:Socio-economic determinants of suicide:
an ecological analysis of 35 countries.Soc Psychiatry Psychiatr Epidemiol
2010,47(1):19–27.
46. Yur’yev A, Varnik A, Varnik P, Sisask M, Leppik L:Employment status influences suicide mortality in Europe.Int J Soc Psychiatry2010, 58(1):62–68.
47. Chuanc H-L, Huang W-C:Economic and social correlates of regional suicide rates: A pooled cross-section and time-series analysis.Journal of Socio-Economics1997,26:277–89.
48. Yamasaki A, Araki S, Sakai R, Yokoyama K, Voorhees AS:Suicide mortality of young, middle-aged and elderly males and females in Japan for the years 1953–96: time series analysis for the effects of unemployment, female labour force, young and aged population, primary industry and population density.Ind Health2008,46(6):541–549.
49. Page A, Morrell S, Taylor R, Carter G, Dudley M:Divergent trends in suicide by socio-economic status in Australia.Soc Psychiatry Psychiatr Epidemiol
2006,41(11):911–917.
50. Hooghe M, Vanhoutte B:An ecological study of community-level correlates of suicide mortality rates in the flemish region of belgium, 1996–2005.Suicide Life Threat Behav2011,41(4):453–464.
51. Baller RD, Shin DJ, Richardson KK:An extension and test of Sutherland's concept of differential social organization: the geographic clustering of Japanese suicide and homicide rates.Suicide Life Threat Behav2005, 35(3):343–355.
52. Gunnell D, Wheeler B, Chang SS, Thomas B, Sterne JA, Dorling D:Changes in the geography of suicide in young men: England and Wales 1981–2005.J Epidemiol Community Health2010,66(6):536–543. 53. Rezaeian M, Dunn G, St Leger S, Appleby L:Do hot spots of deprivation
predict the rates of suicide within London boroughs?Health Place2007, 13(4):886–893.
54. Zhang J, Ma J, Jia C, Sun J, Guo X, Xu A, Li W:Economic growth and suicide rate changes: a case in China from 1982 to 2005.Eur Psychiatry
2010,25(3):159–163.
55. Paugam S:Desqualificação social–ensaio sobre a nova pobreza. São Paulo: Educ & Cortez; 2003.
56. Castel R:Metamorfoses da questão social. Rio de Janeiro: Vozes; 1998. 57. Szwarcwald CL, Leal Mdo C, de Andrade CL, Souza PR Jr:[Infant mortality
estimation in Brazil: what do Ministry of Health data on deaths and live births say?].Cad Saude Publica2002,18(6):1725–1736.
58. Jackson MC, Huang L, Luo J, Hachey M, Feuer E:Comparison of tests for spatial heterogeneity on data with global clustering patterns and outliers.Int J Health Geogr2009,8:55.
doi:10.1186/1471-244X-12-127
Cite this article as:Bandoet al.:Suicide rates and income in São Paulo and Brazil: a temporal and spatial epidemiologic analysis from 1996 to 2008.BMC Psychiatry201212:127.
Submit your next manuscript to BioMed Central and take full advantage of:
• Convenient online submission
• Thorough peer review
• No space constraints or color figure charges
• Immediate publication on acceptance
• Inclusion in PubMed, CAS, Scopus and Google Scholar
• Research which is freely available for redistribution