Vol. 46, No. 5, pp. 614 - 624, 2005
The objective of this study was to develop the Somatic Stress Response Scale (SSRS), and then to use the scale in clinical practice. A preliminary survey was conducted using 109 healthy adults to obtain somatic stress responses. Then, 215 healthy subjects completed a preliminary questionnaire. A comparison was made regarding the somatic stress responses among 191 patients (71 with anxiety disorders, 73 with depres-sive disorders and 47 with somatoform disorders) and 215 healthy subjects. Factor analysis of the SSRS yielded five subscales: the cardiorespiratory response, somatic sensitivity, gastrointestinal response, general somatic response and geni-tourinary response subscales. The test-retest reliability for the five subscales and the total score was significantly high, ranging from .86 to .94. The Cronbach's for the five subα -scales ranged from .72 to .92, and was .95 for the total score. By correlating the five subscales and the total score of the SSRS with the somatization subscale scores of the Symptom Checklist-90-Revised (SCL-90-R), convergent validity was calculated. The correlations were all at significant levels. Each of the disorder groups was significantly higher in scores of the cardiorespiratory response, gastrointestinal response, general somatic response and genitourinary response subscale, and in the total SSRS score than the healthy group. Only the depressive disorder group scored significantly higher on the somatic sensitivity subscale than the healthy group, and they also scored significantly higher on the genitourinary response subscale than the anxiety disorder group did. These results suggest that the SSRS is highly reliable and valid, and that it can be effectively utilized as a measure for research of the somatic symptoms related to stress. It also implies that somatic sensitivity and genitourinary responses are associated with depressive disorders.
Key Words:Somatic stress response scale, reliability, validity, anxiety disorders, depressive disorder, somatoform disorders
INTRODUCTION
Stress has been measured in three aspects: stressors, stress responses and individual charac-teristics (personal resources, behavior patterns, coping styles). These varying aspects of stress measures are important in planning treatments and evaluating the effects of treatments.1 Among them, stress responses include sympathetic arousal such as an increase in the release of stress hormones like catecholamines and corticosteroids. An increase in physical factors such as heart rate, blood pressure and muscle potential has also been documented as a stress response. In addition, changes in psychological factors such as increases in fear, anxiety and anger, and decreases in cognitive ability and sensitivity to others may be elicited. Some of the psychophysiological effects of stress can be seen as either adaptive, in that they prepare the individual to respond, or non-adaptive, because they may be damaging to one's health.2
In particular, individual differences in physio-logical reactivity to psychophysio-logical stress have also been well established.3-5 Some individuals (reac-tors) respond to stressful stimuli with greater autonomic arousal than do others (nonreactors).6 In most illnesses, the more observable symptoms are preceded by less recognizable and less dis-abling symptoms (e.g. physical arousal), which go
Development of the Somatic Stress Response Scale and Its
Application in Clinical Practice
Kyung Bong Koh,1 Joong Kyu Park,2 and Sunghee Cho3
1Department of Psychiatry, Yonsei University College of Medicine, Seoul, Korea and Brain Korea 21 Project for Medical Science,
Yonsei University, Seoul, Korea;
2Department of Rehabilitation Psychology, Daegu University, Daegu, Korea;
3Division of Clinical Psychology, National Forensic Psychiatric Hospital, Kongju, Korea.
Received February 25, 2005 Accepted April 27, 2005
Reprint address: requests to Dr. Kyung Bong Koh, Department of Psychiatry, Yonsei University College of Medicine, 134 Shinchon-dong, Seodaemun-gu, Seoul 120-752, Tel. 82-2-2228-1624, Fax: 82-2-313-0891, E-mail: [email protected]
unnoticed to the unaware.7Therefore, physiologi-cal changes may be used as an important cue for the assessment of stress.8
In clinical practice, somatization is the most common psychiatric problem observed in primary care, followed by depression and anxiety.9-11 Somatic symptoms were most frequently com-plained of by psychiatric outpatients in Korea with depressive disorders, followed by somato-form disorders and anxiety disorders.12 It was reported that even among healthy people, appro-ximately 80% complain of somatic symptoms.13
Somatization is common among Koreans, and the word 'hwabyung' is used to define any Korean culture-specific somatization.14-16 Koreans tend to convert their conflicts into somatic symp-toms.17,18 Under stress, verbalization is more fre-quently replaced by physical symptoms. More-over, these symptoms emerge with other com-plicated clinical features, such as anxiety orders, depressive disorders, or somatoform dis-orders.16 Such somatization was also reported by elderly people who had emigrated to America from Korea.19,20
The tools used to measure somatic symptoms to date include the Whaler Physical Symptoms Inven-tory,21 the Patient Health Questionnaire (PHQ)-15,22 and the somatization subscale of the Symptom Checklist-90-Revised (SCL-90-R).23 However, tools to assess stress-related somatic symptoms have rarely been developed. The Stress Response In-ventory (SRI),24 which includes emotional, so-matic, cognitive and behavioral stress responses, was developed in Korea but includes only a limited number of items on the somatic symp-toms. Therefore, the goal of this study was to develop a tool that could assess a broad range of stress-related somatic symptoms, and then to use the scale in clinical practice.
MATERIALS AND METHODS
Subjects and procedures for preliminary survey
The subjects used for the preliminary survey were 109 healthy adults (56 men, 53 women) over 20 years of age (mean ± SD, 41.6 ± 11.0 years). The mean (S.D.) length of education was 14.1 (3.3)
years, and the mean (S.D.) monthly income was 2,485 (730) U.S. dollars. Eighty-three subjects were married, 22 were single, and the marital status of four was unknown. They were sent a letter of informed consent and a questionnaire, along with a written explanation of the study. All but six subjects responded to the questionnaire and re-turned it to the authors. The subjects were asked: “What kind of physical responses do you have under stress?” Participants were also required to write 10 somatic responses to stressful situations, beginning with the most common, along with their demographic characteristics.
The responses obtained from these 109 subjects were subgrouped according to similarity in con-tent and expression, and the frequencies were checked for each response item. It was found that 40 responses were repeated more than five times.
Subjects and procedures for preliminary question-naire
physical and psychiatric disorders and to include in the study only those subjects who had no disorders. According to the self-report question-naire, none of these subjects reported being treated for physical or psychiatric disorders or having symptoms of such disorders. In addition, all of the test subjects were found to be within normal limits in their annual physical check-ups. The comparison group for the discriminant validity test was composed of patients who had been diagnosed with anxiety disorders, depressive disorders, or somatoform disorders at the Depart-ment of Psychiatry at Severance Hospital. These patients were serially selected and interviewed, and given a verbal and written explanation of the outline of the study. Only those patients who granted informed consent were given the ques-tionnaires.
The anxiety disorder group consisted of 45 patients with panic disorder, 13 with generalized anxiety disorder, and 13 with phobic disorder (40 men and 31 women in total; mean (S.D.) age 37.9 (11.6) years). The depressive disorder group included 45 patients with major depression and 28 with dysthymic disorder (32 men and 41 women in total; mean (S.D.) age 38.3 (12.3) years). The somatoform disorder group was made up of 22 patients with undifferentiated somatoform disor-der, nine with somatization disordisor-der, 11 with pain disorder, three with hypochondriasis, and two with conversion disorder (26 men and 21 women in total; mean (S.D.) age 37.3 (13.1) years). The sociodemographic characteristics of the patients are described in Table 1.
The diagnoses were made by an experienced psychiatrist using the DSM-IV criteria.25 Patients with other diagnoses were excluded from this study.
All 215 healthy subjects completed the Korean version26 of the SCL-90-R23at the same time. The SCL-90-R is a 98-item self-rating instrument for assessing a person's psychopathology during the last week, and it includes nine subscales. The test-retest reliability of the preliminary question-naire was calculated by the first and second testing by 62 randomly-selected subjects from the original 215 subjects after a two-week interval. Factor analysis was conducted and the factors were labeled.
Data analysis
A factor analysis was conducted using an ob-lique rotation after the maximum-likelihood factor analysis was completed. An independent t-test was used to compare the subscale scores and the total score of the SSRS between the patient and healthy groups. An analysis of variance was con-ducted to compare the subscale scores and the total score between each of the disorder groups and the healthy groups. The Scheffe test was then employed as a post-hoc test to consider differ-ences in the number of patients in each subgroup. The convergent validity of the subscale scores and the total score of the SSRS was calculated with the subscale scores of the SCL-90-R using a Pearson's correlation. The test-retest reliability of the subscale scores and the total score of the SSRS was calculated using a Pearson's correlation on the first and second testing. The internal consis-tency of the subscales and the total score were calculated using Cronbach's α.
A comparison of the subscale and the total SSRS scores according to sociodemographic character-istics (sex, occupation: professional or non-pro-fessional, marital status: married or single, and religion: present or absent) was made using an independent t-test. The relationships of age, edu-cation, income and the duration of illness with the test scores was examined using a Pearson's cor-relation. A multiple regression analysis was com-puted to determine the effect of the sociodemo-graphic variables, with the dependent variable being the total score and the independent vari-ables being those sociodemographic characteristics that had been confirmed as significantly influ-encing the total score.
RESULTS
Sociodemographic characteristics of the subjects
respect to sex, marital status or occupation (Table 1). There were also no significant differences in terms of sex (2= 2.70, df = 3, p = .44) or age (years, mean ± s.d. depressive disorder 38.3 ± 12.3; soma-toform disorder 37.3 ± 13.1; anxiety disorder 37.9 ± 11.6; healthy controls 41.7 ± 10.5, F = 3.87 df = 3, 402 p= .01, Scheffe test p> .05) among the four groups including the three patient types and the healthy controls.
Factor analysis of the SSRS
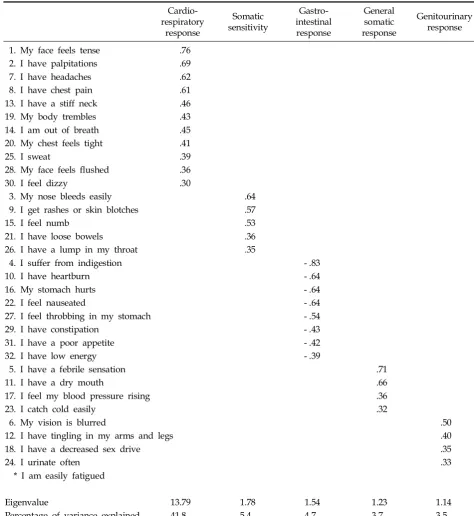
Factor analysis was conducted on 33 items, using an oblique rotation after a maximum-likeli-hood factor analysis, which produced five factors with an eigen value greater than one. Among them, 32 items with a factor loading greater than .3 were extracted. The statement like ‘I am easily fatigued’ was removed from the questionnaire because its factor loading was less than .3. In the case of those items with a factor loading greater than .3 on more than one factor at the same time, the greatest one was extracted.
The first factor, labeled “cardiorespiratory and nervous response” (referred to as cardiorespira-tory response), was found to have the highest eigen value (13.79), and accounted for 41.8% of the responses. This was followed by the second factor, labeled “somatic sensitivity”, the third factor, la-beled “gastrointestinal response”, the fourth fac-tor, labeled “general somatic response”, and the fifth factor, labeled “genitourinary, eye and mus-cular response” (referred to as genitourinary re-sponse). Each item's factor loading is listed in Table 2.
The SSRS was finalized with a total of 32 items under the five subscales. There were 11 items under the cardiorespiratory response subscale, five items under the somatic sensitivity subscale, eight items under the gastrointestinal response subscale, four items under the general somatic response subscale, and four items under the genitourinary response subscale.
[image:4.595.60.536.440.740.2]The FITMOD program was used to determine the fitness of the factors. It was found that the root mean square error of the approximation (RMSEA)
Table 1. Sociodemographic Characteristics of the Subjects
Healthy Group Psychiatric Disorder Group
Statistics df p
(n = 215) (n = 191)
Sex
Men 108 (50.2%) 98 (51.3%)
Women 107 (49.8%) 93 (48.7%) 2= .05 1 .83
Age (yrs)
Mean (SD) 41.7 (10.5) 37.9 (12.2) t = - 3.38 404 .001
Duration of education (yrs)
Mean (SD) 14.2 (3.0) 13.2 (3.5) t = - 2.89 395 .004
Duration of illness(months)
Mean (SD) 31 (42)
Religion (n = 389)
Present 135 (65.2%) 136 (74.7%)
Absent 72 (34.8%) 46 (25.3%) 2= 4.14 1 .04
Marital status (n = 376)
Married 161 (77.8%) 119 (70.4%)
Single 46 (22.2%) 50 (29.6%) 2= 2.65 1 .10
Occupation (n = 266)
Professional 58 (36.2%) 27 (25.5%)
Non-professional 102 (63.8%) 79 (74.5%) 2= 3.40 1 .07
Income (dollars/month)
index was 0.05. This suggests that the five factors originally extracted from the factor analysis are likely to be fit.
Reliability of the SSRS
Test-retest reliability
[image:5.595.53.528.119.636.2]The test-retest reliability of the five subscale
Table 2. Factor Analysis of the SSRS Items
Cardio-respiratory
response
Somatic sensitivity
Gastro-intestinal response
General somatic response
Genitourinary response
1. My face feels tense .76
2. I have palpitations .69
7. I have headaches .62
8. I have chest pain .61
13. I have a stiff neck .46
19. My body trembles .43
14. I am out of breath .45
20. My chest feels tight .41
25. I sweat .39
28. My face feels flushed .36
30. I feel dizzy .30
3. My nose bleeds easily .64
9. I get rashes or skin blotches .57
15. I feel numb .53
21. I have loose bowels .36
26. I have a lump in my throat .35
4. I suffer from indigestion - .83
10. I have heartburn - .64
16. My stomach hurts - .64
22. I feel nauseated - .64
27. I feel throbbing in my stomach - .54
29. I have constipation - .43
31. I have a poor appetite - .42
32. I have low energy - .39
5. I have a febrile sensation .71
11. I have a dry mouth .66
17. I feel my blood pressure rising .36
23. I catch cold easily .32
6. My vision is blurred .50
12. I have tingling in my arms and legs .40
18. I have a decreased sex drive .35
24. I urinate often .33
* I am easily fatigued
Eigenvalue 13.79 1.78 1.54 1.23 1.14
Percentage of variance explained 41.8 5.4 4.7 3.7 3.5
SSRS, Somatic stress response scale.
scores and the total score was computed by a first and second testing. It was at a significant level (p
< .001), ranging from .86 to .94 (r).
Internal consistency
Cronbach's was computed for the five subα -scale scores and the total score of the 215 subjects. The result was significant (p< .01), ranging from .72 to .92 for each of the five subscales, and .95 for the total score.
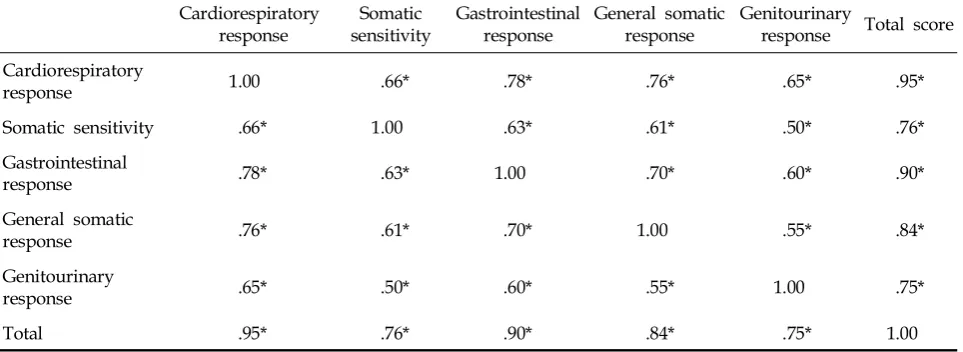
Correlations of the SSRS subscales
The correlations between the total score and each of the subscale scores, as well as the correla-tions between the subscales, were all significant. Their levels ranged from .50 to .95 (Table 3).
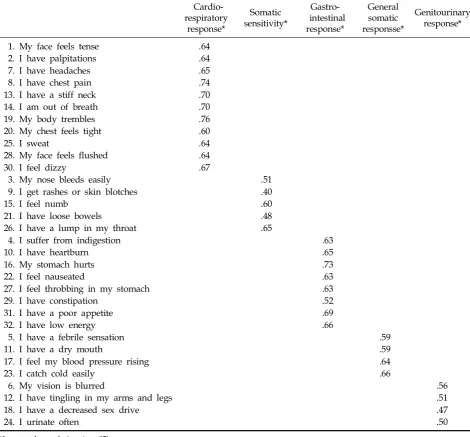
Item-subscale total correlations
The response item scores of the five subscales correlated significantly with the subscale total score of the SSRS (Table 4).
Validity of the SSRS
Convergent validity
The convergent validity of the SSRS was com-puted by correlating the scale scores with the somatization subscale scores and the other sub-scale scores of the SCL-90-R. The five subsub-scale scores and the total score of the SSRS correlated significantly with the somatization subscale and
the other subscale scores of the SCL-90-R (Table 5).
Discriminant validity
The discriminant validity was computed by comparing the scores of all the patients in the disorder groups (anxiety disorder, depressive dis-order and somatoform disdis-order patients) with those of the healthy group, and by comparing the scores of each disorder group with those of the healthy group. The patient group scored signifi-cantly higher than the healthy group on the car-diorespiratory response subscale (17.1 ± 10.3 vs. 7.8 ± 7.3, t = 10.39 df = 338 p< .001), the somatic sensitivity subscale (2.6 ± 2.9 vs. 1.8 ± 2.4, t = 2.81 df = 403 p= .005), the gastrointestinal response subscale (9.0 ± 6.6 vs. 5.2 ± 5.3, t = 6.41 df = 365 p
< .001), the general somatic response subscale (4.4 ± 3.5 vs. 2.7 ± 2.6, t = 5.67 df = 351 p< .001), the genitourinary response subscale (5.9 ± 3.9 vs. 3.1 ± 2.8, t = 8.18 df = 336 p< .001), and the total SSRS score (38.9 ±3.6 vs. 20.5 ± 17.8, t = 8.78 df = 351 p< .001).
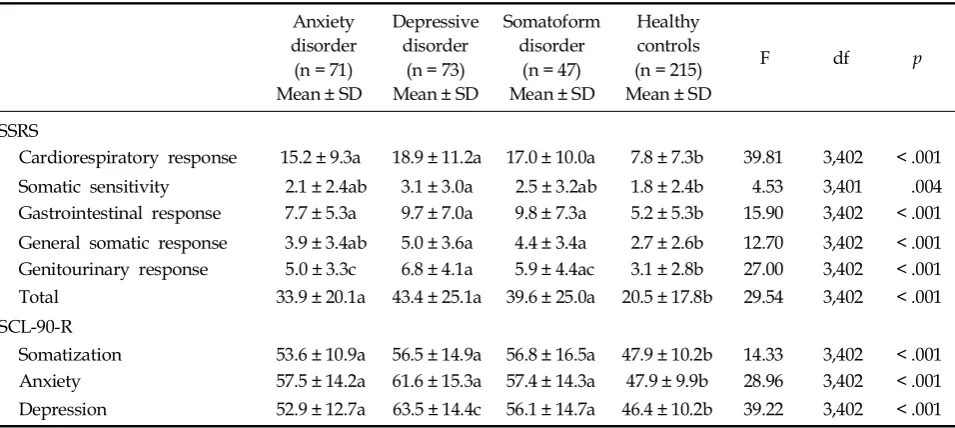
[image:6.595.58.540.121.297.2]The subscale scores of each disorder group were compared with those of the healthy group, and all three disorder groups had significantly higher values on the cardiorespiratory response, gastrointestinal response, general somatic re-sponse, and genitourinary response subscales, and the total SSRS score than the healthy group. Only the depressive disorder group scored significantly
Table 3. Correlation of the SSRS Subscales
Cardiorespiratory
response sensitivitySomatic Gastrointestinalresponse General somaticresponse Genitourinaryresponse Total score Cardiorespiratory
response 1.00 .66* .78* .76* .65* .95*
Somatic sensitivity .66* 1.00 .63* .61* .50* .76*
Gastrointestinal
response .78* .63* 1.00 .70* .60* .90*
General somatic
response .76* .61* .70* 1.00 .55* .84*
Genitourinary
response .65* .50* .60* .55* 1.00 .75*
Total .95* .76* .90* .84* .75* 1.00
*p< .01.
higher on the somatic sensitivity subscale than the healthy controls scored (Table 6).
Each of the disorder groups scored significantly higher than the healthy controls on the somati-zation subscale of the SCL-90-R. However, no sig-nificant differences were found between each of the disorder groups. In a comparison of the SSRS scores between each of the disorder groups, the depressive disorder group scored significantly higher on the genitourinary response subscale than the anxiety disorder group did (p< .05) (Table 6).
Relationship between the sociodemographic variables and the SSRS scores
For the healthy group, several significant rela-tionships between the sociodemographic variables and the SSRS scores were found. When compared according to sex, females scored significantly higher on the total SSRS score than did males (17.4± 16.4 vs. 23.7 ± 18.7, t = - 2.63 df = 213p= .009). The income (r = - .16 p=.02) and education (r = - .20
p= .003) levels had significant negative
correla-Table 4. Item-Subscale Total Correlation of the Somatic Stress Response Scale
Cardio-respiratory
response*
Somatic sensitivity*
Gastro-intestinal response*
General somatic responsse*
Genitourinary response*
1. My face feels tense .64
2. I have palpitations .64
7. I have headaches .65
8. I have chest pain .74
13. I have a stiff neck .70
14. I am out of breath .70
19. My body trembles .76
20. My chest feels tight .60
25. I sweat .64
28. My face feels flushed .64
30. I feel dizzy .67
3. My nose bleeds easily .51
9. I get rashes or skin blotches .40
15. I feel numb .60
21. I have loose bowels .48
26. I have a lump in my throat .65
4. I suffer from indigestion .63
10. I have heartburn .65
16. My stomach hurts .73
22. I feel nauseated .63
27. I feel throbbing in my stomach .63
29. I have constipation .52
31. I have a poor appetite .69
32. I have low energy .66
5. I have a febrile sensation .59
11. I have a dry mouth .59
17. I feel my blood pressure rising .64
23. I catch cold easily .66
6. My vision is blurred .56
12. I have tingling in my arms and legs .51
18. I have a decreased sex drive .47
24. I urinate often .50
[image:7.595.61.532.123.560.2]tions with the total score. However, age had no significant correlation with the total score (r = - .04
p= .57). No significant differences according to the marital status (married vs. single, 18.7 ± 15.4 vs. 22.5 ± 21.6 t = - 1.11 df = 59p= .27), occupation (pro-fessional vs. nonpro(pro-fessional, 16.8 ± 17.6 vs. 20.7± 18.5 t = - 1.32 df = 158 p= .19), or religion (present
vs. absent 21.4 ± 18.9 vs. 18.6 ± 15.9 t = 1.07 df = 05 p= .29) were found in the total SSRS score.
[image:8.595.62.540.122.305.2]A multiple regression analysis was conducted to control for sociodemographic variables such as age, education level, and income. It was found that regardless of the sociodemographic variables, the patient group scored significantly higher than
Table 5. Correlation of the SSRS Subscale Scores with the SCL-90-R Somatization Subscale and other Subscale Scores
Cardio-respiratory
response
Somatic sensitivity
Gastro-intestinal response
General somatic response
Genitourinary response
Total Score
SCL-90-R
Somatization .66* .58* .63* .57* .46* .69*
Interpersonal sensitivity .64* .51* .51* .50* .38* .61*
Anxiety .75* .61* .63* .59* .44* .73*
Phobia .58* .62* .52* .50* .33* .59*
Obsessive-compulsive .68* .49* .57* .56* .46* .67*
Depression .71* .51* .57* .52* .42* .67*
Hostility .64* .63* .52* .49* .39* .64*
Paranoid ideation .68* .63* .59* .56* .44* .69*
Psychoticism .68* .65* .59* .60* .42* .69*
*p< .01.
*SSRS, Somatic stress response scale; SCL-90-R, Symptom checklist-90-revised.
Table 6. Scores of the SSRS and SCL-90-R Subscales in Each Patient Group and the Healthy Control Group
Anxiety disorder (n = 71) Mean ± SD
Depressive disorder
(n = 73) Mean ± SD
Somatoform disorder
(n = 47) Mean ± SD
Healthy controls (n = 215) Mean ± SD
F df p
SSRS
Cardiorespiratory response 15.2 ± 9.3a 18.9 ± 11.2a 17.0 ± 10.0a 7.8 ± 7.3b 39.81 3,402 < .001
Somatic sensitivity 2.1 ± 2.4ab 3.1 ± 3.0a 2.5 ± 3.2ab 1.8 ± 2.4b 4.53 3,401 .004
Gastrointestinal response 7.7 ± 5.3a 9.7 ± 7.0a 9.8 ± 7.3a 5.2 ± 5.3b 15.90 3,402 < .001 General somatic response 3.9 ± 3.4ab 5.0 ± 3.6a 4.4 ± 3.4a 2.7 ± 2.6b 12.70 3,402 < .001
Genitourinary response 5.0 ± 3.3c 6.8 ± 4.1a 5.9 ± 4.4ac 3.1 ± 2.8b 27.00 3,402 < .001
Total 33.9 ± 20.1a 43.4 ± 25.1a 39.6 ± 25.0a 20.5 ± 17.8b 29.54 3,402 < .001
SCL-90-R
Somatization 53.6 ± 10.9a 56.5 ± 14.9a 56.8 ± 16.5a 47.9 ± 10.2b 14.33 3,402 < .001
Anxiety 57.5 ± 14.2a 61.6 ± 15.3a 57.4 ± 14.3a 47.9 ± 9.9b 28.96 3,402 < .001
Depression 52.9 ± 12.7a 63.5 ± 14.4c 56.1 ± 14.7a 46.4 ± 10.2b 39.22 3,402 < .001
SSRS, Somatic stress response scale.
[image:8.595.60.538.372.586.2]the healthy group in the total SSRS score (R2= .18 F = 21.49 p< .001; B = 16.39, β= .37 p< .001).
A significant negative correlation was found between the duration of illness and the cardiore-spiratory response subscale scores for the anxiety disorder group (r = - .24 p= .04). However, no sig-nificant correlation was found between the dura-tion of illness and the scores of the other subscales (anxiety disorder group r = - .19 ~ - .06 p= .11~.64; depressive disorder group r = - .06 ~ .11 p= .33~.86; somatoform disorder group r = .08~.20 p
= .17~.61) or the total SSRS score for any disorder group (anxiety disorder group r = - .22 p= .07; depressive disorder group r = .03 p= .82; somatoform disorder group r = .14 p= .34).
DISCUSSION
Five subscales (cardiorespiratory response, so-matic sensitivity, gastrointestinal response, gen-eral somatic response, and genitourinary re-sponse) were identified after a factor analysis was performed for all the items of the SSRS.
The factor analysis results could be charac-terized in three ways. First, the items identified for the cardiorespiratory response subscale (11 items) were the most common. This was followed by the items for the gastrointestinal response sub-scale (eight items), and the items for the somatic sensitivity subscale (five items). Second, the car-diorespiratory response subscale (41.8%) accounted for the largest proportion of the scale, followed by the somatic sensitivity and the gastrointestinal response subscales. These results suggest that cardiorespiratory symptoms are possibly the most common among stress-related somatic responses. Third, the genitourinary response subscale consti-tutes mainly aging-related somatic symptoms.
The test-retest reliability was significantly high, as was the internal consistency for each subscale and the total score. The correlations between each of the five subscales and the total score, as well as the correlations between each of the items and the subscale scores, were all significant. These results indicate that the SSRS is highly reliable and stable.
The convergent validity was checked by cor-relating the SSRS with the Korean version18of the
SCL-90-R somatization subscale. It was found to be significant, with high correlations between the five subscale scores or the total score, and the somatization subscale scores of the SCL-90-R.
The patient group scored significantly higher than the healthy group on all of the five subscales as well as the total SSRS score. Among the patient subgroups, each of the disorder groups had signi-ficantly higher scores on the cardiorespiratory response subscale, gastrointestinal response sub-scale, general somatic response subsub-scale, genitou-rinary response subscale and the total SSRS score than the healthy group. These findings suggest that the patient group is likely to have a broader range of stress-related somatic symptoms than the healthy group, and that the former is likely to have a higher level of stress than the latter. In ad-dition, only the depressive disorder group scored significantly higher on the somatic sensitivity sub-scale than the healthy controls. This same group also scored significantly higher on the genitou-rinary response subscale than the anxiety disorder group (Table 6). These results could contribute to the discriminant validity of this instrument. It is also suggested that the somatic sensitivity and genitourinary responses are associated with the depressive disorder group.
Regarding the relationship between sex and scale scores in the healthy subjects, females scored significantly higher than males in the total score, which indicates that somatic symptoms are more prominent in women than in men. In terms of income and education level, these variables were found to have significant negative correlations with the total SSRS score, which indicates that these demographic variables may be associated with somatic symptoms
The clinical application of the SSRS showed that the depressive disorder group scored significantly higher on the genitourinary response subscale than the anxiety disorder group did. This finding suggests that depressive disorder patients experi-ence more specific somatic responses than anxiety disorder patients do.
of the disorder groups. This indicates that the SSRS is more useful than the somatization sub-scale of the SCL-90-R in assessing a broad range of stress-related somatic symptoms.
No significant correlations were found between the duration of illness and the total SSRS score for each disorder group. However, for the anxiety dis-order group, the duration of illness had a signifi-cant negative correlation with the scores of the cardiorespiratory response subscale. This finding suggests that for this disorder group, the chronicity of illness may be negatively associated with the degree of severity in cardiorespiratory symptoms. Some may question why the anxiety disorder patients did not obtain the highest scores on the cardiorespiratory response subscale, despite the fact that the scores of this subscale had the highest correlation with the scores of the SCL-90-R anxiety subscale in the healthy subjects. As shown in Table 6, however, the depressive disorder patients had higher scores on the anxiety subscale of the SCL-90-R than did the anxiety disorder patients. These findings indicate that the depressive dis-order patients are likely to have a higher level of anxiety and its related cardiorespiratory symp-toms than are the anxiety disorder patients. Higher scores on the subscales of other somatic symptoms, such as somatic sensitivity, gastroin-testinal response, general somatic response and genitourinary response, were also found in the depressive disorder patients than in the anxiety disorder patients. These findings could be because depressive disorder patients are more likely to have a higher level of anxiety than anxiety dis-order patients.
In conclusion, these results suggest that the SSRS is highly reliable and valid, and that it can be effectively utilized as a measure for research of the somatic symptoms related to stress. In addition, somatic sensitivity and genitourinary responses are likely to be associated with depressive disorders.
REFERENCES
1. Cotton DHG. Stress management - an integrated ap-proach to therapy. New York: Brunner/Mazel; 1990. 2. Ogden J. Health psychology: a textbook. Philadelphia:
Open University Press; 1996. p.200.
3. Kasprowicz AL, Manuck SB, Malkoff SB, Krantz DS.
Individual differences in behaviorally evoked cardiova-scular response: temporal stability and hemodynamic patterning. Psychophysiology 1990;27:605-19.
4. Krantz DS, Manuck SB. Acute psychophysiologic reac-tivity and risk of cardiovascular disease: a review and methodologic critique. Psychol Bull 1984;96:435-64. 5. Matthews KA, Weiss SM, Detre T, Dembroski TM,
Falkner B, Manuck SB,et al.Handbook of stress, reac-tivity, and cardiovascular disease. New York: Wiley; 1986.
6. Katkin ES, Dermit S, Wine SKF. Psychophysiological assessment of stress. In: Goldberg L, Breznitz S, Editors. Handbook of stress - theoretical and clinical aspects. 2nd ed. New York: The Free Press; 1993. p.142-57. 7. Girdano DA, Everly GS. Controlling stress and tension:
a holistic approach. New Jersey: Prentice-Hall; 1979. 8. Koh KB. Stress and psychosomatic medicine. Seoul: Il
Cho Kak; 2002. p.77-91.
9. Spitzer RL, Williams JB, Kroenke K, Linzer M, deGruy FV 3rd, Hahn SR,et al.Utility of a new procedure for diagnosing mental disorders in primary care: The PRIME-MD 1000 study. JAMA 1994;272:1749-56. 10. Ormel J, VonKorff M, Ustun TB, Pini S, Korten A,
Oldehinkel T. Common mental disorders and disability across cultures. Results from the WHO Collaborative Study on Psychological Problems in General Health Care. JAMA 1994;272:1741-8.
11. Kroenke K. Somatization in primary care: it's time for parity. Gen Hosp Psychiatry 2000;22:141-3.
12. Park YN. Clinical review of psychiatric outpatients complaining of somatic symptoms. J Kyemyung Med School 1984;3:169-74.
13. Pennebacker JW, Burnam MA, Schaeffer MA, Harper DC. Lack of control as a determinant of perceived physical symptoms. J Pers Soc Psychol 1977;35:167-74. 14. Won HT, Shin HK. Cognitive characteristics of somati-zation (1): validity and reliability of the Korean version of somatic sensation amplification scale. J Korean Psychol Assoc 1998;1:33-9.
15. Min SK. A study of the concept of Hwabyung. J Korean Neuropsychiatr Assoc 1989;28:604-15.
16. Lee SH. Study of Hwabyung. J Korean Hospital 1977;1: 63-9.
17. Kim KI. Clinical study of primary depressive symptom-part II: symptom pattern of the Korean depressive. J Korean Neuropsychiatr Assoc 1977;16:46-52.
18. Kim MJ, Kim KI. Clinical study of somatization. Mental Health Res 1984;2:137-58.
19. Lin KM. Hwa-Byung - a Korean culture-bound syn-drome? Am J Psychiatry 1983;140:105-7.
20. Pang KYC. Hwabyung - the construction of a Korean popular illness among Korean elderly immigrant women in the United States. Cult Med Psychiatry 1990; 14:495-512.
21. Wahler HJ. Wahler physical symptoms inventory manual. Los Angeles: Western Psychological Services; 1983.
validity of a new measure for evaluating the severity of somatic symptoms. Psychosom Med 2002;64:258-66. 23. Derogatis LR, Rickels K, Rock AF. The SCL-90 and MMPI - a step in the validation of a new self-report scale. Br J Psychiatry 1976;128:280-9.
24. Koh KB, Park J, Kim CH. Development of the stress re-sponse inventory. J Korean Neuropsychiatr Assoc 2000;
39:707-19.
25. American Psychiatric Association (APA). Diagnostic and statistical manual of mental disorders. 4th ed. Washington DC: Am Psychiatric Assoc; 1994. 26. Kim KI, Kim JH, Won HT. Korean manual of symptom