Full Terms & Conditions of access and use can be found at
https://www.tandfonline.com/action/journalInformation?journalCode=trmp20
Road Materials and Pavement Design
ISSN: 1468-0629 (Print) 2164-7402 (Online) Journal homepage: https://www.tandfonline.com/loi/trmp20
Influence of aggregate absorption and diffusion
properties on moisture damage in asphalt
mixtures
Alex K. Apeagyei, James R. A. Grenfell & Gordon D. Airey
To cite this article: Alex K. Apeagyei, James R. A. Grenfell & Gordon D. Airey (2015) Influence of aggregate absorption and diffusion properties on moisture damage in asphalt mixtures, Road Materials and Pavement Design, 16:sup1, 404-422, DOI: 10.1080/14680629.2015.1030827 To link to this article: https://doi.org/10.1080/14680629.2015.1030827
© 2015 The Author(s). Published by Taylor & Francis.
Published online: 16 Apr 2015.
Submit your article to this journal
Article views: 2193
View Crossmark data
Vol. 16, No. S1, 404–422, http://dx.doi.org/10.1080/14680629.2015.1030827
Influence of aggregate absorption and diffusion properties on moisture
damage in asphalt mixtures
Alex K. Apeagyei∗, James R. A. Grenfell and Gordon D. Airey
Nottingham Transportation Engineering Centre, Department of Civil Engineering, University of Nottingham, University Park, Nottingham NG7 2RD, UK
(Received 31 October 2014; accepted 23 January 2015)
An experimental study was undertaken to characterise moisture sensitivity of asphalt mixtures by comparing certain physico-chemical properties of selected aggregates of different miner-alogies to the moisture-induced strength degradation of the aggregate–mastic bonds. The aim of the study was to evaluate the effect of using different aggregate types (as substrates) with a single mastic type that had shown severe moisture sensitivity in the past when combined with a susceptible aggregate substrate. Four different aggregate types and an asphalt mastic (made with a 40/60 pen base bitumen) were used. Aggregate moisture sorption at ambi-ent temperature was characterised using gravimetric techniques. Aggregate specific surface area was determined by octane adsorption using a dynamic vapour sorption device. Dynamic mechanical analysis techniques based on data from a dynamic shear rheometer were used to characterise the rheological properties of the asphalt mastic. Aggregate–mastic bond strength as a function of moisture conditioning time was determined using a tensile pull-off test set-up. The results were used to estimate equilibrium moisture uptake, diffusion coefficient, char-acteristic diffusion time, and aggregate ‘porosity’. The effect of moisture on bond strength was aggregate substrate-type-dependent with three out of the four aggregates performing well and the fourth performing poorly. The moisture absorption and diffusion properties of the poorly performing aggregates were worse than the ‘good’ performing aggregates. Susceptible aggregate–mastic bonds had high porosity, high moisture absorption, high diffusion coefficient and contained granite as substrates. Results of statistical analyses suggested that the differ-ences in moisture sensitivity of the other three aggregates were not significant. Therefore, two unique damage models, one for ‘good’ performing and another for ‘poor’ performing were proposed to characterise moisture damage sensitivity of asphalt. The influence of aggre-gate moisture absorption and diffusion on asphalt mixture moisture damage was found to be aggregate-type-dependent. The results also suggested that in a susceptible mixture, the effect of the substrate aggregate may be more influential than the effect of mastic. The results have important implications for the selection of coarse aggregate for asphalt mix design.
Keywords: aggregate; asphalt mastic; adhesive strength; moisture diffusion; diffusion coefficient; moisture damage; granite; greywacke; basalt; limestone
1. Introduction
Moisture damage is widely recognised as one of the most important contributory factors that affect the long-term durability of asphalt mixtures (Collop et al.,2004; Miller & Bellinger,2003). Around the world, billions of dollars are spent annually to repair the damage to pavements caused in large part by the detrimental effects of moisture on asphalt mixtures. A common manifestation
*Corresponding author. Email:[email protected]
© 2015 The Author(s). Published by Taylor & Francis.
of moisture-induced damage is a loss of cohesion in the mixture and/or loss of adhesion between the bitumen and aggregate interface (Airey & Choi,2002) or more realistically, a loss of adhe-sion at the aggregate–asphalt mastic interface and/or coheadhe-sion within the bulk mastic (Airey, Masad, Bhasin, Caro, & Little,2007). Previous studies focused on moisture damage in asphalt have shown that, in general, the phenomenon may be aggregate-type-dependent. On this basis, the moisture sensitivity of paving-grade aggregates has been described by terms such as slight, moderate, severe in terms of moisture damage resistance (Hicks,1991; Stuart,1990).
The actual mechanism of moisture-induced damage is, however, not completely understood, but the phenomenon is believed to be governed in part by the physico-chemical interactions between bitumen (or mastic) and aggregates, in the presence of water. The build-up of an interfacial water layer several monolayers thick (35–45 nm) at the aggregate–bitumen inter-face has been cited as a major cause of adhesion loss (Nguyen, Byrd, Alsheh, & Bentz,
1995). However, the presence and/or amount of water at the interface alone cannot com-pletely explain strength degradation in certain aggregate types as demonstrated in numerous past studies. It has been shown (Airey et al.,2007) that the mineralogical and chemical com-position of aggregates play a fundamental and more significant role in the generation of moisture damage than bitumen properties such as penetration grade, acid number, and molec-ular size distribution. Thus, the mechanism of moisture-induced damage in asphalt mixtures can be better understood if the mineralogical composition of aggregates as well as the physico-chemical characteristics of aggregate and mastics can be linked with the aggregate–mastic mechanical bond strength. Currently, only a limited number of standard test methods are available that can combine both physico-chemical and mechanical properties and their inter-actions, thus limiting our understanding of the moisture-induced damage in a more fundamental manner.
2. Theories
2.1. Moisture uptake profiles
A moisture uptake profile describes the relationship between the amount of moisture (Mt) a hygroscopic material exchanges (absorbs or desorbs), at a given relative humidity and tempera-ture, with time. Ifw0is the initial (dry) mass of a given material andwtis the mass after timet, then the moisture uptake can be computed as the ratio of the amount of moisture absorbed at a given time to the initial dry mass of the sample at the beginning of the test (Equation (1)). For a material at a given temperature and relative humidity, moisture uptake increases until it reaches a thermodynamic equilibrium at which point no further changes in moisture uptake occur. The moisture content at thermodynamic equilibrium (M∞) is called equilibrium moisture uptake.
Mt=
wt−w0 w0
. (1)
2.2. Fick’s diffusion model
Diffusion can be defined as the movement of molecules from a region of high concentration to a region of low concentration. Diffusion is considered one of the key modes of moisture transport in pavements that influence durability of asphalt mixtures. Diffusing moisture can cause pavement deterioration in two general ways: (1) by attacking and weakening the adhesive bond between asphalt mastic and aggregate, and (2) by degrading the cohesive strength of the asphalt mastic. By measuring the diffusion coefficient of asphalt mastics and of aggregates, the effect of moisture on pavement deterioration can be modelled numerically in order to better understand the moisture damage phenomenon.
Moisture diffusion in asphalt mixtures is usually characterised by using the diffusion coefficient parameter (Apeagyei, Grenfell, & Airey,2014b; Arambula, Caro, & Masad,2010; Caro, Masad, Bhasin, & Little,2008; Kassem, Masad, Bulut, & Lytton,2006; Kringos, Scarpas, & deBondt,
2008; Vasconcelos, Bhasin, Little, & Lytton,2011). The theoretical basis for moisture coefficient determination are Fick’s laws which assume that for an isotropic material, (1) the steady-state rate of transfer of a diffusing substance through a unit area cross-section is proportional to the concentration gradient measured normal to the section (Equation (2)), and (2) the rate of change of concentration of the diffusing substance under unsteady-state conditions is proportional to the diffusion coefficient (Equation (3)). The solution to the differential equation in Equation (2) for a sample with planar infinite geometry is given by Equation (4). Using the moisture uptake data and Equation (4), moisture diffusion coefficient values for the mastics and aggregate substrates used in this study were estimated.
F= −DδC
δx, (2)
whereFis the rate of transfer per unit area of section (flux),D,the diffusion coefficient,C,the concentration of the diffusing substance, and the space coordinate measured perpendicular to the section (Crank,1975).
δC
δt = −D
δ2C
δx2, (3)
wheretis time.
Mt
M∞ =1−
∞
n=0
8
(2n+a)2π2e
−D((2n+1)2π2t/l2)
, (4)
whereMtis the moisture uptake at timet;M∞,the equilibrium moisture uptake;l, the specimen
3. Materials and methods
3.1. Materials
3.1.1. Aggregates
Aggregates of various mineralogy from four different sources in the UK were sampled for testing. They included boulder-sized samples of basalt, granite, greywacke and limestone aggregates, as substrates for adhesion-type tests; and pebble-sized samples of granite and limestone (from sources different from previous) and two types of mineral fillers (granite and limestone), for fab-ricating mastics. It was expected that asphalt mixtures fabricated from these aggregates from different sources and different mineralogy would exhibit significantly different moisture sensi-tivity under laboratory conditions that would permit effects of the experimental variables to be clearly identified. The two aggregates (granite and limestone) that were used for fabricating the mastics were mechanically sieved in the laboratory to obtain only materials passing the 1-mm sieve and retained on 0.125-mm sieve (fine aggregate). The mineral fillers used conform to BS EN 1097-7-2008. In similar fashion to the substrates, the choice for the mineral fillers was made to quantify the effect, if any, of different types of fillers used in asphalt mixtures.
Key physico-chemical properties of aggregates that could influence the adhesive strength of asphalt mixtures include specific gravity, porosity, and specific surface area (SSA). The specific gravity of the aggregate substrates was determined by physical dimensions and weight of the samples while a dynamic sorption device (DVS) was used to estimate SSA. The DVS tech-nique involved exposing aggregate samples to varying concentrations (partial vapour pressures) of carefully selected probe liquids (octane) and measuring the mass gain with time using a sensi-tive microbalance (0.1 μg). Detailed discussion of the sorption technique is provided elsewhere (Grenfell et al.,2013,2014). The results were used to generate a series of sorption isotherms from which the BET SSA was computed. The results were also used to estimate the relative porosity of the aggregates that were used as substrates.
Another important parameter that influences moisture-induced damage in asphalt mixtures is the rate and amount of water absorption of the aggregates. Moisture absorption tests were con-ducted to simulate moisture transport in the aggregate substrates using a total water immersion method at a temperature of 20°C. The approach involved submerging uncoated aggregates discs with nominal dimensions 20 mm diameter by 20 mm thick in deionised water and measuring moisture uptake using a sensitive microbalance (0.1μg resolution). The data (mass uptake and conditioning time) were fitted to a Peleg-type model as shown in Equation (5) (Peleg,1988). The model parameterC1 represents the rate of moisture uptake whileC2 is a measure of the
equi-librium moisture content (reciprocal of the maximum water uptake). The results were compared with the aggregate–mastic bond strength in an attempt to quantify the effect of water on bond strength degradation.
Equation (1) was used to compute moisture uptake by the aggregate substrates as the ratio of moisture uptake at a given time to the original dry weight of the sample at the beginning of the test. The moisture uptake versus conditioning time data also enabled the estimation of an apparent moisture diffusion coefficient. The apparent moisture diffusion coefficientDof the aggregate substrate was estimated assuming Fickian diffusion (Equation (6)) based on the moisture uptake profiles, wherelis the thickness of the aggregate substrate andt0.5is the time to reach one half
of the maximum water uptake.
Mt=
t C1+tC2
, (5)
D=0.049l
2
t0.5
In addition to equilibrium moisture uptake, which is obtained after a long conditioning time (equilibrium time) and represents a materials affinity for water, another parameter that can be used to characterise moisture diffusion in a material is the characteristic diffusion time,τ, which quantifies the duration of the transient portion of the moisture uptake curve. The characteristic diffusion time is proportional to the square of the specimen length and inversely proportional to the diffusion coefficient,D, with the proportionality constant,κranging fromπ/16 to 1 (Equation (7)). An average value ofκ(=4.146) was used in this study.
τ =κl2
D. (7)
3.1.2. Asphalt mastics
The asphalt mastics were fabricated for testing using one bitumen type (40/60 pen) and one aggregate type (granite fine aggregate and mineral filler). The same mastic has been shown to produce moisture-susceptible bonds with certain aggregate types. Note that the granite used for the producing the mastics came from a different source from that used as substrates in this study. The proportion of the constituent components (fine aggregate, mineral filler, bitumen) of the mastics used was 50:25:25 by weight of mixture and was chosen to mimic mastic mix design commonly used in open-graded friction courses. The mastics were produced by combining the dried aggregates and molten bitumen using a Hobart mechanical mixer at a mixing temperature of 185°C. The mastics were then put in quart tins and stored in temperature-controlled (20°C, 50% RH) conditions until testing. The bulk specific gravity of the mastics was estimated to be approximately 1.917.
A key objective of this research study was to develop material models that could be used for numerical simulation of moisture damage using finite element methods. To accomplish this, experiments to establish the rheological properties of mastics were undertaken by performing DMA using a dynamic shear rheometer (DSR) in order to characterise the mastic mechanical property as a function of testing temperature and loading frequency in the linear viscoelastic range. Strain levels to ensure linearity were obtained from amplitude sweep tests conducted at multiple temperatures and loading frequencies. The tests were conducted in strain-controlled DMA with the following testing conditions:
(a) mode of loading: controlled strain;
(b) testing temperatures: 20°C, 10°C, 5°C and 0°C; (c) testing frequencies: 0.1–10 Hz;
(d) plate geometry: 8 mm diameter parallel plate with 3 mm gap; (e) strain amplitude: 0.1%.
In addition to characterising to rheological properties of the mastics, the results from the DSR tests were used to investigate the influence of the different fine aggregates and mineral fillers used and to quantify the effects on moisture sensitivity. This comparison was important because different aggregates could have significant stiffening effects in the same bitumen.
3.2. Methods
3.2.1. Adhesion tests
thick cores were obtained using carbide-tipped, electrically operated water-cooled core drills. The top and bottom surfaces of the substrates were polished using No. 5 sandpaper, to remove all blemishes left by the sawing process, in order to get parallel surfaces to ensure complete adhe-sion of mastic to aggregate surfaces during the adheadhe-sion testing. The fabrication of the substrates was completed by washing the substrates in deionised water (25°C) and then drying them in an oven at 70°C for 48 h. For each testing condition (aggregate type, mastic type and moisture con-ditioning time), six substrates measuring 20 mm diameter by 20 mm thick were cored in order to fabricate three replicate aggregate–mastic butt joints.
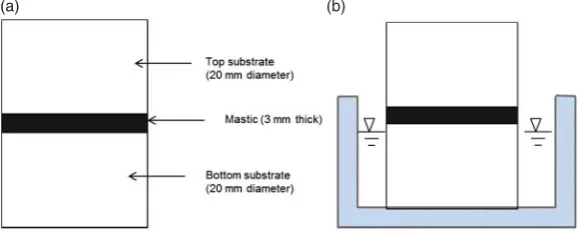
3.2.1.2. Adhesion specimen fabrication and moisture conditioning. The substrates and mastic were heated to a temperature of 140°C. Small amounts of mastic were then poured into silicone moulds to form mastic films of dimensions approximately 3 mm thick and about 26 mm diam-eter. The idea was to produce a mastic film with an aspect ratio (diameter to thickness ratio) of about 8. The mastic films were annealed to the 20 mm diameter hot (130°C) aggregate sub-strates. A second aggregate substrate, also at 130°C, was annealed to the exposed face of the mastic to form a butt joint comprising the 3-mm-thick mastic sandwiched between two aggre-gate substrates. The whole assembly (mastic sandwiched between two aggreaggre-gate substrates) was trimmed using a hot knife to produce the tensile butt-jointed specimens (Figure1(a)). The speci-mens were then kept at 70°C for 2 h to ensure complete bonding. An aluminium-backed adhesive film was used to cover the mastic film during the 2-hour period to ensure that no material leaked out of the mastic. At this stage, the specimens were either stored dry or moisture-conditioned and then tested. Moisture conditioning was performed at 20°C by partially submerging substrate in water such that only about 1–2 mm of the bottom aggregate substrate was exposed to the open air (Figure1(b)). The arrangement ensured that the aggregate–mastic interface was completely dry at the beginning of a test and, therefore, moisture reached the aggregate–mastic bond only through the aggregate.
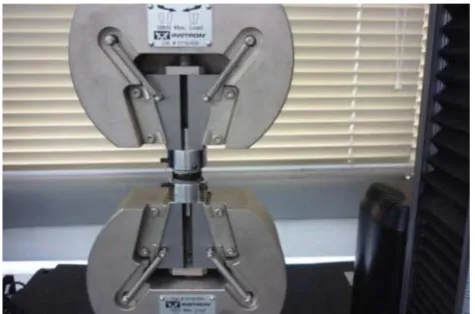
3.2.1.3. Aggregate–mastic bond strength. The effect of moisture for three different condition-ing times (0, 3 and 7 days) on aggregate–mastic interfacial bond strength was determined by using a custom-made pull-off tensile testing rig mounted on an Instron testing machine (Figure2). All the tensile tests were conducted at the same testing temperature of 20°C using a constant cross-head speed of 20 mm/min. Three replicate specimens were tested for each combination of aggregate substrate and mastic combination. The results were used to estimate aggregate–mastic
[image:7.493.102.392.486.602.2](a) (b)
Figure 2. Adhesion strength test set-up.
bond strength as a function of aggregate type, mastic type and conditioning time. The results were analysed in terms of aggregate sorption properties including moisture uptake, diffusion coeffi-cient, and characteristic diffusion time. Comparisons were made between the moisture uptake and the adhesive strength.
4. Results and discussion
4.1. Aggregate
4.1.1. Physico-chemical properties
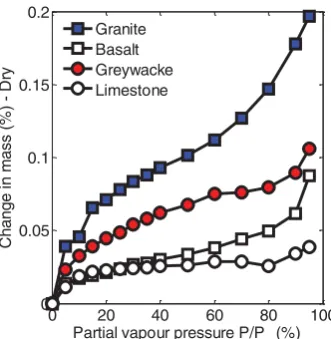
Surface characteristics such as porosity, SSA, and surface free energy are key physico-chemical properties of aggregates that influence their adhesion to other materials. The physico-chemical properties of samples of the aggregates (1.18 mm size) were characterised by using sorption isotherms that were obtained using a dynamic sorption device. Octane was used as the probe liquid because of minimal chemical interaction with aggregates. The results are summarised in Figure3in the form of type II isotherms. The isotherms were obtained by using the amount of octane gas adsorbed to the aggregate surface at relative pressures ranging from 5% to 95% and a constant temperature of 25°C. For the four aggregates samples that were tested, the adsorption of octane was the highest in the granite and the lowest in the greywacke, suggesting that the granite used was most porous (higher internal pores) while greywacke was least porous.
Data depicted in Figure3were used to estimate the SSA of the aggregates by using the BET models for Type II isotherms (Equations (8)–(10)). This was accomplished as follows: from the adsorption isotherm (Equation (8)), a plot ofP/(P0 −P)nagainstP/P0gives a straight line (the
BET plot) in the range 0.05<P/P0<0.35. The slope (A) and the intercept (I) of the BET plot
can be used to calculate the monolayer adsorbed gas (nm) and the BET constant (c) by using
Equation (9). The results were used to estimate the SSA of the aggregates using Equation (10) (Sing,1969). The calculations of the BET parameters and estimation of the SSA values were conducted automatically by the DVS Advantage software. The results are summarised in Table1
together with specific gravity. The results suggest an inverse relationship between density and SSA which suggest that for the aggregates considered in this study, aggregates with higher SSA may also be more porous. On this basis, granite can be considered as the most porous of all the four aggregates tested.
P n(P0−P) =
c−1
nmc
P P0 +
1
nmc
0 20 40 60 80 100 0
0.05 0.1 0.15 0.2
Partial vapour pressure P/P (%)
yr
D
)
%(
s
s
a
m
ni
e
g
n
a
h
C
[image:9.493.163.329.59.229.2]Granite Basalt Greywacke Limestone
Figure 3. Octane sorption isotherms for aggregates (1.18 mm size fraction) used for fabricating substrates.
Table 1. Physical properties of four aggregates arranged in order of increasing SSA.
Aggregate type SSA (m2/g) Specific gravity
Limestone 0.6199 2.983
Basalt 0.6480 3.038
Greywacke 1.3978 3.115
Granite 2.2812 2.729
where P is the partial vapour pressure, Pa; P0, the saturated vapour pressure of solvent, Pa; n,the specific amount adsorbed on the surface of the absorbent, mg; andc,the BET constant (parameter theoretically related to the net molar enthalpy of the adsorption);nm, the monolayer
specific amount of vapour adsorbed on the aggregate surface, mg
nm= I
A+I; c=I+
A
I, (9)
where nm is the monolayer specific amount of vapour adsorbed on the aggregate surface,
mg;I,the slope of the BET plot (for 0.05<P/P0 <0.35); A,the intercept of BET plot (for
0.05<P/P0 <0.35).
nm=
nmN0 M
α, (10)
where SSA is the specific surface area of solid, m2/g;n
m, the monolayer specific amount of
vapour adsorbed on the aggregate surface, mg;N0, the Avogadro’s number, 6.022×10²³mol−1; M,the molecular weight of the vapour, g/mol;α, the projected or cross-sectional area of the vapour single molecule, m2.
4.1.2. Aggregate substrate moisture absorption
[image:9.493.137.361.296.362.2]0 50 100 150 200 250 0
0.5 1 1.5 2 2.5 3
Conditioning time (hr)
M
o
is
tu
re upt
ak
e (%
)
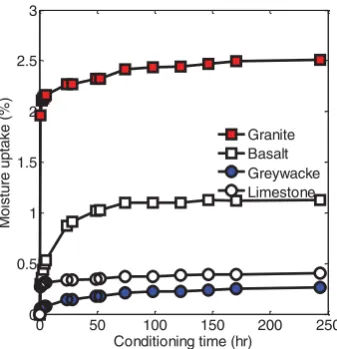
[image:10.493.162.331.59.234.2]Granite Basalt Greywacke Limestone
Figure 4. Aggregate moisture absorption obtained by total immersion at 20°C.
varied from a low of 17.2 g to a high of 19.6 g because of differences in specific gravities (see Table1). Specific gravity values ranging from the highest to the lowest obtained for greywacke, basalt, limestone and granite, were respectively, 3.115, 3.038, 2.983 and 2.729. Figure4shows moisture uptake versus time plots for the aggregates. It can be seen from Figure4that for the aggregates considered, more than 90% of the equilibrium moisture uptake occurred during the first 24 hours of water conditioning. This was typical for all the replicate samples tested. Another observation was that the maximum moisture uptake was aggregate-type-dependent with the high-est average uptake of about 2.51% observed for granite. The second highhigh-est maximum uptake was obtained for the basalt aggregate. The maximum moisture uptake observed for limestone and greywacke were comparatively low at 0.40% and 0.27%. Ranking of the aggregates in terms of maximum moisture absorption from lowest to highest was greywacke, limestone, basalt and granite, which was similar to that for the SSA obtained from octane sorption (Table1), especially the ranking for the lowest and highest SSA.
The moisture uptake profiles (Figure 4) were used to characterise the moisture absorption and diffusion properties of the aggregates. The two characteristics estimated included a theoreti-cal estimate of the equilibrium moisture absorption and the diffusion coefficient. To accomplish these objectives, the uptake data shown in Figure4 were fitted to the Peleg model (Equation (5)) by using numerical optimisation techniques to estimate the model parameters C1 andC2.
The parameterC1represents the rate of moisture absorption while the reciprocal ofC2gives an
estimate of the equilibrium moisture uptake (M∞). The model was employed in order to enable a direct comparison between moisture uptake and strength degradation in order to better quantify the effect of moisture. The agreement between the model-predicted uptake and the experimen-tally determined uptake was close. The fitted uptake profile based on the Peleg model was used in Equation (6) to determine the diffusion coefficient (Ddiff) of the aggregate substrates. The results
of the aggregate absorption and diffusion properties, including the Peleg model parameters, dif-fusion coefficient and characteristic diffusion time, are shown in Table2. The data are ranked in terms of increasing equilibrium moisture absorption.
Table 2. Moisture absorption and diffusion properties of aggregates.
Peleg model parameters
Aggregate type C1 C2 M∞(%) Ddiff(×10–12m2/s) τ(hr) SG Porosity (%)
Greywacke 59.5782 3.9004 0.256 328.3 202.4 3.115 0.797
Limestone 1.382 2.722 0.367 7808.4 8.5 2.983 1.095
Basalt 4.795 0.876 1.141 825.5 80.5 3.038 3.466
Granite 0.1168 0.419 2.387 12,740.3 5.2 2.729 6.514
Notes: M∞ =equilibrium moisture uptake, Ddiff=diffusion coefficient; τ =characteristic diffusion time; SG=specific gravity; Porosity=M∞×SG.
equilibrium uptake with increasing diffusion coefficient was observed which suggested that both parameters are needed to accurately characterise moisture absorption and transport in aggregates. The results also show that the characteristic time (time to reach 90% or more of the equilibrium moisture uptake) is a strong function of aggregate type. Characteristic time ranged from a low of about 5 hours for the granite aggregate to a high of over 200 hours (equivalent to more than 8 days) for the greywacke. The results suggest that when exposed to moisture, for similarly sized aggregate samples, it would take 40 times longer for a greywacke sample to absorb and transport the same amount of moisture as a granite sample. Given the diversity of aggregate mineralogy, the differences in characteristic time could thus be a key factor in the moisture sensitivity of certain aggregates.
Results of the adsorption isotherms (Figure 3) and the resulting SSA (Table 1) show sig-nificant differences depending on aggregate type and suggest by extension that porosity of the various aggregates is also different. Poorly performing aggregate–mastic bonds were found to be associated with aggregates that plotted high on the isotherms and/or that had high SSA.
4.2. Rheological properties of asphalt mastic
It is has been suggested that asphalt mastic, not bitumen, is the actual adhesive agent that binds aggregates together in as asphalt mixture. Adding fine aggregates and mineral fillers to a neat bitumen to produce mastics changes the bitumen’s rheology due to physico-chemical interactions that can occur between the two sets of materials and hence the need to conduct rheological measurements. Other factors that can affect the rheology of bitumen include the mineralogical nature of the aggregates and the volume concentration of the aggregates. As previously stated, the composition of the mastic was 25% bitumen, 25% granite filler, and 50% granite fine aggregates (top size 1 mm). The rheological measurements were conducted at four temperatures (20°C, 10°C, 5°C and 0°C) using a DSR programed to perform frequency sweeps from 10 to 0.1 Hz. Both the neat bitumen and the mastic were tested and the results were used to determine two rheological parameters. They included complex shear modulus and shear viscosity.
A key effect of adding fine aggregates and mineral fillers to produce mastics is increase in stiffness (shear modulus) as illustrated in Figure5which shows graphs of complex shear modulus obtained at four temperatures plotted against loading frequency. As expected, the stiffening effect of aggregate (fine aggregate and mineral filler) on bitumen was significant; the mastic stiffness was several orders of magnitude larger than the base bitumen when modulus are compared at equivalent temperature and loading frequency.
0 5 10 15 0 0.5 1 1.5 2 2.5x 10
9
Loading frequency (Hz)
) a P( s ul u d o m r a e h s x el p m o C 0°C 5°C 10°C 20°C
0 5 10 15
0 0.5 1 1.5 2 2.5x 10
9
Loading frequency (Hz)
[image:12.493.85.411.54.231.2]) a P( s ul u d o m r a e h s x el p m o C 0°C 5°C 10°C 20°C
Figure 5. Rheological properties of the base 40/60 pen bitumen and its mastics containing granite fine aggregate and mineral filler showing significant stiffening effect of aggregate and filler. Left: 40/60 pen. Right: mastic containing granite aggregate and mineral filler.
10-1 100 101
105 106 107 108
Loading frequency (Hz)
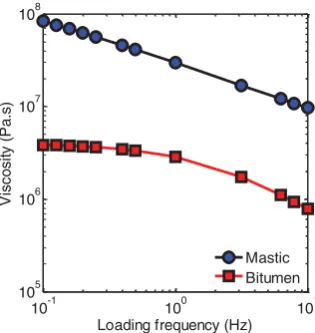
V isco sit y ( P a .s) Mastic Bitumen
Figure 6. Dynamic viscosity at 20°C versus loading rate for 40/60 pen bitumen and its mastics.
against shear rate. It can be seen from Figure6that the mastic has a higher viscosity at low shear rates. Another effect that can be observed is the absence or reduction of the linear viscoelastic range in the case of the mastic, compared with the clear existence of an asymptotic region at low shear rates for the bitumen. The almost linear relationship between viscosity and loading rate observed for the mastic suggests that adding mineral filler and fine aggregate to bitumen causes an increase in non-Newtonian behaviour. Finally, the three-parameter Cross model shown in Equation (11) (de Visscher, Soenen, Vanelstraete, & Redelius,2004) was used to estimate ZSV as another means of characterising the stiffening effect observed for the mastics. The values of ZSV were 4E6 Pa s and 191E6 Pa s, respectively, for the neat bitumen and mastic at 20°C. The results show the importance of using mastic instead of pure bitumen for certain adhesive tests and provide essential material models for describing asphalt mastic.
η= η0
[image:12.493.167.325.282.449.2]whereηis the viscosity, Pa s;η0, the ZSV, Pa s;f,the loading frequency, Hz;m,the regression
parameter;k,the regression parameter.
4.3. Aggregate–mastic bond strength
Tensile strength tests were conducted at 20°C using a loading rate of 20 mm/min to establish the effect of moisture on the mechanical performance of four different aggregate-mastic combina-tions (four aggregates and one asphalt mastic). For each combination, three replicate specimens were tested at three different moisture conditioning times (0, 3 and 7 days). The results were eval-uated in terms of the effects of moisture conditioning, aggregate type, mastic type on the loci of failure, stress–strain relationships, adhesive strength, and retained strength ratios. The aggregate– mastic butt joint and moisture conditioning techniques adopted for this study were designed to ensure that moisture interacts with the aggregate–mastic interface before it can interact with the bulk mastic in order to increase the chance for adhesive failure at the interface and not cohe-sive failure in the bulk mastic. This was accomplished by placing aggregate–mastic specimens with the bottom substrate partially submerged to ensure that water enters the aggregate–mastic interface before entering bulk mastic material as shown in Figure1.
4.3.1. Loci of adhesive and cohesive failure
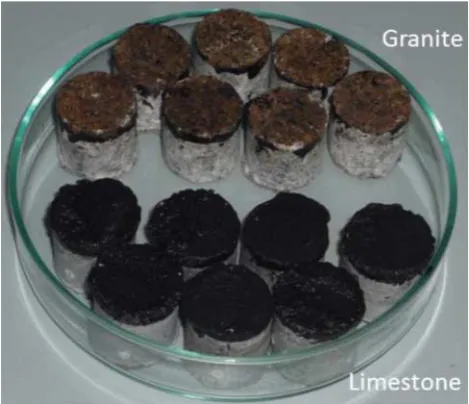
[image:13.493.129.364.387.589.2]Depending on the type of aggregate substrate and moisture conditioning time, three loci of failure (adhesive, cohesive and a combination of the two) were determined using manual observa-tions. Figure7shows sample photographs of the fracture surface, taken immediately following a strength test, which could be used to characterise the locus of the fracture (i.e. the location of failure). The loci of failure in the unconditioned specimens were generally mixed as both adhesive and cohesive failures were observed (Figure7), irrespective of the aggregate substrate
type. Clear adhesive failure (with mastic completely stripped from the wet aggregate substrate) was observed in all the samples containing granite aggregate substrate. The results suggest that in a susceptible mixture, the effect of coarse aggregate may be more influential than the effect of mastic (or bitumen). The results demonstrate that the loci of failure in the moisture-susceptible aggregate–mastic bonds evaluated in this study were predominantly adhesive. The most moisture-susceptible, based on manual observation of loci of failure, was granite while the ranking for the other three aggregates were similar. It should be noted that analysis of the gravimetric moisture absorption tests revealed granite to have the worst combination of moisture absorption and diffusion properties: highest equilibrium moisture absorption, diffusion coefficient and lowest characteristic time compared to the other three aggregates which could explain the significant adhesive failure associated with the granite bonds. It must be noted that the limestone used in this study also had very high diffusion coefficient and characteristic time. Therefore, in addition to moisture absorption and diffusion characteristics, the type of aggregate (mineralogy) could play a part in the moisture susceptibility of asphalt mixtures. The later assertion demon-strates the complexity of the moisture damage phenomenon and illudemon-strates the importance of fundamental material property characterisation of asphalt mixture components.
4.3.2. Effect of moisture on stress–strain behaviour of aggregate–mastic bonds
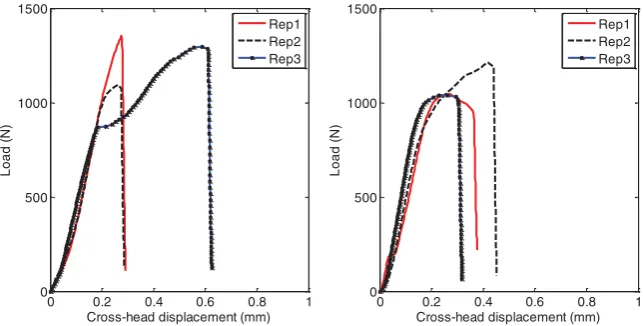
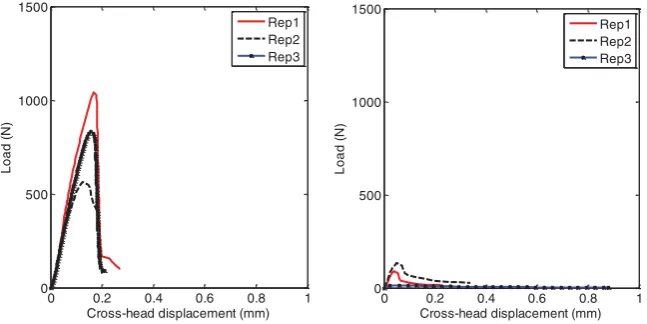
Stress–strain relationships for the various aggregate–mastic bonds were obtained by continuously monitoring the applied load and the cross-head displacement during the pull-off tests. The results were used to evaluate the effect of aggregate type and moisture conditioning time on stress– strain performance. The stress–strain relations could be used as inputs for numerical simulation of moisture damage. The effect of moisture conditioning time on stress–strain behaviour was found to be minimal in three of the aggregates (basalt, greywacke and limestone), but significant for the granite specimens. Figure8 shows an example of the load versus cross-head displace-ment for limestone aggregate showing good resistance to moisture damage. In this case, both the peak load and the slope of load-crosshead displacement (5415 N/mm dry and 5764 N/mm after 7 days of conditioning) were similar. Similar results were obtained for greywacke and basalt speci-mens. On the other hand, the effect of moisture on granite stress–strain behaviour was significant
0 0.2 0.4 0.6 0.8 1
0 500 1000 1500
Cross-head displacement (mm)
Load (
N
)
Rep1 Rep2 Rep3
0 0.2 0.4 0.6 0.8 1
0 500 1000 1500
Cross-head displacement (mm)
Load (
N
)
[image:14.493.86.408.447.610.2]Rep1 Rep2 Rep3
0 0.2 0.4 0.6 0.8 1 0
500 1000 1500
Cross-head displacement (mm)
Load (
N
)
Rep1 Rep2 Rep3
0 0.2 0.4 0.6 0.8 1
0 500 1000 1500
Cross-head displacement (mm)
Load (
N
)
[image:15.493.86.410.61.223.2]Rep1 Rep2 Rep3
Figure 9. Effect of moisture conditioning time on stress–strain behaviour of granite aggregate–mastic butt joint. For this mixture, moisture conditioning resulted in strength reduction and increased brittlness. Left: dry; Right: wet=7 days.
(Figure9). After 7 days of conditioning in water at 20°C, the peak load decreased by almost an order of magnitude from about 939 N to about 79 N while slope of the load versus cross-head displacement decreased from 6400 to 1968 N/mm.
4.3.3. Effect of moisture on aggregate–mastic bond tensile strength
Tensile strength of the various aggregate–mastic bonds was computed as the ratio of peak load to the cross-sectional area of the aggregate substrate. The tensile strength results including sample standard deviations are summarised in Table3for each aggregate–mastic combination and three conditioning times 0, 3 and 7 days. A closer look at the results reveals several interesting obser-vations. First, in the dry condition, the mode of failure is predominately cohesive as previously noted. Furthermore, dry strengths of the various aggregate–mastic bonds were not significantly different. For the three aggregates, greywacke, limestone and basalt, the effect of moisture condi-tioning was not statistically significant. However, moisture had statistically significant effect on granite bond strengths. Several factors could account for the differences in moisture sensitivity observed for the various aggregates. The high characteristic time of 80 hours and 200 hours for the basalt and greywacke aggregates suggests that the amount of time it takes moisture to be transported to the mastic interface is relatively long. On the other hand, the lower characteristic time observed in the limestone alone could not explain the lower sensitivity of this aggregate to moisture. Therefore, aggregate mineralogy in addition to moisture transport is an important parameter controlling moisture damage. As previously indicated, the poor performance of the granite bonds can be attributed to the marginal moisture diffusion and transport properties as well as the mineralogical composition of the aggregate. Furthermore, the relatively high porosity (Table2) of the poorly performing granite bonds could be a key factor influencing the sensitivity to moisture of aggregate–mastic bonds. This later assertion is partially supported by the good correlation (R2 =0.63) between wet strength and porosity.
Table 3. Effect moisture on aggregate–mastic bond strength.
Aggregate substrate Conditioning time (days) Mean±1 SD (MPa) Type of failure
Granite 0 2.184±0.642 Cohesive
3 0.361±0.23 Adhesive
7 0.221±0.164 Adhesive
Limestone 0 3.428±0.536 Cohesive
3 3.383±0.612 Cohesive
7 3.96±0.483 Cohesive
Basalt 0 4.714±0.623 Cohesive
3 4.369±0.183 Cohesive
7 5.316±1.019 Cohesive
Greywacke 0 4.196±1.014 Cohesive
3 5.036±0.461 Cohesive
7 4.558±0.609 Cohesive
Note: SD=standard deviation.
0 50 100 150
0 20 40 60 80 100
Conditioning time (hr)
R
e
ta
ined s
trengt
h (%
)
[image:16.493.169.326.250.416.2]Others - "Good" Granite - "Poor"
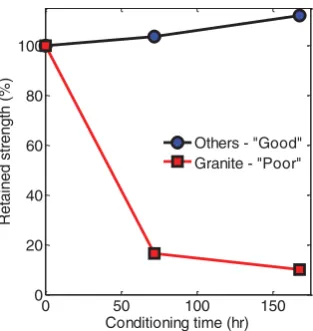
Figure 10. Effect of moisture conditioning time on bond strength of aggregate–mastic butt joints. Com-pared to ‘poor’ performance granite bonds, moisture sensitivity of the other three aggregate (basalt, greywacke, and limestone) were ‘good’.
low value for the retained strength suggests a mixture that could be prone to moisture dam-age. Figure 10shows plots of retained strength with conditioning time for the granite and the three other aggregates combined. The combination of data for the three aggregates was justified because the differences in strength for both the conditioned and dried aggregates were not signif-icantly different (Table3). The results shown in Figure10are important for two main reasons. First, the results could be used to identify ‘good’ versus ‘bad’ mixtures based on the pull-off test presented in this paper. Second, the results could be used to develop damage models that could be implemented in finite element analysis. In this case, different sets of moisture-susceptibility dam-age models could be developed that incorporate aggregate type: the first for ‘good’ performing and the second for ‘poor’ performing.
0 0.5 1 1.5 2 2.5 0
1 2 3 4 5
Moisture uptake (%)
S
trengt
h (MP
a
)
[image:17.493.166.328.59.232.2]Others - "Good" Granite - "Poor"
Figure 11. Effect of moisture uptake at 20°C on strength of aggregate–mastic bonds. Poorly performing aggregates had significantly higher moisture absorption than ‘good’ performing aggregates.
0 5 10
0 0.5 1 1.5 2 2.5
Square root of conditioning time (÷hr)
S
trengt
h
(MP
a
)
Measured Fitted
0 5 10
0 1 2 3 4 5
Square root of conditioning time (÷hr)
S
trengt
h
(MP
a
)
Measured Fitted
Figure 12. Relationship between aggregate–mastic bond strength and square root of conditioning time. Left: Poorly performing granite aggregate–mastic bonds. The excellent (R2 =0.92) linear fit between adhesive strength and square root of moisture conditioning time suggests that a diffusion process controls mastic bond strength degradation in moisture-susceptible mixtures. Right: Good-performing greywacke aggregate–mastic bonds.
[image:17.493.91.405.290.450.2]5. Conclusions
The aim of the current study was to evaluate the effect of four different aggregate types (as sub-strates) with a single mastic type on strength degradation of aggregate–mastic bonds in order to better understand moisture damage in asphalt mixtures. Physico-chemical properties of the aggregates, including moisture absorption, moisture diffusion, SSA and porosity, were deter-mined using a combination of gravimetric sorption techniques. DMA techniques were used to characterise rheological properties of both the mastic and the base bitumen used to manufacture the mastic. The following conclusions can be drawn from the study:
• The influence of aggregate moisture absorption and diffusion on asphalt mixture moisture damage was found to be aggregate-type-dependent. For a given asphalt mastic type, the effects of moisture on bond strength were aggregate substrate-type-dependent. The results also suggested that in a susceptible mixture, the effect of the substrate aggregate may be more influential than the effect of mastic. The results have important implications for the selection of coarse aggregate for asphalt mix design.
• For the four aggregates substrates tested, the effect of moisture after seven days of condi-tioning on three of them (basalt, greywacke, and limestone) was slight. However, the effect of moisture on the granite substrate bond strengths over the same period was severe with only 10% of the initial dry strength retained.
• The moisture absorption and diffusion properties of the granite aggregate were signifi-cantly higher than the three other aggregates tested. The granite aggregate equilibrium moisture uptake (2.5%) and diffusion coefficient (12,700×10−12m2/s) were orders of
magnitude higher than the other three aggregates. These resulted in characteristic diffusion times of granite (5 h) compared to basalt and greywacke (80 and 200 h), suggesting that the time frame to reach saturation is the smallest in granite. It should be noted, however, that the characteristic time for the granite and limestone (8 h) were comparable which sug-gests that the rate of diffusion alone cannot be used to explain moisture sensitivity in all aggregates.
• The porosity (defined as the product of equilibrium moisture uptake and density) of the poorly performing granite was the highest among the four aggregates tested. The results were in agreement with SSA obtained from octane sorption. The higher porosity could be used to explain the relative high moisture absorption observed in the granite aggregates. • For the aggregate–mastic bonds studied, moisture-susceptible bonds contained aggregate
substrates that had high porosity, high moisture absorption, high diffusion coefficient and contained granite as course aggregate. The results suggest that the effect of moisture on aggregate–mastic bonds is aggregate-type-dependent.
• Results of statistical analyses suggested that the differences in moisture sensitivity of three aggregates were not significant. Therefore, the strength data obtained from the three good-performing aggregates could be averaged and the results used to develop two unique damage models, one for ‘good’ performing and another for ‘poor’ performing to characterise moisture damage sensitivity of asphalt mixtures.
• Future studies utilising the results of the rheological, diffusion and damage models devel-oped during this study to conduct realistic numerical simulation of moisture damage in asphalt are recommended.
Disclosure statement
Funding
This work was supported by the UK Engineering and Physical Sciences Research Council [grant number EP/I03646X/1].
References
Airey, G. D., & Choi, Y. K. (2002). State of the art report on moisture sensitivity test methods for bituminous pavement materials.Road Materials and Pavement Design,3(4), 355–372.
Airey, G. D., Masad, E., Bhasin, A., Caro, S., & Little, D. (2007). Asphalt mixture moisture damage assess-ment combined with surface energy characterization. In A. Loizos, T. Scarpas, & I. L. Al-Qadi (Eds.),
Proceedings of a conference on advanced characterization of pavement and soil engineering materials
(pp. 739–748). Athens, Greece: CRC Press.
Apeagyei, A., Grenfell, J., & Airey, G. (2014a). Moisture-induced strength degradation of aggregate-asphalt mastic bonds.Road Materials and Pavement Design,15(Suppl. 1), 239–262.
Apeagyei, A., Grenfell, J., & Airey, G. (2014b). Evaluation of moisture sorption and diffusion charac-teristics of asphalt mastics using manual and automated gravimetric sorption techniques.Journal of Materials in Civil Engineering,26(8), 04014045.
Arambula, E., Caro, S., & Masad, E. (2010). Experimental measurement and numerical simulation of water vapor diffusion through asphalt pavement materials.Journal of Materials in Civil Engineering,22(6), 588–598.
Blackman, B. R. K., Cui, S., Kinloch, A. J., & Taylor, A. C. (2013). The development of a novel test method to assess the durability of asphalt road-pavement materials.International Journal of Adhesion & Adhesives,42, 1–10.
Canestrari, F., Cardone, F., Graziani, A., Santagata, F. A., & Bahia, H. U. (2010). Adhesive and cohesive properties of asphalt-aggregate systems subjected to moisture damage.Road Materials and Pavement Design,11(Suppl. 1), 11–32.
Caro, S., Masad, E., Bhasin, A., & Little, D. N. (2008). Moisture susceptibility of asphalt mixtures, part 1: Mechanisms.International Journal of Pavement Engineering,9(2), 81–98.
Collop, A. C., Choi, Y. K., Airey, G. D., & Elliott, R. C. (2004). Development of the saturation ageing tensile stiffness (SATS) test.Proceedings of the ICE – Transport,157(3), 163–171.
Crank, J. (1975).The mathematics of diffusion(pp. 414, 2nd ed.). New York, NY: Oxford University Press. Cui, S., Blackman, B. R. K., Kinloch, A. J., & Taylor, A. C. (2014). Durability of asphalt mixtures: Effect of aggregate type and adhesion promoters.International Journal of Adhesion & Adhesives,54, 100–111. Grenfell, J. R. A., Ahmad, N., Liu, Y., Apeagyei, A. K., Airey, G. D., & Large, D. (2013). Application
of surface free energy techniques to evaluate bitumen aggregate bonding strength and asphalt mixture moisture sensitivity.Proceedings of the ICE – Construction Materials,167(4), 214–226.
Grenfell, J. R. A., Ahmad, N., Liu, Y., Apeagyei, A. K., Airey, G. D., & Large, D. (2014). Assessing asphalt mixture moisture susceptibility through intrinsic adhesion, bitumen stripping and mechanical damage.
Road Materials and Pavement Design,15(1), 131–152.
Hicks, R. G. (1991).Moisture damage in asphalt concrete. NCHRP Synthesis of Highway Practice 175. Washington, DC: Transportation Research Board.
Horgnies, M., Darque-Ceretti, E., Fezai, H., & Felder, E. (2011). Influence of the interfacial composi-tion on the adhesion between aggregates and bitumen: Investigacomposi-tions by EDX, XPS and peel tests.
International Journal of Adhesion & Adhesives,31, 238–247.
Kassem, E. A., Masad, E., Bulut, R., & Lytton, R. L. (2006). Measurements of moisture suction and diffu-sion coefficient in hot-mix asphalt and their relationships to moisture damage.Transportation Research Record,1970, 45–54.
Kringos, N., Scarpas, A., & deBondt, A. (2008). Determination of moisture susceptibility of mastic-stone bond strength and comparison to thermodynamical properties.Journal of the Association of Asphalt Paving Technologists,77, 435–478.
Miller, J., & Bellinger, W. 2003.Federal highway administration. McLean, VA: FHWA-RD-03-031. Nguyen, T., Byrd, E., Alsheh, D., & Bentz, D. (1995).Relation between adhesion loss and water at the
polymer/substrate interface. Proceedings adhesion society meeting, Hilton Head Island, SC.
Peleg, M. (1988). An empirical model for the description of moisture sorption curves.Journal of Food Science,53(4), 1216–1219.
Stuart, K. D. (1990).Moisture damage in asphalt mixtures – a state-of-art report (FHWARD-90-019). Washington, DC: Federal Highway Administration, US Department of Transportation, 20001. Vasconcelos, K. L., Bhasin, A., Little, D. N., & Lytton, R. L. (2011). Experimental measurement of water
diffusion through fine aggregate mixtures.Journal of Materials in Civil Engineering,23(4), 445–452. de Visscher, J., Soenen, H., Vanelstraete, A., & Redelius, P. (2004).A comparison of the zero shear