Multiphysics Engineering Analysis for ITER Diagnostic
First Wall and Shield Module Design*
Y. Zhai
1,*, G. Loesser
1, M. Smith
1, W. Wang
1, V. Udintsev
2, T. Giacomin
2, A. Khodak
1,
D. Johnson
1, R. Feder
11
Princeton Plasma Physics Laboratory, USA
2ITER Organization, France
Copyright © 2015 by authors, all rights reserved. Authors agree that this article remains permanently open access under the terms of the Creative Commons Attribution License 4.0 International License
Abstract
ITER diagnostic first walls (DFWs) and diagnostic shield modules (DSMs) inside the port plugs (PPs) are designed to protect diagnostic instrument and components from a harsh plasma environment and provide structural support while allowing for diagnostic access to the plasma. The design of DFWs and DSMs are driven by 1) plasma radiation and nuclear heating during normal operation 2) electromagnetic loads during plasma events and associate component structural responses. A multi-physics engineering analysis protocol for the design has been established at Princeton Plasma Physics Laboratory and it was used for the design of ITER DFWs and DSMs. The analyses were performed to address challenging design issues based on resultant stresses and deflections of the DFW-DSM-PP assembly for the main load cases. ITER Structural Design Criteria for In-Vessel Components (SDC-IC) required for design by analysis and three major issues driving the mechanical design of ITER DFWs are discussed. The general guidelines for the DSM design have been established as a result of design parametric studies.Keywords
ITER In-vessel Component, Diagnostic First Wall, Diagnostic Shield Module, Multi-physics Analysis1. Introduction
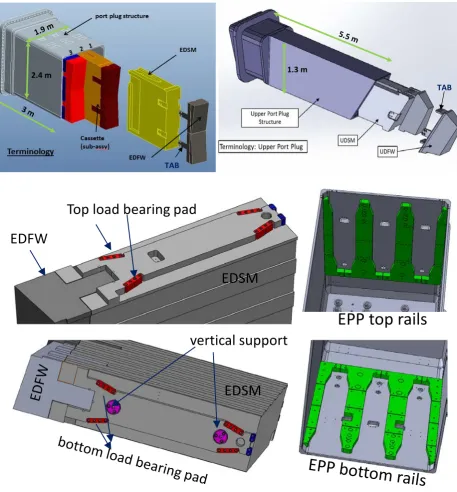
ITER diagnostic first walls (DFW) and diagnostic shield modules (DSM) mounted inside the port plug structure are designed and installed to protect diagnostic instrument and components from a harsh plasma facing environment. The port plug assembly provides necessary structural support of diagnostic systems while allowing diagnostic access to the plasma.[1-2] The DFW design is challenging due to the conflicting set of requirements for diagnostics protection from high plasma heating and nuclear radiation while allowing diagnostic viewing access.[3] Figure 1 shows the upper and equatorial port plugs inside ITER Tokamak.[3] All 6 first walls in an equatorial port can be different due to
[image:1.595.315.551.382.573.2]different diagnostic access requirements. Figure 2 presents the equatorial DFW design and attachment concept with DSMs inside the port plugs.[3] The DFW has a 10 cm recess (Figure 9 in reference 1) to avoid direct contact with plasma and to minimize halo current impact such that ITER grade stainless steel (SS 316LN-IG) can be used as the first wall panel and the DFW main body.
Figure 1. ITER Tokamak and the equatorial and upper ports
DFW based on the resultant elemental force density - the interaction between the eddy current and the magnetic field during plasma events. The dominant load on the DSM include ~1 MNm radial moment on all three equatorial DSMs, and 300 kN poloidal force on the left and right DSM but with an opposite polarity. Since DFWs are attached to the DSM at the tabs via bolted joints, the design and analysis of the DFW and DSM is directly coupled with interface thermal and EM load transfer at the tab. Each of the three DFW-DSM assembled cassettes inside an equatorial port plug (one cassette for each upper port) is supported by the PP structure
via load bearing pads and a set of sliding rails attached to the PP structure.[1, 3]
Thermal fatigue total strain range between heating and dwelling phase of the 6 mm thick first wall dictates the maximum number of thermal cycles allowed. Stresses on DFW attachment tabs under disruption loads drive the design and optimization of the tab geometry and the bolt joint selection at the DFW-DSM interface. The DSM design configuration can have a significant impact to the DFW design and the EM load transfer at the DSM-PP structure interface during plasma events.
2.4 m 1.3 m
TAB
TAB
EPP top rails
Top load bearing pad
vertical support
EDFW
EDSM
[image:2.595.77.535.214.707.2]EDSM
In this paper, we review the main loads and the DFW and DSM design challenges for the port plug assembly. We develop the analysis protocol and present results of the first wall thermal fatigue evaluation. We then discuss the EM and structural analysis for validating structural integrity of the DFW, DSM and port plug assembly. We also summarize influence of the DSM configuration to the DFW design and interface stiffness requirements for the DSM design.
Various parametric studies involving EM, thermal and the static structural analyses have been performed. Guidelines for the DSM design are established based on the interface stiffness requirements and the balanced load transfer between DFW and DSM and between DSMs to the PP structure. We present results of the first wall panel evaluation
and the structural integrity of the port plug assembly. Details of the attachment tab design and bolt selection, as well as impact of DSM attachment system to DFW and PP structure will be presented in future papers.
2. Main Loads and Design Challenges
The DFW design is dominated by plasma surface heating and nuclear volumetric heating during normal operations. Design of the attachment tabs and bolts are dictated by the EM disruption loads and load transfer among DFW-DSM and the PP structure during the plasma events.
~60 kA net current flow through each tab
80 kNm
80 kNm
[image:3.595.96.517.253.689.2]135 kNm
The major design challenges under two critical load cases include 1) Thermal fatigue issue of the 6 mm thick first wall under thermal and pressure loads during normal operation of 30,000 thermal cycles over the lifetime of ITER. 2) DFW tab and bolt joint strength at the interface and the DSM mechanical interface stiffness needed for load transfer during plasma disruptions and VDEs.
Ifthe stress due to pressure load only is insignificant compared to the stress due to combined loads including thermal, EM and seismic loads, the DFW and DSM design will meet French RCC-MR ESPN requirements for exemption of certain implication on in-service inspection.
Cooling circuit design is challenging for DFWs with customized aperture size and shape. ITER Structural Design Criteria In-Vessel Components (SDC-IC)[3-6]impose limit on the total thermal strain range on the first wall panel to be below 0.3% for 30,000 thermal cycles. The maximum stress due to pressure in cooling channel is limited to ~30 MPa per the requirements for ESPN exemption. To satisfy these requirements, cooling channel width and routing must be carefully designed such than stress due to pressure and total thermal strain range are within design limits.
3. Analysis Protocol
Two analysis models have been developed and used for various design parametric studies. A first wall model with detailed cooling channel is used for thermal fatigue evaluation for the first wall under pressure and thermal loads. The global models of generic DFWs without aperture and the equatorial port 03 DFWs with typical diagnostic cuts but no cooling circuit details are used for validating the DFW attachment tabs and bolts, and verifying structural integrity of the DFW-DSM-PP assembly. A similar analysis protocol was used for the analysis of the upper port DFW-DSM-PP assembly.[6]
Electromagnetic analysis
Nuclear analysis
Radiation analysis
Thermal-hydraulic Analysis
EM elemental
force density
volumetric heating
surface heating
Structural Analysis
Temperature & pressure
OPERA
MAXWELL
ATTILA
ANSYS
External data to CFX
Load mapping with dynamic
amplification
Global EM
Global Neutronics
DFW/DSM
DINA case
Load Combination
[image:5.595.98.517.74.324.2]M-Type - Elastic Analysis
C-Type – elastic-plastic anal
Figure 4. Multi-physics engineering analysis protocol
[image:5.595.93.519.358.651.2]4. First Wall Evaluation
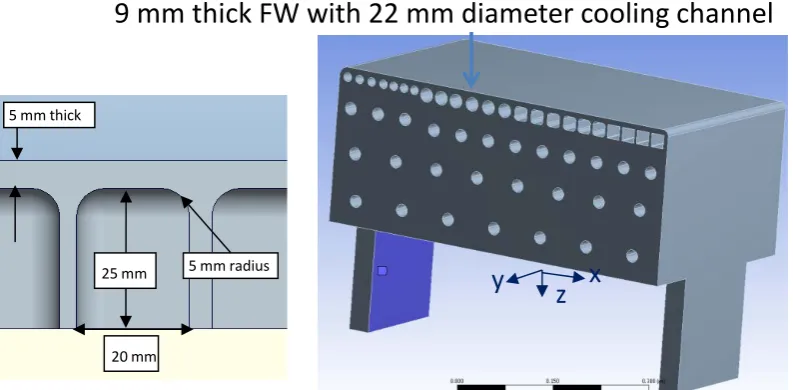
[image:6.595.111.508.348.543.2]A first wall parametric model with varying thickness and varying cooling channels as shown in Figure 6 was used to find an optimal cooling scheme and maximum first wall thickness for the DFW. Finite element convergence studies were performed to ensure an adequate mesh density and convergence is achieved. Results show that steady-state thermal analysis is much less sensitive to mesh size than the mechanical analysis for the plastic strain range calculation. Meshing was performed using CFX method available within the framework of the ANSYS Workbench mesh generator. Combined mesh of around 5 million elements was typically used for solid and liquid parts such as the DFW with cooling. Results from a finer mesh with more than double the number of elements did not show noticeable difference in the resultant temperature and pressure distribution. Elastic-plastic analysis was performed using the nonlinear bilinear kinematic hardening model of ITER SS 316LN-IG.[7]
Figure 6 also presents the first wall cooling channel cross section where in the parametric model the first wall thickness
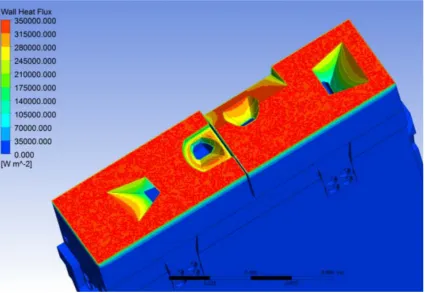
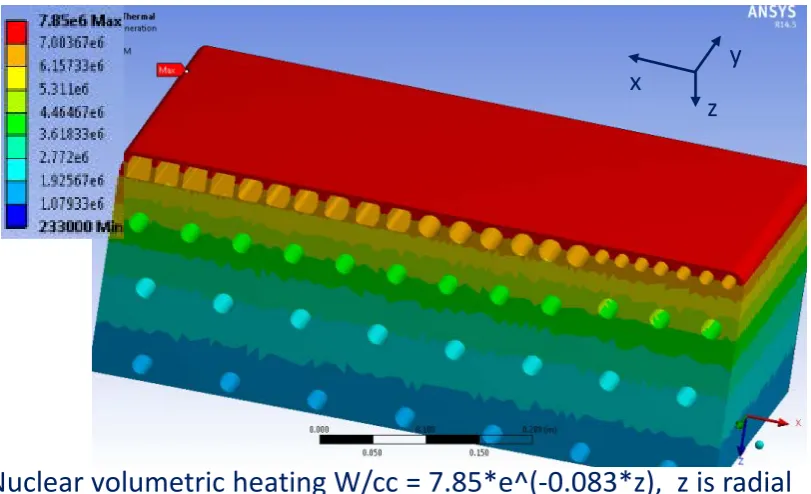
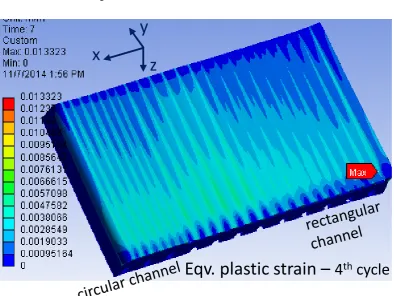
varies from 4 mm to 9 mm along the toroidal direction and the cooling channel design varies from circular to rectangular cross sections. The rib thickness in the first wall cooling channel also varies from 5 to 8 mm. Figure 7 (lower plot) presents the temperature distribution from a steady state thermal analysis after applying the surface heating distribution on the first wall surface and the volumetric heating distribution (upper plot) on the DFW model. The 340 C peak temperature is located at the thick side of the first wall with a circular cooling channel. This implies that a circular channel is worse than the rectangular channel in terms of the first wall cooling. This is due to a longer cooling distance exists in a circular channel from the first wall surface to the cooling water surface. Top and bottom plots on Figure 8 show the equivalent plastic strain for the 1st and the 4th thermal cycles. The plastic strain is more uniformly distributed after a few thermal cycles. The maximum plastic strain of 1.3% is located at the sharp corner of the rectangular cooling channel with 1 mm corner radius. A corner radius of 5 mm was found to be close to optimal and thus used in the final DFW cooling circuit design.
9 mm thick FW with 22 mm diameter cooling channel
FW thickness varies from 4-9 mm along y axis, shape varies along x
axis from circular to rectangular cross section (with corner radius).
Rib thickness varies from 5-8 mm along x axis.
y
z
x
25 mm
20 mm
5 mm radius 5 mm thick
Nuclear volumetric heating W/cc = 7.85*e^(-0.083*z), z is radial
distance from DFW surface
y
z
x
340 C
peak temperature at thick side of FW with circular
cooling channel
y
z
x
[image:7.595.108.514.74.321.2]340 C peak
Eqv. plastic strain –
1
stcycle
y
z
x
Eqv. plastic strain –
4
th
cycle
y
[image:8.595.106.504.74.330.2]z
x
Figure 8. Equivalent plastic strain after first thermal cycle (upper) and after 4th thermal cycle on first wall panel (lower)
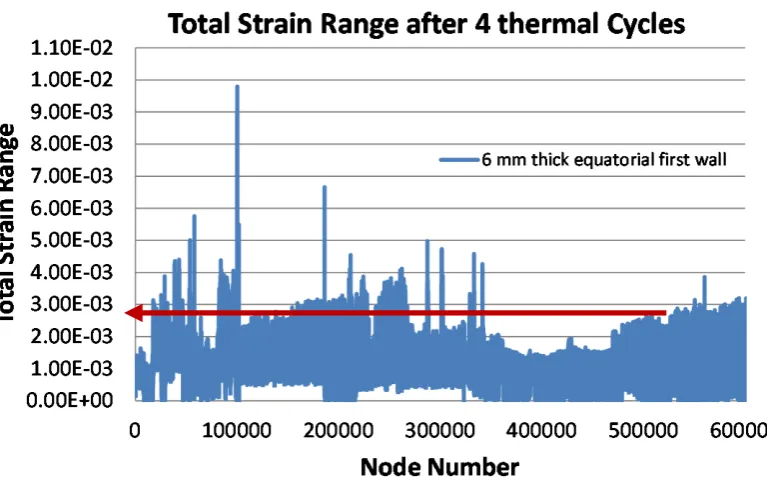
Based on the results of parametric study, rectangular cross section cooling channel with a 5 mm corner radius shown in Figure 6 was chosen for the first wall cooling. Figure 9 presents the temperature and total strain range distribution on the generic equatorial DFW without diagnostic apertures between the heating and dwelling phase of 4 thermal cycles. Results indicate that a higher than allowable total strain range (>0.3%) exists along the edge cooling channel and at
[image:8.595.108.503.329.625.2]higher than 0.3%. Thermal fatigue experimental tests performed previously for ITER indicated that cracks form after a few thousand thermal cycles. According to ITER experts, these cracks, however, will not propagate through
0.66% total strain
0.45% and 0.37% total strain
Figure 9. Temperature distribution and total strain range on the generic equatorial DFW.
Figure 10. Total strain range on the generic equatorial DFW.
5. Electromagnetic Analysis
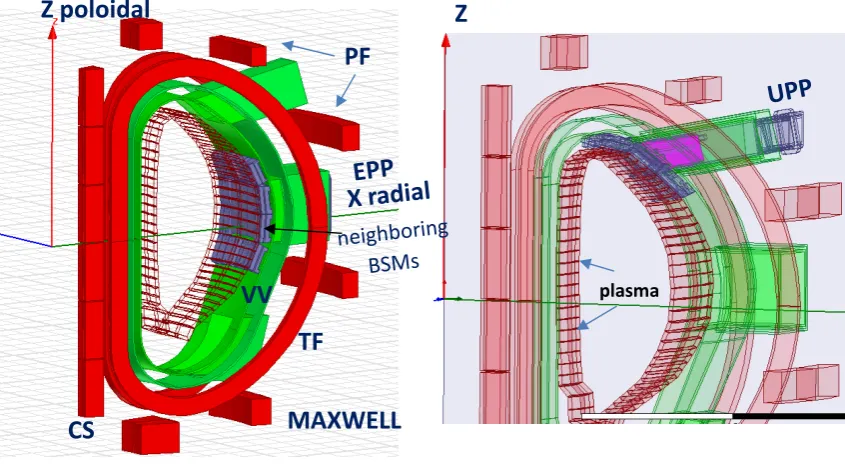
[image:10.595.115.499.282.524.2]MAXWELL
Z poloidal
CS
PF
TF
Z
plasma
VV
Figure 11. MAXWELL models of equatorial and upper PP structure
~60 kA net current flow through each tab
80 kNm
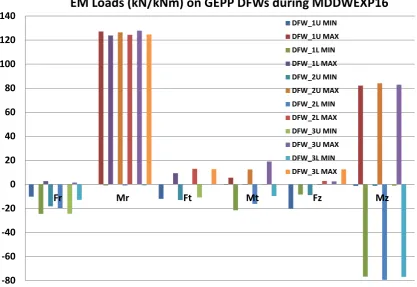
[image:11.595.94.517.84.317.2]-80 -60 -40 -20 0 20 40 60 80 100 120 140
Fr Mr Ft Mt Fz Mz
EM Loads (kN/kNm) on GEPP DFWs during MDDWEXP16
[image:12.595.93.511.84.371.2]DFW_1U MIN DFW_1U MAX DFW_1L MIN DFW_1L MAX DFW_2U MIN DFW_2U MAX DFW_2L MIN DFW_2L MAX DFW_3U MIN DFW_3U MAX DFW_3L MIN DFW_3L MAX
Figure 12. EM loads and eddy current density on generic equatorial DFWs and equatorial port 3 DFW-DSM assembly.
Figure 12 presents the maximum eddy current density in the generic equatorial DFWs and the equatorial port 03 DFW and DSM assembly. Figure 12 also presents the maximum EM loads on the equatorial DFWs during the worst case major disruption downward exponential decay of plasma current within 16 ms (MDDWEXP16). The net current flowing through each DFW tab is ~60 kA. The symmetric plate DSM with 10 cm thickness around all sides was used as the baseline design. The 10 cm thickness is determined by two factors: 1) the ~6-10 cm skin depth of SS during the 16-36 ms transient plasma disruption for ITER. The expected current quench time in ITER is 36 ms linear or an exponential time constant of 16-18 ms.[3,5]; 2) the torsional stiffness needed for load transfer at DFW to DSM interface. The removal of DSM front plate reduces the interface stiffness and will significantly increase amount of eddy current flowing into the DFW tab. Results from un-symmetric DSMs with one side plate removed show significantly unbalanced current flowing through the tab. It is thus important to maintain a symmetry DSM configuration. It is also recommended that diagnostic aperture cuts shall be 3-5 cm away from the DFW tabs to avoid any local stiffness reduction for a balanced EM load transfer from DFW tabs to the DSMs.
6. Structural Analysis
The elemental force density from transient EM analysis is mapped onto the ANSYS structural model with DFW, DSM, PP structure and auxiliary components such as load bearing
pads, pins and bolts. Transient structural dynamic analysis established a dynamic amplification factor of ~1.5 for both equatorial and upper port plug.[3,11] Static structural analysis using mapped elemental force densities at the time step of maximum resultant EM loads has been performed for EM, thermal and combined load cases to validate the system structural integrity. An uncertainty factor of 1.2 is also applied on top of the mapped EM loads.
The global structural model including DFW, DSM and the PP structure has a fixed displacement boundary condition at the rear flange of the equatorial PP. Normal mode analysis shows that the fundamental frequency of the 3 translational and 3 rotational modes of the full PP structure is higher than the one for the model without port extension and the VV sector. As a result, a larger total deflection is obtained from the model with the port extension and fixed boundary condition at the VV sector but stresses on the DFW tabs show little difference between from the two models. It was also found that more EM loads are transferred from the DSM to the PP structure via the rear bearing pads for the model with the port extension and VV sector.
between DSM and the transverse load bearing pads and between load bearing pads and PP structure. A preload of 80 kN was applied on each bolt to ensure a sufficient contact pressure at the tab interface. For the baseline plate of the DSM, 2/3 of loads are transferred from DSM to the PP structure via the rear load bearing pads. This is unexpected because most eddy current are induced in the front part of the port plug assembly and the design of the load bearing pads is
based on an uniform distribution of reaction loads on the pads. Non-uniform distribution of load transfer from the DSM to PP structure may significantly increase stresses on these load bearing pads and thus the DSM to PP structure attachment system may fail the design criteria. It is thus recommended to remove the rear plate of the DSM to soften the rear DSM stiffness and to obtain a more balanced load transfer from the DSM to the PP structure.
[image:13.595.61.548.176.374.2]Figure 13. Generic EPP structural analysis model with pretension bolts at DFW tabs (left) and DFW-DSM assembly (right); fixed displacement boundary condition applied at the PP back flange.
[image:13.595.113.499.403.736.2]Figure 15. Deflection on EPP03 assembly under EM loads during MDDWEXP16 worst disruption
[image:14.595.108.506.77.377.2] [image:14.595.107.507.401.734.2]7. DSM Configuration
The influence of the DSM configuration on the DFW design includes 1) EM load distribution and eddy current flowing through the DFW tabs at the interface 2) attachment tab and bolt stress with varying DSM stiffness 3) EM load transfer among the DFW, DSM and the PP structure. Our study showed that a generic plate DSM with 10 cm thickness around all four sides has sufficient stiffness required for EM load transfer. Un-symmetric DSMs with one side plate removed introduce an unbalanced current flow through the DFW tab and increase stress and deflection.
The DSM configuration has a significant impact on the load transfer between DFW-DSM and the PP structure. Our study showed that more loads are transferred via the rear load bearing pads from the DSM to the PP structure than expected. It is therefore recommended to remove the rear plate of the baseline DSM so more balanced load transfer can be obtained from the DFW-DSM assembly to the PP structure. Boron carbide packed in the middle and rear of the DSM can be used to improve the nuclear shielding while maintaining the total weight of the DSM as required by ITER port plug integration design team.
The plate DSM configuration with a 10 cm-thickness around all sides is used as the baseline and it is shown to meet the DSM stiffness and load transfer requirements. Un-symmetric DSM configurations at the DFW interface will introduce unbalanced eddy current flow at the tabs, and insufficient stiffness will lead to increased tabs stresses and deflections. The DSM configuration also influences the load transfer from DSM to the PP structure at the load bearing pads.
8. Conclusions
Design analysis of ITER DFW and DSM is challenging in the harsh plasma facing environment with high thermal, electromagnetic and VV interface loads. A multi-physics engineering analysis protocol is established for validation of the port plug component design and the global structural integrity.
The first wall thermal fatigue has been evaluated based on the total strain range from nonlinear elastic-plastic analysis for an optimized thickness and cooling design. Attachment tabs and bolts are evaluated for design driving load cases to ensure the structural integrity and a balanced interface load transfer. The design and analysis provided guidance for the
DSM design to meet the interface load transfer requirements to ensure global structural integrity.
Acknowledgements
This work is supported by US DOE Contract No. DE-AC02-09CH11466.
REFERENCES
[1] C. S. PITCHER et al, "Nuclear Engineering of Diagnostic Port Plugs on ITER", Fusion Eng. Des., 87, 667-674, 2012.
[2] R. FEDER et al, “The Status of US ITER Diagnostic Port Plug Neutronics Analysis using ATTILA”, lab report, PPPL-5025, 2013.
[3] Y. Zhai, “Load Specification for ITER Equatorial Diagnostic First Wall”, private communication, ITER IDM report
LDEJJT v1.6, 2015.
[4] G. SANNAZZARO et al, “Development of Design Criteria for ITER In-vessel Components”, Fusion Eng. Des., 88, 2138-2141, 2013.
[5] Y. ZHAI et al, "Electromagnetic Analysis of ITER Diagnostic Equatorial Port Plugs during Plasma Disruptions", Fusion
Eng. Des., 88, 547-550, 2013.
[6] M. SMITH et al, “Analysis of ITER Upper Port Diagnostic First Walls”, doi10.13182/FST14-990, TOFE2014
Proceedings,Fusion Sci. Technol., 68 (2015).
[7] A. KHODAK et al, "Numerical Analysis of Coolant Flow and Heat Transfer in ITER Diagnostic First Wall ", doi10.13182/FST14-955, TOFE2014 Proceedings, Fusion
Sci. Technol., 68 (2015).
[8] F. Sevini, M. Merola, “Thermal fatigue behavior of artificially defected first wall components”, Fusion Eng. Des., 36, 219-226, 1997.
[9] E. Diegele et al, “Results of the IAEA benchmark on lifetime predictions of first wall components”, J. Nucl. Mater., 233-237, 62-71, 1996.
[10] T. C. HENDER et al, “MHD stability, operational limits and disruptions”, Nucl. Fusion, 2007. S128-S202.