The San Joaquin River sometimes contains high levels of selenium, boron and salt from drainage water. Reservoir releases can be timed to dilute these concentrations.
Computer model improves real-time
management
of
water quality
Nigel W.T. Quinn P Leslie F. Grober o Jo-Anne Kipps P Carl W. Chen o Earle Cummings
Members of the San Joaquin River Management Program’s Water Quality Subcommittee have developed a water-quality fore- casting model to help improve the timing, coordination and manage- ment of agricultural drainage and reservoir releases into the San Joaquin River. The goal of this effort is to improve water quality in the San Joaquin River and to meet federal and state water- quality objectives for salt, boron and selenium. A graphical user interface has been developed and features have been added to make this computer software use- ful and accessible to a wide range of decision makers.
The San Joaquin River provides essen- tial drainage for agricultural land and managed wetlands in the San Joaquin Valley. The river has an average an- nual flow of approximately 1.8 million acre-feet, measured at Vernalis. Dur- ing the period 1985 to 1994, an average of 70% of the annual flow in the San Joaquin River was derived from the major east-side tributaries (Stanislaus, Tuolumne, Merced and Upper San Joaquin rivers), which receive flow from New Melones Reservoir, New Don Pedro Reservoir, Lake McClure and Millerton Reservoir. The remain- der of the flow during this period consisted of surface drainage (14%), subsurface drainage
(I
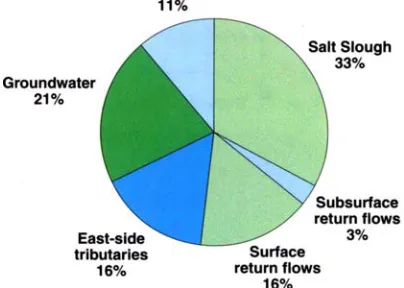
%) and contri- butions from Salt Slough (9%) and Mud Slough (2%).is approximately 920,000 tons, of which the east-side tributaries contrib- ute 16%, Salt Slough 33% and Mud Slough 11%. The remainder of the salt load consists of groundwater (21%) and surface drainage (16%) (fig. 1).
Assimilative capacity
There is a large year-to-year and seasonal variation in water quality in the San Joaquin River (fig. 2). Down- stream users are particularly sensitive to elevated salinity during the spring months of March and April when preirrigation and crop germination oc- cur. March and April are also the months when many seasonal wetlands are drained for reseeding to provide overwintering habitat for migrating wildfowl. Spring pulse flows for salmon migration also occur during this time, providing potential dilution flows.
Electrical conductivity (EC) is di- rectly correlated with the concentra- tion of dissolved salts. In the 1985-to- 1994 period, the electrical conductivity at Vernalis exceeded the State Water Resources Control Board (SWRCB) water-quality objective of 700 micro- Siemens per centimeter (pS/cm) 61% of the time during the irrigation sea- son (April l-Aug. 31). The non- irrigation season (Sept. 1-March 31) EC objective at Vernalis of 1,000 pS/ cm was exceeded 15% of the time. These objectives were set as part of a negotiated settlement between the U.S. Bureau of Reclamation (USBR) and the South Delta Water Agency.
Although the U.S. Bureau of Recla- mation tries to meet these water-qual- ity objectives by making releases from New Melones Reservoir, water-quality forecasting capability has been inad- equate to prevent frequent violations. Water is sometimes wasted when re- leases exceed the amount required for dilution. Precisely timing releases is difficult because of the fluctuating EC at Vernalis and the uncertain travel time between the reservoir and the main stem of the San Joaquin River. Improved forecasting of river assimi- lative capacity for salt load would help to remedy this problem.
Assimilative capacity for salt, as used here, is defined as additional salt
load that the river can accept without exceeding EC objec- tives at Vernalis. Positive as- similative capacity indicates that additional drainage dis- charges can be made to the river without violating water- quality objectives. Negative as- similative capacity indicates a need for additional dilution.
Past analyses using mass-balance models of the river, such as the State Water Resources Control Board’s San Joaquin River Input-Output model (SJRIO), suggest that considerable op- portunity exists for improved coordi- nation of drainage discharges and res- ervoir releases to more efficiently use river assimilative capacity for salt, bo- ron and selenium while complying with water-quality objectives. Comple- mentary studies by the US. Bureau of Reclamation
-
using a model that combined irrigation, drainage and crop-production functions - sug- gested that successful long-term op- eration of such a system might be possible without impairing crop yields and forcing irrigated land out of production.Recent actions initiated by local wa- ter districts to improve compliance with water-quality objectives include increased drainage recycling; use of short-term, on-farm surface and sub- surface storage; and the adoption of water conservation and drainage re- duction technologies to increase con- trol of drainage discharges and con- taminant loads. In addition, real-time, telemetered data-acquisition systems have been installed on the major tribu- taries to the San Joaquin River, at com- pliance points on the river as well as at drainage outlets from the agricultural water districts.
San Joaquin River Management The California Legislature estab- lished the San Joaquin River Manage- ment Program (SJRMP) in 1990 to identify some of the pressing water- management and water-quality prob- lems in the San Joaquin River. A Water Quality Subcommittee (SJRMP-WQS) was formed to implement solutions to these problems. The SJRMP-WQS is
[image:2.594.365.567.40.184.2]Fig. 1. Sources of total dissolved solids (TDS) contributed to the San Joaquin River for water years 1985-1994.
Fig. 2. Variation in annual TDS loading by water year, 1985-1 994.
currently made up of representatives from the California Department of Water Resources (DRW), Lawrence Berkeley National Laboratory and California Regional Water Quality Control Board. In 1994 the SJRMP- WQS was awarded a U.S. Bureau of Reclamation Challenge Grant to dem- onstrate that improved management and coordination of tributary releases and agricultural drainage contaminant loads from west-side sources could significantly reduce the frequency of violations of water-quality objectives for salinity, selenium and boron on the main stem of the San Joaquin River.
flow and water-quality parameters, using telemetry equipment to allow rapid access to current data and using computer models to make reliable forecasts of future flow and water- quality conditions. These forecasts would be useful for timing and coordi- nating west-side flows and contami- nant loads from agricultural fields, wetlands and wildlife refuges with east-side reservoir releases for salmon migration, recreation, power and wa- ter quality. The SJRMP-WQS hired Systech Engineering Inc. to design a Microsoft Windows-based user inter- face for the forecasting model. The interface was to be simple and under- standable to the novice user and ca- pable of uploading the data necessary to run the model.
The SJRMP-WQS limited the water- quality parameter of concern to electri- cal conductivity because EC can be monitored continuously with commer- cially available sensors, whereas the technology is not yet available to monitor selenium and boron concen-
trations. The U.S. Bureau of Reclama- tion Challenge Grant required that the project demonstrate the utility of the final product.
Real-time monitoring
The SJRMP-WQS identified 14 sites for continuous monitoring of flow, EC and temperature along the San
Joaquin River and its tributaries. These monitoring sites, with the type of data collected at each site, are listed below:
Primary (existing)
Mud Slough in Kesterson Wildlife Refuge, near Gustine (EC, flow, temp)
Salt Slough at Highway 165 Bridge (EC, flow, temp)
Merced River near Stevinson (EC, flow, temp)
Tuolumne River at Modesto (flow) Stanislaus River at Ripon (EC, flow) Stanislaus River at Orange Blossom Bridge (flow)
San Joaquin River at Crows Land- ing Bridge (EC, flow, temp)
San Joaquin River at Vernalis Bridge (EC, flow, temp)
Grasslands Bypass opposite Pond 7, Kesterson Reservoir (EC, flow, temp) Orestimba Creek (EC, flow)
Secondary (not yet installed) San Joaquin River at Newman Bridge (flow)
San Joaquin River at Lander Av- enue Bridge (EC, flow, temp) Patterson Irrigation District diver- sion from San Joaquin River (flow) West Stanislaus Irrigation District diversion from San Joaquin River (flow)
The first 10 stations on the list are located at primary sites that are essen- tial for water-quality forecasting (fig. 3). The last four stations are at secondary sites that will help improve the reli- ability of flow and water-quality fore- casts once they are installed.
The sensors deployed at each site collect stage, EC and temperature data. At each station, discharge is cal- culated from stage readings with the application of a rating curve, which specifies the stage-discharge relation- ship and applies any curve shifts to take account of changes in river hy- draulics or bed configuration. Dataloggers and cellular telephones are used at each station to record data at 15-minute intervals and to transmit the recorded data to computers at the USBR, DWR and the U.S. Geological Survey (USGS).
Real-time management principles
application of this strategy might be an early release of ponded water by refuges and duck clubs in the Grass- land Water District. Early release and refilling of ref- uges and duck clubs would increase the salt loading during February and reduce the average EC of the ponded water for release during March and April. This strategy might also benefit wildlife by making more food available to birds during February at the mar- gins of the draining ponds.
To improve communica- tion among individuals in- volved in decision making related to water quality on
the San Joaquin River, the SJRMP- WQS set up an electronic listserv on a USBR DataGeneral workstation. The listserv forwards e-mail sent by one person to everyone who has sub- scribed to the service. The listserv cur- rently has more than 60 subscribers representing more than 15 agencies and organizations. Information posted on the listserv includes weekly up- dates of past flow and water quality on the San Joaquin River, current water-quality forecasts, notices of meetings and experiments and notices of major actions that might affect flow or water quality.
SJRIODAY model
The decision-support system devel- oped by the SJRh4P-WQS contains a graphical user interface and a daily mass-balance model that calculates
daily flows and concentrations of total dissolved solids (TDS), boron and sele- nium for a 60-mile reach of the San Joaquin River from Highway 165 to Vernalis. The original version of the model, SJRIO, and the database cre- ated to run the model were used in de- veloping water-quality objectives and in evaluating agricultural drainage re- duction strategies to meet these objec- tives. The SJRIO was modified to run on a daily time step so that it could be used with real-time flow and water- quality data on the San Joaquin River. An extensive database has been as- sembled, with data for water years 1977 through 1996, to run the model.
tains the following tributary river segments:
The daily model, SJRIODAY, con-
Site H: The San Joaquin River upstream from the confluence with the Merced
River.
5 miles of the Merced River below the USGS gauging station near Stevinson
15 miles of the Tuolumne River be- low the USGS gauging station at Modesto
9 miles of the Stanislaus River be- low the DWR gauging station near Ripon
6 miles of Salt Slough below the USGS gauging station near Stevinson
[image:4.594.174.584.25.282.2]9 miles of Mud Slough below the USGS gauging station near Gustine Several miles of three west-side tributaries: Del Puerto, Orestimba and Hospital/Ingram creeks
Fig. 4. Assimilative capacity for daily TDS in the San Joaquin River near Vernalis, 1993.
[image:4.594.31.305.563.699.2]Site N: San Joaquin River at Crows Landing Bridge. The box contains a datalogger for the sensors, which measure electrical conductivity and height of the river.
Daily flow cal- culations use the concept of mass balance and the assumption of fixed lag times between tributary nodes on the main stem of the San Joaquin River. Both his- torical and cur- rent real-time data are used to establish initial conditions for model runs and to generate a 2-
week forecast of flow and EC. The va- lidity of the first week can be judged based on real-time data available for the San Joaquin River at Crows Land- ing and Vernalis. Discrepancies be- tween modeled and observed data can then be used to update and correct in- put data for the next model run.
Forecasted rainfall can be used to account for additional runoff in the ba- sin. Real-time data is supplemented by mean monthly flow and water-quality data for model components for which no real-time data is available, includ- ing groundwater, riparian and appro- priative diversions, surface and sub- surface agricultural return flows, riparian evapotranspiration, evapora- tion and precipitation. These compo- nents are estimated in the model based on seasonal variability and water-year classification provided by the modeler.
Model results for this 2-week pe- riod represent a model estimate of flow and water-quality conditions based on forecasted data. Validity of these results cannot therefore be judged at the time the run is made; re- sults can be judged only as real-time data become available. For the end user to appraise the validity of the model, flow and EC forecasts for ma-
jor model inputs and other model as- sumptions are provided, together with model results.
Results from model runs were posted 2 weeks in arrears during 1996, providing a retrospective of model performance and allowing the SJRMP- WQS to develop a working knowledge of operations in the San Joaquin sys- tem. To provide time for users to evaluate the merits of the model and to prevent them from acting in an un- coordinated manner on the informa- tion provided, water-quality forecasts have not been made available to users immediately.
Graphical user interface
There are two versions of the graphical user interface (GUI). The general version for water operators has the capabilities to edit and upload operational schedules of reservoir re- leases, to download the results of com- puter runs using the forecasting model and to display the output from these runs. This version does not allow the user to make a full model run. The full version of the GUI has the same capa- bilities as the operators’ version but also allows the user to download
monitoring data and to run the fore- casting model SJRIODAY. Weekly water-quality forecasts for the San Joaquin River have been made by the SJRMP-WQS since January 1996.
The GUI is typically used to make flow and water-quality forecasts ac- cording to the following sequence of operations:
1. Acquire operational schedule from water managers, including reser- voir operators, wetland managers, ag- ricultural water district managers and fishery biologists who are responsible for setting fish flow schedules.
2. Acquire real-time flow and water- quality data by telemetry to serve as ini- tial conditions for the water-quality model.
3. Forecast water-quality condi- tions with SJRIODAY, using the fore- casted operational schedule obtained in (1) and the initial conditions ob- tained in (2).
conditions to show pulses of water passing various points in the San Joaquin River.
5. Evaluate whether the water-qual- ity objectives are met at various points and times.
6. Display the assimilative capacity of the San Joaquin River for salt at various locations and times.
7. Provide information to water managers to help adjust operating schedules to meet water-quality objec- tives. Alert other managers to these operational changes and redo forecast of water-quality conditions.
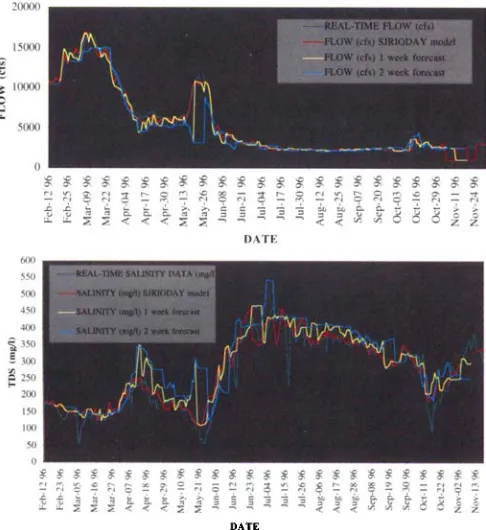
Model results and forecasts Forecasts of flow and water quality at Vernalis have been made weekly since November 1995 and a postaudit of forecast accuracy has been broad- cast on the electronic listserv, compar- ing the forecasts with observations ob- tained from the real-time monitoring system. Figures 6 and 7 show the per- formance of the forecasting model for predicting flow and TDS at Vernalis. As might be expected, the observed and model-simulated flows at Vernalis and the observed and simulated TDS concentrations and assimilative ca- pacities are in closer agreement for the 1-week forecast than for the 2-week forecast. The model performed well during most of 1996 and in particular during the summer months, when flows and water quality on the San Joaquin River were dominated by ag- ricultural drainage from Mud and Salt sloughs (fig. 6). In general, the model tends to overestimate flow as well as EC.
DATE
Fig. 6. Comparison of model forecasts and real-time flow and salinity data, 1996.
[image:7.594.36.279.49.314.2]DATE
Fig. 7. Comparison of model forecasts and real-time flow and salinity data, 1997.
during this period made the EC some- what easier to predict with accuracy. Model and forecast EC are not signifi- cantly different from the real-time EC data (fig. 7).
Case study
During early January 1996 the Grassland Water District, which had acquired supplemental water under the Central Valley Project Improve- ment Act, sought an early release of ponded water to reduce the 1i.kelihood of downstream salinity impacts and salinity objective violations at Vernalis in the San Joaquin River. The water district requested that the SJRMP- WQS forecast the most advantageous
Fig. 8. Flow and EC in the San Joaquin River near Vernalis showing period of peak wetlands discharge, Jan. 1 CFeb. 29, 1996.
time to make this release. A model forecast made on Jan. 15,1996, sug- gested that the combination of high river flows and an imminent rainstorm might provide the necessary assimila- tive capacity.
The peak wetland release was timed to coincide with the peak flow in the San Joaquin River. Wetland flushing began on Jan. 18 and ended on Feb. 19, with the peak wetland dis- charge occurring on Jan. 27 (fig. 8). The flow at Vernalis was 2,600 cfs on Feb. 18, and the EC peaked at 806 pS/ cm on Jan. 20 before the arrival of the wetland discharge water. The peak discharge at Vernalis was 5,300 cfs on Feb. 1; the EC at Vernalis declined to 222 pS/cm on Feb. 19 (fig. 8). Because of the rainfall-runoff events in the up- per watershed, assimilative capacity was positive in the river throughout the simulation period. The EC objec- tive in the San Joaquin River was achieved during the trial period as well as during the regular wetland dis- charge period in March and April 1996.
Future work
water-quality forecasts could be im- The accuracy of San Joaquin River
proved with additional continuous- flow and water-quality monitoring stations in both agricultural water dis- tricts and wetland areas in the Grass- lands Basin. A greater challenge will be to gain the cooperation of the east- side reservoir operators, wetland wa- ter managers and agricultural water districts in manipulating their release schedules. Each institution has its own operating rules that are followed to satisfy the needs of its clients and cus- tomers. At the present time, there are few incentives or requirements for these institutions to assist in water- quality management of the San Joaquin River. Policy changes and financial in- centives may be needed to foster coop- eration from these institutions.
N . W.T. Quinn is Staff Geological Scien- tist, Lawrence Berkeley National Labora- tory, and Water Resources Engineer,