Spontaneous grafting of nitrophenyl groups on amorphous carbon thin films: A structure-reactivity investigation
Journal: Chemistry of Materials
Manuscript ID: cm-2011-030262.R1
Manuscript Type: Article
Date Submitted by the Author: n/a
Complete List of Authors: Cullen, Ronan; Trinity College Dublin, School of Chemistry
Jayasundara, Dilushan; Trinity College Dublin, School of Chemistry Soldi, Laura; Trinity College Dublin, School of Chemistry
Cheng, Jayce; Trinity College Dublin, School of Chemistry Dufaure, Gaelle; Trinity College Dublin, School of Chemistry Colavita, Paula; Trinity College Dublin, Chemistry
1
Spontaneous grafting of nitrophenyl groups on
amorphous carbon thin films: A structure-reactivity
investigation
Ronan J. Cullen,a Dilushan R. Jayasundara,a Laura Soldi,a Jayce J. Cheng, a Gaelle Dufaure, a,
and Paula E. Colavita.a, *
a - School of Chemistry, University of Dublin Trinity College, College Green, Dublin 2, Ireland.
*
Corresponding author. E-mail: colavitp@tcd.ie.
ACS Paragon Plus Environment
2 Abstract
Amorphous carbon materials find numerous applications in diverse areas ranging from implantable
biodevices to electronics and catalysis. The spontaneous grafting of aryldiazonium salts is an important
strategy for the modification of these materials and it is widely used in order to display a range of
functionalities or to provide anchoring groups for further functionalization. We have investigated the
spontaneous attachment of 4-nitrobenzenediazonium salts from aqueous solutions onto amorphous
carbon materials that differ in their sp2 content with the aim of understanding to what extent bulk
composition affects rates and yields of aryldiazonium adsorption at the carbon/solution interface.
Amorphous carbons were deposited in the form of thin films via reactive magnetron sputtering, and
were characterized using a combination of Raman, infrared, UV-Vis and X-ray Photoelectron
Spectroscopy in order to determine their sp2 content. Attenuated Total Internal Reflection Fourier
Transform Infrared spectroscopy (ATR-FTIR) was used to monitor in situ and in real time the
aryldiazonium adsorption process at the carbon/solution interface. These measurements demonstrate that
rates and yields of adsorption for the same aryldiazonium salt increase non-linearly vs. sp2
concentration. Studies of aryldiazonium salt grafting as a function of time carried out ex situ via cyclic
voltammetry showed that the amorphous carbon film with highest sp2 content displays significantly
lower grafting yields than glassy carbon, a material with 100% sp2 content. Intercalation experiments
using 4-nitrobenzylamine suggest that the difference in relative density of graphitic edge planes exposed
at the carbon surface is in excellent agreement with the observed relative grafting yields. We discuss the
implications of these results for the development of structure/reactivity relationships that can be
leveraged for understanding the surface chemistry of disordered carbon materials.
Keywords: diazonium, nitrophenyl, p-nitrobenzene diazonium, amorphous carbon, electron transfer,
ATR-FTIR.
ACS Paragon Plus Environment
3 1. Introduction
Carbon materials and coatings are widely used for a vast range of applications, from charge storage to
catalyst supports, structural components, and medical implantable devices. Many of these applications
rely on the ability to control the interfacial properties of carbon, especially surface chemistry and
reactivity. For instance, O-containing surface groups are known to play an essential role in
electrocatalysis at carbon electrodes, while N-containing groups are known to be responsible for the
catalytic activity of carbons in oxidation reactions.1 Surface groups on carbon scaffolds are also used as
anchoring points for biomolecules or nanomaterials in order to achieve complex functionality.2-4 Finally,
adsorbed or chemisorbed molecules with electron accepting/donating groups can be used to modulate
the electronic properties of carbons.5-10 The wide range of functions that can be fine tuned via surface
chemistry has therefore generated great interest, not only in developing new functionalization strategies,
but also in achieving a fundamental understanding of what factors control surface reactivity at carbon
substrates.
The development of structure-reactivity relationships between physical and chemical properties of
carbon and their surface reactivity can lead to significant progress towards the design of functional
carbon based materials and devices. For example, Strano and co-workers have developed
structure-reactivity relationships for carbon nanotubes by investigating the rate of their surface reaction with
aryldiazonium salts. They have shown that, compared to semiconducting tubes, metallic nanotubes
display faster reaction rates with substituted benzenediazonium salts and they have developed a kinetic
model to explain the relationship between nanotube electronic properties and reaction rates.11-13
Researchers have leveraged this selective surface reactivity for preparative separation of nanotubes14,15
and for improving the performance of nanotube-based electronic devices.16,17 More recently, the rate of
aryldiazonium reactions at graphene single and multilayers has been investigated and observed rates
have been rationalized in terms of the electronic properties of graphene nanostructures.18-20
Amorphous carbons in the form of micro- and nanoparticles or thin film materials are of great
technological importance and are currently used in a number of applications, ranging from biomedical
ACS Paragon Plus Environment
4 devices to sensors and electronics; however, very little is known about the interplay between their bulk
properties and their surface chemistry. These materials present an interesting surface chemistry problem
because their bulk structure is heterogeneous, typically described as a mixture of sp2 clusters embedded
in an sp3 matrix, with electronic properties ranging from semimetallic to semiconducting.21-23 Although
the surface chemistry of disordered carbons would be expected to range from graphite-like to diamond-
or polymer-like when varying their composition, it is not yet clear to what extent surface reactions are
affected by composition heterogeneity. Pronounced effects of bulk composition on surface reactions
were observed by Hamers and co-workers for the photochemical grafting of alkenes,24-26 thus suggesting
that carbon composition/structure can indeed affect surface reactivity. Similarly, Downard and
coworkers showed that glassy carbon and pyrolyzed films displayed marked differences in reactivity
towards aryldiazonium grafting.27 These reports therefore suggest that carbon structure affects reaction
rates at their surface and that, likewise, it should be possible to use surface reactions as a tool to
characterize the surface of disordered carbons, as previously achieved for nanomaterials such as
graphene and nanotubes.
In this work we investigated the rate of the spontaneous reaction of aryldiazonium salts on amorphous
carbons of varying sp2/sp3 composition. This reaction is one of the most popular approaches to the
covalent functionalization of carbons28 and has been shown to result in carbon/aryl layers on ordered
carbon materials such as graphite,29 diamond,30 nanotubes11,31 and graphene,20,32 as well as on
disordered carbons.33-35 We have used a combination of electrochemical and spectroscopic techniques in
order to correlate surface composition to reactivity in disordered carbons of varying sp2/sp3 composition.
Also, we report the first in situ, real time studies of the grafting kinetics of aryldiazonium at the
carbon/solution interface using non-conductive carbon substrates. To our knowledge, this is the first
study that directly correlates reaction rates of aryldiazonium grafting to surface composition and sp2/sp3
content in disordered carbons. Our results show that sp2 content at the carbon surface positively
correlates with aryldiazonium reaction rates, thus suggesting a potentially new approach to the
characterization of the surface chemistry of these materials.
ACS Paragon Plus Environment
5 2. Experimental Section
Chemicals and Materials. Dichloromethane (Fisher, analytical grade), acetonitrile (Sigma, reagent
grade), acetone (Sigma, reagent grade), and methanol (Sigma-Aldrich, semiconductor grade) were used
without further purification. Hexaammineruthenium(III) chloride (Aldrich), potassium ferricyanide
(Aldrich) potassium chloride (Sigma-Aldrich), sulfuric acid (Sigma-Aldrich, concentrated), and
hydrogen peroxide (Sigma-Aldrich, 30%) were used as received. Spontaneous grafting of carbon
substrates was performed with nitrobenzenediazonium tetrafluoroborate (pNBD, Aldrich).
4-nitrobenzylamine (4-NBA) was prepared from 4-4-nitrobenzylamine hydrochloride salt (Aldrich)
according to published protocols.36
Deposition of Amorphous Carbon Films. Amorphous carbon films with thickness ranging between
80 and 100 nm were prepared via DC-magnetron sputtering (Torr International, Inc.) at a base pressure
≤2×10⁻⁶ mbar and a deposition pressure of 7×10⁻³ mbar. All depositions were performed with the substrate at 100 °C. Three distinct films were prepared by varying the H2/Ar gas content while
sputtering. One type of film was sputtered in an Ar atmosphere and shall be referred to as a-C from here
on in. The two remaining films were hydrogen doped via H2 introduction during deposition at
concentrations of 1.4 and 10 % and shall respectively be referred to as a-C:H1 and a-C:H2.
Sputter-coating was performed on quartz (UQG Optics) slides for UV-Vis measurements, on silicon
wafers for infrared and Raman spectroscopy, and on stainless steel substrates for electrochemical
characterization. All substrates, with the exception of stainless steel, were cleaned prior to deposition
using piranha solution; this solution was made by mixing H2SO4 and H2O2 in a 3:1 ratio (Caution:
piranha solutions react violently with many organic materials and should be handled with extreme
care). Stainless steel was cleaned via sonication in deionized water, acetone and methanol.
Surface modification of carbon substrates. pNBD layers were deposited from 6×10⁻⁴ M aqueous
solutions of pNBD over times ranging between 5 s and 3 h. Prior to functionalisation, GC substrates
(SPI-Glas™ 11 Grade) were polished with 0.3 µm alumina slurry (Buehler), rinsed with water,
ACS Paragon Plus Environment
6 immersed 20 s in piranha to remove the polishing debris layer,37 rinsed with abundant water and finally
annealed under N2 for 1 h at 500 °C. Amorphous carbon films were used as deposited. After pNBD
functionalisation samples were washed and sonicated in dichloromethane and acetonitrile in order to
remove any physisorbed material prior to ex situ characterization. 4-NBA intercalation experiments
were carried out, according to published protocols,36 by immersing the carbon substrates in 6×10⁻⁴ M
4-NBA solutions in acetonitrile for 2 h under stirring (intercalation experiments as a function of time
showed that 4-NBA surface coverage reaches a steady state value after 1 h of immersion for both GC
and a-C substrates). Samples were rinsed with abundant acetonitrile and dried prior to ex situ
characterization via cyclic voltammetry.
Characterization of Amorphous Carbon Films. UV-Vis transmission measurements of amorphous
carbon films were obtained from samples deposited on quartz substrates over the wavelength range
300-890 nm at 1 nm resolution (Shimadzu UV-2401 PC). Atomic Force Microscopy (AFM, NT-MDT)
measurements were carried out in tapping mode with a frequency of 0.5 Hz and 512 scan lines; RMS
roughness values were calculated over 10×10 µm2 boxes. Raman spectra were collected on a
micro-Raman system (Renishaw 1000) equipped with a CCD camera and a Leica microscope. The 514 nm line
of an Ar+ laser was used as the excitation source. A grating with 1800 lines/mm was used for all
measurements, providing a spectral resolution of ~1 cm-1. Spectra were collected in extended mode with
20 s exposure time, 5 accumulations, and a laser power of 1 mW to avoid laser burning of the carbon
films.
FTIR spectra were collected on a Bruker Tensor 27 FTIR Spectrometer at 4 cm-1 resolution. All three
types of amorphous carbon films were deposited on undoped silicon substrates in order to obtain their
transmission spectra, or on Si trapezoids in order to perform ATR-FTIR measurements (see below).
X-ray photoelectron spectroscopy (XPS) characterization was performed on an ultra-high vacuum
system (Omicron) at 1×10⁻¹⁰ mbar base pressure, equipped with a monochromatized Al Kα source
(1486.6 eV) and a multichannel array detector. Spectra were recorded with an analyzer resolution of
0.5 eV at 45° take-off angle. Peaks were fitted to Voigt functions after Shirley background
ACS Paragon Plus Environment
7 correction38,39 using commercial software (Igor Pro); atomic ratios were obtained from area ratios using
sensitivity factors (C = 0.296; O = 0.711).
Cyclic voltammetry (CV) was performed with a three-electrode setup (CHI660C potentiostat) using Pt
wire and Ag/AgCl as counter and reference electrodes (IJ Cambria), respectively. A home-built Teflon
cell was used, in which a Viton o-ring was pressed against a-C or glassy carbon (GC) working
electrodes, thus defining a constant electrode area. For electrochemical measurements, sputtered carbon
working electrodes were deposited on stainless steel foils. Measurements were performed at room
temperature in Ar purged solutions containing 0.001 M K3Fe(CN)6 or [Ru(NH3)6]Cl3, and 0.1 M KCl or
H2SO4 as supporting electrolytes, depending on the specific experiment.
Real-time characterization of reactions at the carbon/aqueous interface. The in situ monitoring of
the spontaneous grafting of pNBD onto a-C films was performed using a custom-built ATR-FTIR setup.
The internal reflection element was made from 1245 µm thick, double side polished, undoped silicon
wafers (Virginia Semiconductors, resistivity > 100 Ω-cm). A rectangular piece approximately 2.5×1 cm2 in size was cleaved and polished at 45° to fabricate trapezoids for ATR experiments. The trapezoid was
sputter coated on its longest face with a-C, a-C:H1 or a-C:H2 films depending on the experiment. A
PDMS gasket was used to seal the carbon side of the trapezoid forming a liquid cell. Background
spectra were collected via injection of deionized water; afterwards, a degassed 1×10⁻⁴ M pNBD aqueous
solution was injected into the cell. Spectra were collected at regular time intervals after injection; a
minimum of 50 scans at 4 cm-1 resolution were averaged for each time point over the course of 3 h.
Upon completion of the grafting experiment a 0.2 M aqueous KNO3 solution was injected into the cell;
the N—O stretching peak of the nitrate anion at 1348 cm-1 was used to normalize all spectra, in order to
correct for differences in optical pathlength. Normalized adsorption curves were analyzed using
commercial software (Igor Pro) as described in detail in the Supporting Information.
ACS Paragon Plus Environment
8 3. Results
3.1 Characterization of amorphous carbon films
In order to investigate the role played by the composition of amorphous carbon films in the rate of
pNBD grafting we investigated the spontaneous grafting of pNBD on three carbon substrates with
different sp2 content. Figure 1a shows the Raman spectra of the three different films used for our
experiments: a-C, a-C:H1 and a-C:H2. The Raman spectrum of glassy carbon, a noncrystalline 100% sp2
reference material,40 is shown in the Supporting Information for comparison. All substrates show the D
and G bands characteristic of disordered carbon materials.22 The D mode centered at 1350 cm-1, has
been attributed to the breathing of aromatic carbon rings in graphitic clusters;41 this mode is
symmetry-forbidden in perfect graphite but becomes active in the presence of disorder. The G mode is centered
between 1550 and 1630 cm-1 and arises from the in-plane bond-stretching of sp2 carbon atoms in either
aromatic rings or olefinic chains.41
D and G peak positions, intensities and FWHMs have been shown to depend on the sp2/sp3
composition of amorphous carbon films. A fit of the D and G peaks with Lorentzian and
Breit-Wigner-Fano lines, respectively,42,43 for a-C films used in our experiments yielded a G peak position of 1555
cm-1 and a peak height ratio I(D)/I(G) of 0.34. The three-stage model proposed by Ferrari and
Robertson41 for correlating G peak positions and I(D)/I(G) ratios to sp2 content, suggests that a-C carbon
films have an sp2 content in the range 85-90%.
Raman spectra of hydrogenated films display D and G bands over a significant background intensity.
This background is a common feature in hydrogen-doped films; it is caused by photoluminescence (PL)
due to hydrogen saturation of nonradiative recombination centers44,45 and typically increases with
H-content.46,47 a-C:H2 samples were found to have the highest PL intensities, thus confirming that higher
H2 partial pressures during deposition led to increased hydrogen incorporation into the films. The
presence of a significant D peak contribution for a-C:H1 samples shows that sp2 centers are still
organized in aromatic rings.22 Total sp2 as well as graphitic sp2 contents appear to be greatly reduced in
a-C:H2 samples, given the small D and G peak signals obtained under similar conditions.
ACS Paragon Plus Environment
9 Raman and Infrared spectroscopy can provide semiquantitative information on the hydrogen content
in a-C:H1 and a-C:H2 films.44,46,47 In order to directly compare our results with existing models for the
interpretation of Raman spectra of hydrogenated carbons, D and G bands were fitted with Gaussian
lines46,47 yielding a G peak position at 1560 cm-1 for both samples, and I(D)/I(G) ratios of 0.63 and 0.20
for a-C:H1 and a-C:H2, respectively. The PL slope normalized to the G peak height at 514 nm
excitation, indicated as m/I(G), can be used to estimate the H content of our films, which was found to
vary in the range 30-32% for a-C:H1 and 40-57% for a-C:H2, depending on the choice of empirical
model used for the calculation.46,47 The G peak position value and I(D)/I(G) ratio of a-C:H1 samples
shows an excellent agreement with empirical trends observed by Ferrari and Robertson for hydrogenated
carbons;48 we therefore used their results to estimate an sp2 content in the range 60-70% for a-C:H1
samples.22,48 This was not possible in the case of a-C:H2 samples due to their extremely high hydrogen
content, since single wavelength Raman models tend to work best for H-content in the range 20-40%.44
Figure 1b shows infrared spectra of a-C, a-C:H1 and a-C:H2 samples in the C—H stretching region;
spectra were normalized by film thickness in order to obtain an absorptivity value α. The spectra of
a-C:H1 and a-C:H2 display a broad contribution centered at approximately 2900 cm-1 which is assigned to
both sp3 (2800 - 2975 cm-1) and sp2 (2975 - 3000 cm-1) C—H stretching modes.22 The absence of
contributions above 3000 cm-1, which are typically assigned to aromatic C—H stretching modes,22
indicates that the vast majority of hydrogen atoms are bonded exclusively to sp3 or olefinic sp2 centers in
the film. The a-C sample, as expected, does not display C—H stretching absorption peaks (the sharp
peaks observed in the spectrum are due to residual water vapor in the sample compartment). The
integrated areas associated to C—H stretching absorptions can be used to obtain relative estimates for
bonded hydrogen contents, which were found to be in the ratio 1.9 : 1 for a-C:H2 : a-C:H1.
An increase in H content is usually accompanied by a decrease in the sp2 content in amorphous
carbons due to the saturation of sp2 centers via formation of C—H bonds. It is possible to qualitatively
examine changes in sp2 content by obtaining Tauc bandgap (ET) values for all three carbon films:23,49 ET
values have been found to increase linearly as sp2 content decreases, while being largely independent
ACS Paragon Plus Environment
10 from H-content that does not lead to changes in hybridization (e.g. interstitial hydrogen).22 Tauc
bandgap values for a-C, a-C:H1 and a-C:H2 were found to be 0.6 ± 0.15, 1.1 ± 0.2 and 1.7 ± 0.2 eV,
respectively (see Supporting Information).50,51 These results therefore indicate that sp2 content varies in
the order a-C > a-C:H1 > a-C:H2; furthermore, based on experimentally identified trends of ET vs. sp2
content,22,41 a-C and a-C:H1 samples can be estimated to have sp2 contents of 85-90% and 55-65%.
XPS spectra were used to characterize the composition of these films.52-54 Survey scans (see
Supporting Information) show the presence of carbon (at 284 eV) and oxygen (at 532 eV) in all of the
samples, whereas the absence of any peaks around 400 eV indicates that no nitrogen is incorporated into
the films during deposition. Figure 2 shows XPS spectra in the C 1s region for a-C, a-C:H1 and a-C:H2
films; the C 1s spectrum of GC samples is reported in the Supporting Information for comparison. All
three samples display a single asymmetric peak that is characteristic of amorphous carbons. Peak
asymmetry arises from the presence of carbon atoms in sp2 and sp3 bonding configurations at binding
energies separated by 0.7-0.9 eV,54,55 from energy losses and from the presence of small amounts of
surface oxides.53,55 The main peak position in our samples gradually increases from 284.4 eV for a-C to
285.1 eV for a-C:H2 as would be expected from a decrease in sp2/sp3 ratio upon hydrogen doping. Fits
of the C 1s peak of a-C and a-C:H1 samples yielded two main contributions at 284.4 and 285.1 eV that
we assign to sp2 and sp3 carbon centers, respectively, and additional contributions at higher binding
energy that we attribute to oxidised groups. The C 1s spectrum of a-C:H2 was fitted with three peaks,
one at 285.1 eV assigned to sp3 carbons and a two additional ones at higher binding energy. The relative
area contribution of the sp3 peak has been shown to provide good estimates for the bulk concentration of
sp3 centers.54 In the case of our samples the relative peak area A(285.1)/ATOT was found to be 20 ± 4%,
38 ± 11% and 83 ± 4% for a-C, a-C:H1 and a-C:H2, respectively. These values are consistent with
estimates of bulk sp2 content of 85-90% and 55-70% for a-C and a-C:H1 obtained from Raman and ET
values (see above). The oxygen content was found to be approximately 9% for all of the carbon surfaces
used in our experiments (see Supporting Information for a summary of individual O/C% values).
ACS Paragon Plus Environment
11 Finally, surface morphology is important in order to compare the rate of reactions occurring at
surfaces, we therefore characterized the roughness of the carbon surfaces via Atomic Force Microscopy
(AFM). All amorphous carbons used were found to be quantitatively similar, with RMS roughness
values for films deposited on polished Si wafers of 1.8 ± 0.6, 1.8 ± 0.1 and 2.9 ± 0.6 nm, for C,
a-C:H1 and a-C:H2, respectively.
3.2 In situ spectroscopic characterization of pNBD adsorption rate
In order to investigate whether amorphous carbon composition affects pNBD adsorption rates we
performed ATR-FTIR spectroscopy measurements. This technique can be used to monitor in situ, the
growth of films on surfaces;56 in our case, carbon-coated Si trapezoids were mounted in the liquid cell
with the carbon coated side exposed to the liquid in order to monitor spectroscopic changes at their
interface.57
Background spectra were collected at the beginning of each run with water in the cell; after injection
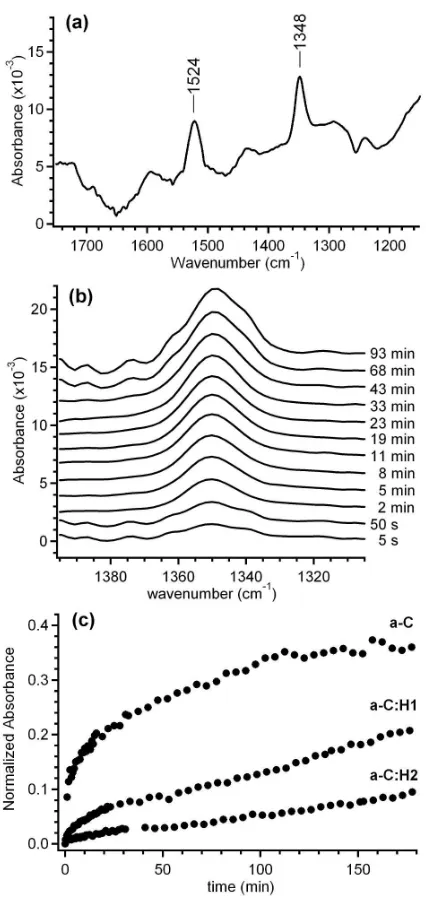
of pNBD, spectra were collected for 3 h. Figure 3a shows an example of a raw absorbance spectrum
obtained from a pNBD-grafted a-C film after 120 min. The two peaks at 1524 and 1348 cm-1 are
assigned to the asymmetric and symmetric stretching modes of the nitro group. Control experiments on
bare Si trapezoids immersed in pNBD solutions showed that, at the same bulk pNBD concentrations
used for our experiments, the absorbance contribution of molecules in solution could not be detected.
Therefore, the peaks observed in Figure 3a originate from an excess of pNBD molecules at the carbon
surface, and any increase observed in –NO2 absorbances were exclusively attributed to an increase in
adsorbed nitrophenyl groups.
The net absorbance of the symmetric N=O stretching at approximately 1348 cm-1 was used to monitor
the deposition of pNBD over time. The symmetric mode was chosen because it is the least affected by
interference from atmospheric water vapour peaks, thus facilitating the analysis. Figure 3b shows a
representative time evolution of the 1348 cm-1 line after injection of a 1×10⁻⁴ M pNBD solution into the
ATR-FTIR cell using a-C coated trapezoids. The net absorbance at ~1348 cm-1 was calculated for every
ACS Paragon Plus Environment
12 spectrum, normalized by the cell pathlength and plotted as a function of deposition time, thus allowing
for an analysis of the relative pNBD grafting rates and yields on all a-C films. Figure 3c shows typical
curves for the surface modification of a-C, a-C:H1 and a-C:H2 films from 1×10⁻⁴ M aqueous pNBD
solutions. Figure 3b indicates that the adsorption yield at any time during deposition is highest for a-C
and decreases in the order a-C > a-C:H1 > a-C:H2. This result suggests that a decrease in sp2/sp3 ratio
leads to decreased deposition yields under the same experimental conditions.
Figure 3c shows that at early times there is a rapid increase in pNBD surface coverage; this rapid first
step is followed by a much slower rate of accumulation thus suggesting the presence of at least two
phases in the adsorption kinetics. This observation is in agreement with previous work by Lehr and
Downard,35 who identified two similar deposition regimes during spontaneous grafting of pNBD on
glassy carbon via open circuit potential measurements. For a-C samples, pNBD adsorption levels off
after approximately 120 min, whereas for hydrogenated samples the adsorption process continues
beyond 3 h.
In order to obtain a relative measure of the initial rate of adsorption of pNBD at different carbon
surfaces, we carried out straight line fits of the normalized adsorption curves obtained via ATR-FTIR in
the region 0-1 min (see Supporting Information). Figure 4 shows a summary of rates obtained from
linear fits of the earliest deposition regimes; the rate constants are displayed vs. the ET value of the
associated carbon sample. The results summarized in Figure 4 show a strong dependence of adsorption
rates on ET; given the linear correlation between ET values and sp2 bulk content in amorphous carbons,22
our results suggest a decrease in rate with decreasing sp2 content in the carbon bulk.
3.3 Electrochemical characterization of spontaneous pNBD grafting
ATR-FTIR measurements provide relative measurements of pNBD deposition rates in situ and in real
time for three forms of amorphous carbons, however, it is useful to quantitatively compare these results
with those obtained on a reference material with 100% sp2 content. Therefore, we carried out
electrochemical studies of pNBD deposition at glassy carbon and at amorphous carbon films deposited
ACS Paragon Plus Environment
13 on stainless steel substrates. The grafting of pNBD and other aryldiazonium salts on glassy carbon (GC)
has been studied extensively in the literature; hence, we used GC electrodes as a reference substrate in
order to compare results obtained at a-C electrodes. GC is a highly graphitic material58,59 consisting of
100% sp2 carbon and is therefore a useful term of reference for understanding the role of sp2 centers on
the grafting process. The grafting of pNBD on the different carbons was investigated via cyclic
voltammetry by examining the electroreduction of nitrophenyl to phenylamine groups. The yield of the
grafting reaction was determined at different deposition times by measuring the area-normalized charge
required for the electroreduction of surface bound ArNO2 moieties.33,60-62
First, we tested whether sputtered carbon films could be used as working electrodes for cyclic
votammetry (CV) experiments by investigating their electrochemical response in solutions containing
Ru(NH3)63+/2+ and Fe(CN)63-/4-, two reversible redox couples which are often used for evaluating the
response of carbon electrodes.63 The CV obtained at 0.075 V s-1 for unmodified a-C in these solutions
(see Supporting Information) displays the characteristic redox waves of Ru(NH3)63+/2+ and Fe(CN)63-/4-,
with nearly reversible peak-to-peak separations of 72 ± 2 and 76 ± 5 mV, respectively. The peak current
of these CVs was found to vary linearly with the square root of the potential sweep rate, thus suggesting
that a-C electrodes display reversible response.64 Hydrogenated samples a-C:H1 and a-C:H2 were found
to be too resistive to be used as working electrodes and could not be characterized via CV.
GC and a-C electrodes were immersed in pNBD aqueous solutions in order to spontaneously graft
ArNO2 moieties on these substrates. At regular time intervals the carbon samples were removed from
the deposition solution, rinsed and characterized via CV in 0.1 M H2SO4solutions. Figure 5a shows a
typical CV obtained in 0.1 M H2SO4 at 0.2 V s-1, on a-C electrodes after spontaneous grafting in 6×10⁻⁴
M pNBD solutions. The CV displays an irreversible reduction peak at -0.54 V vs. Ag/AgCl that is
characteristic of nitrophenyl reductions,62 a 6e- reduction process.60 The near complete absence of the
reduction peak after a second sweep indicates that the majority of nitrophenyl groups are reduced during
the first cycle. The appearance of a reversible couple at E1/2 = 0.32 V on the oxidative sweep is
ACS Paragon Plus Environment
14 attributed to the hydroxyaminophenyl/nitrosophenyl interconversion; this peak, therefore, indicates that
not all of the nitrophenyl groups undergo a full 6e- reduction to aminophenyl groups.
The total charge passed during nitrophenyl reduction and hydroxyaminophenyl oxidation can be
obtained via peak integration and normalized to the electrode area, in order to yield the surface coverage
of nitrophenyl groups present at the carbon surface, ΓNP.62 Figure 5b shows ΓNP values thus calculated, as a function of immersion time in 6×10⁻⁴ M pNBD on a-C and GC samples. During the first 10 min of
the deposition, ΓNP increases more rapidly for GC electrodes; after longer deposition times the value of
ΓNP levels off for both substrates. The value of ΓNP on GC after 10 min of immersion is 13.2×10⁻¹⁰ mol/cm2 whereas ΓNP on a-C substrates after the same immersion time was found to be 58% of this value, at 7.7×10⁻¹⁰ mol/cm2. Straight line fits of ΓNP curves in the range 0-1 min yielded initial rates for pNBD deposition at a-C and GC electrodes of 8.9×10⁻¹⁰ and 1.8×10⁻⁹ mol cm-2 min-1, respectively.
These differences in calculated ΓNP and initial rates at GC and a-C surfaces could originate from differences between the microscopic roughness of the two electrodes. In order to examine this
possibility we carried out AFM roughness determinations on both GC and a-C electrodes. The average
RMS roughness of GC electrodes was 5.8 ± 1.3 nm; this value is in good agreement with previous
roughness determinations of polished GC samples.65 The average RMS roughness of a-C electrodes was
found to be 16 ± 8 nm, higher than that measured on Si wafers (see above), due to the higher roughness
of the underlying stainless steel. If the observed differences in ΓNP or initial rates were due to differences in the microscopic area available for grafting, we would expect a-C electrodes to display higher apparent
ΓNP, which is the opposite of what is observed in Figure 5a. Roughness results therefore suggest that other factors must be at the origin of differences in grafting rates and yields between GC and a-C.
It has been shown that the first step in the attachment of aryldiazonium groups on carbon nanotubes
and graphene consists of a charge-transfer mediated adsorption of aryldiazonium molecules onto the
carbon surface.12,18,20 Charge transfer rates on graphitic carbon electrodes are known to strongly depend
on edge plane density, since edge sites can (a) increase the density of states near the Fermi energy and
ACS Paragon Plus Environment
15 (b) also introduce chemical groups that facilitate adsorption.63,66,67 We therefore decided to investigate
whether differences in pNBD grafting rates or yields between GC and a-C electrodes could be correlated
to differences in edge plane density. In order to do this we chose a method developed by Compton and
coworkers36,68 based on the partial intercalation of 4-NBA between graphite basal planes, a process that
takes place at exposed edge plane sites. The interlayer spacing in graphite does not allow for a full
intercalation to take place; hence, Ph–NO2 moieties remain exposed to the electrolyte at the
carbon/solution interface, and can be reduced electrochemically to yield a measure of the amount of
intercalated 4-NBA.
GC and a-C electrodes were immersed for 2 h in acetonitrile solutions of 4-NBA, then rinsed and
tested via CV. Figure 6 shows typical CVs of GC and a-C electrodes after 4-NBA intercalation obtained
in 0.1 M H2SO4 at 0.2 V s-1. Voltammetric waves are similar to those obtained with nitrophenyl groups
immobilized via diazonium chemistry. The charge associated to the electroreduction peak was integrated
in order to obtain an estimate of surface coverage for intercalated 4-NBA, ΓNBA, yielding values of (5.9
± 2.5) ×10-10 and (3.4 ± 0.9) ×10-10 mol cm-2 (95% C.I.) for GC and a-C, respectively. The value of ΓNBA
at a-C electrodes is approximately 58% of that obtained at GC electrodes, thus suggesting that ΓNP
values track the intercalation results for ΓNBA.
In summary, a comparison of pNBD grafting rates and yields between GC and a-C shows that GC
electrodes display significantly higher ΓNP than a-C electrodes under the same deposition conditions. The observed difference in coverage cannot be explained by differences in surface roughness, thus indicating
that other factors are at the origin of these results. The intercalation of 4-NBA, which is sensitive to the
density of exposed edge planes at carbon surfaces, was found to positively correlate with diazonium
grafting results. In fact, the relative ratio ΓNP(a-C)/ ΓNP(GC) = 0.58 was found to be in excellent agreement with that of ΓNBA(a-C)/ ΓNBA(GC) = 0.58. This result suggests that the surface density of graphitic edge planes at a-C amorphous carbon films is an important factor in controlling pNBD grafting
yields.
ACS Paragon Plus Environment
16 4. Discussion
The rates of spontaneous grafting of pNBD were investigated on three types of amorphous carbons
with similar roughness and oxygen content but with significantly different sp2/sp3 and hydrogen
contents. The three amorphous carbons used in our experiments possess decreasing sp2content in the
order a-C > a-C:H1 > a-C:H2; these changes in sp2 content were achieved by introducing hydrogen into
the films also resulting in an opening of the optical bandgap of these materials. The hydrogen content
increased in the order a-C < a-C:H1 < a-C:H2 as seen via infrared and Raman spectroscopy. It was
found that modifying carbon composition resulted in dramatic changes in pNBD adsorption rates, which
were compared to those observed at GC surfaces. A combination of electrochemical ex situ experiments
and spectroscopic in situ experiments shows that the pNBD adsorption yields and initial rates follow the
order GC > a-C > a-C:H1 > a-C:H2.
The mechanism of spontaneous attachment of aryldiazonium cations on carbon materials has been the
subject of intense investigation. Strano and co-workers12,13,20 developed a kinetic model in which the
first step in the covalent grafting at nanotube and graphene surfaces consists of a first order adsorption
of aryldiazonium cations via formation of a charge-transfer complex. The adsorbed complex
subsequently decomposes into the covalently bonded species losing dinitrogen. The adsorption process
was found to be sensitive to the metallic character of nanotubes, with reactivity decreasing with
increasing bandgap. This behavior was explained by considering that adsorption occurs via electron
transfer from states near the Fermi energy in the nanotubes to the acceptor level of pNBD in solution,
thus explaining the observed decrease in the rate of adsorption with an increase in nanotube bandgap.
The validity of this mechanism has not been directly probed for other types of carbon. It has been
observed that pNBD layers grafted on GC via electroreduction and spontaneous attachment have similar
structures and it has been proposed that, in both cases, grafting occurs via pNBD reduction and loss of
dinitrogen.28 The role of charge-transfer mediated adsorption, however, has not been explored in this
type of materials. The results obtained in our experiments suggest that the model developed by Strano
and co-workers for nanotubes could be valid for disordered carbons as well. Under their kinetic
ACS Paragon Plus Environment
17 hypothesis the expected reactivity trend for the spontaneous grafting would be that of decreasing
reaction rates with a decrease in the metallic character of carbon surfaces. We have observed similar
trends in our experiments, as shown by data in Figure 4 and Figure 7. Glassy carbon, which can be
described as a semimetal with near-zero optical bandgap and high conductivity,69 displayed the fastest
adsorption rates relative to a-C, a-C:H1 and a-C:H2. The second highest rate was that of a-C substrates,
which behave as good conductors and have a small optical bandgap of ~0.5 eV. Hydrogenated samples
were shown to behave as poor conductors and also display the lowest grafting rates, in agreement with
trends in spontaneous grafting on nanotubes. Importantly, the same general trend was observed
independently of whether the adsorption rates are plotted vs. bulk sp2 content (ET values) as in Figure 4,
or vs. surface sp2 content, as in Figure 7.
The optical bandgap offers a useful parameter for a qualitative evaluation of the metallic character of
amorphous carbons, however, it does not define a gap in the density of states (DOS) as in the case of
ordered semiconductors. Localized states near the Fermi energy can exist even for wide bandgap
amorphous carbons and their contribution to electron-transfer mediated adsorption reactions should be
considered in order to develop structure reactivity relationships for these materials.70 The sp2 content of
amorphous carbons should be a better parameter than ET for rationalizing reaction trends, since sp2
carbon centers contribute to π states which lie close to the Fermi energy.69 These states are directly
involved in electron transfer reactions at the surface and their role in pNBD adsorption could be
important, regardless of their degree of delocalization and their effect on ET values.
Intercalation experiments, that directly probe the exposed graphitic edge plane density provide support
for a strong positive correlation between graphitic sp2 content and pNBD grafting yields. Work by
Toupin and Belanger71 on spontaneous pNBD grafting on carbon black samples reported that the
limiting coverage of aryldiazonium is similar to their estimated value of edge plane coverage at these
carbon nanoparticles. These previous results, together with our intercalation and grafting experiments,
indicate that high graphitic sp2 content is a strong predictor of high pNBD grafting yields.
ACS Paragon Plus Environment
18 The relation between sp2 content and reaction rates is of greater complexity. Figure 7 shows a
summary of the initial rates of pNBD deposition, relative to that at a-C:H2, at the four different carbon
surfaces used in our experiments; the plot shows the dependence of rates vs. sp2 content as measured by
XPS. The relative rate of adsorption at GC, which consists of 100% sp2 carbon, was obtained from the
ex situ electrochemical measurements in Figure 5. It is clear from this graph that there is a strong
dependence of the pNBD initial attachment rate on sp2 content. A first conclusion that emerges from
Figure 7 is that a-C:H2 samples, despite having only a very small sp2 content, still show a significant
rate of attachment. This is in agreement with experimental reports that demonstrate that pNBD
spontaneously grafts at 100% sp3 surfaces,30,72 and indicates that pNBD attachment is possible, albeit at
a slow rate, even at low sp2 content. A second important observation is that the initial rate does not vary
linearly with sp2content. Assuming first order Langmuirian kinetics for the reaction and even in the case
of multilayer growth,73,74 the nitrophenyl coverage, Γ, can be approximated at t ≈ 0 as:
Γ = k Γmax [pNBD] t (1)
where Γmax is the limiting coverage, [pNBD] is the bulk concentration of pNBD and k is the rate constant. If the initial deposition rate increased with sp2 content because of an increase in sp2 sites at the
surface, then a linear dependence would be expected for Figure 7. The fact that non-linear behavior is
observed suggests that the plot in Figure 7 does not reflect solely an increase in the area covered by sp2
sites at the carbon surface.
Experimental and theoretical work on aryldiazonium electrografting at highly ordered pyrolytic
graphite (HOPG) has shown that edge planes display faster electrografting rates than basal planes.75-77
The greater reactivity of graphitic edges has been explained in terms of their effect on the carbon
valence electronic structure. Dangling π bonds at edge defects on HOPG introduce localized states,78-80
leading to a significant increase in the density of states (DOS) at the Fermi energy. It is this greater DOS
at graphite steps that gives rise to the larger double-layer capacitance and electron transfer rates of edge
vs. basal plane electrodes.63,81 The effect of sp2 sites and, more specifically, of graphitic edges on the
rate of attachment might be felt over a much larger area than the geometric area occupied at the surface.
ACS Paragon Plus Environment
19 This has been previously observed by McDermott and McCreery for the adsorption of quinones at
HOPG and GC electrodes.81 They reported that adsorption of quinones at graphitic step edges was
promoted over a vast area adjacent to the step, and concluded that the adsorption was largely controlled
by the enhanced electron density associated with the step, which acted as a perturbation over an area
vastly larger than the geometric area.
We hypothesize that the trends observed in Figure 7 could reflect changes in the carbon DOS and
consequently in the overlap between donor states at the carbon and acceptor states of pNBD molecules,
as observed by Sharma et al. for the rate of aryldiazonium grafting at graphene.20 As the amount of sp2
carbon in the films increases it is more probable for sp2 centers to give rise to graphitic clusters with
highly reactive edges exposed at the surface and a consequent increase in the DOS near the Fermi
energy.82 This mechanism could be important even in the case of highly hydrogenated samples, since
previous reports show that the sp2 centers in sputtered hydrogenated carbons are graphitic in nature.83 In
order to achieve a better understanding of the effect of sp2 concentration on spontaneous surface
reactions with aryldiazonium it would be desirable to have detailed information on the carbon DOS for
the different films such as that obtained via valence photoemission experiments.
5. Conclusions
We investigated the kinetics of adsorption of pNBD at four different carbon surfaces with drastically
different sp2 content. Infrared spectroscopic methods allowed for the first time to obtain pNBD
adsorption curves in situ and in real time, even for forms of carbon that cannot be characterized
electrochemically. We have found that the adsorption of pNBD is enhanced by an increase in the
metallic character of the amorphous carbons and that there is a strong non-linear dependence of the
initial adsorption rates on the sp2 content. We hypothesize that this is due to the increased density of
graphitic clusters with increased sp2 content in the amorphous carbon leading, in turn, to an enhanced
DOS close to the carbon Fermi energy. This is consistent with intercalation experiments showing that
grafting yields at early deposition times mirror the coverage of graphitic edge planes.
ACS Paragon Plus Environment
20 These results suggest that the kinetic model of the spontaneous grafting of aryldiazonium salts that
involves a charge-transfer mediated adsorption step is applicable not only to ordered carbon
nanomaterials, but might be extended to carbons in general. Therefore, by analogy with previous
nanotube applications, it is possible to envision leveraging spontaneous aryldiazonium reactions at
carbon surfaces as a strategy for the characterization and selection/separation of disordered carbons
based on their electronic properties. Such a methodology would be a valuable tool for the numerous
applications of disordered carbons, such as those in heterogeneous catalysis and adsorption, that rely on
their surface electronic properties.
Acknowledgements. This publication has emanated from research conducted with the financial
support of Science Foundation Ireland under Grant Number 09/RFP/CAP2174 and of the Irish Council
for Science Engineering and Technology (IRCSET) under the Postdoctoral Fellowship Scheme. JC and
GD were supported by the Science Foundation Ireland SURE programme under Grant Number
08/UR/I1351. The authors are grateful to Dr. Cormac McGuinness, Prof. Igor Shvets, Dr. Michael E.G.
Lyons, Dr. Silvia Giordani and Dr. Tania Perova for kindly providing access to instrumentation.
Supporting Information Available. Tauc plots, Raman and XPS spectra of GC, XPS survey scans
and O 1s analysis, cyclic voltammetry on bare a-C electrodes and details of fitting procedures. This
material is available free of charge via the Internet at http://pubs.acs.org.
ACS Paragon Plus Environment
21 References
1. Serp, P.; Figueiredo, J. L., Carbon Materials for Catalysis. John Wiley & Sons: Hoboken, New Jersey, 2009.
2. Sun, J. T.; Hong, C. Y.; Pan, C. Y., Polym. Chem. 2011, 2, 998.
3. Schrand, A. M.; Hens, S. A. C.; Shenderova, O. A., Crit. Rev. Solid State Mater. Sci. 2009, 34, 18.
4. Karousis, N.; Tagmatarchis, N.; Tasis, D., Chem. Rev. 2010, 110, 5366.
5. Koehler, F. M.; Luechinger, N. A.; Ziegler, D.; Athanassiou, E. K.; Grass, R. N.; Rossi, A.; Hierold, C.; Stemmer, A.; Stark, W. J., Angew. Chem., Int. Ed. 2009, 48, 224.
6. Qi, D.; Chen, W.; Gao, X.; Wang, L.; Chen, S.; Loh, K. P.; Wee, A. T. S., J. Am. Chem. Soc. 2007, 129, 8084.
7. Qi, D.; Gao, X.; Wang, L.; Chen, S.; Loh, K. P.; Wee, A. T. S., Chem. Mater. 2008, 20, 6871.
8. Wang, X. R.; Li, X. L.; Zhang, L.; Yoon, Y.; Weber, P. K.; Wang, H. L.; Guo, J.; Dai, H. J., Science 2009, 324, 768.
9. Zhou, S. Y.; Siegel, D. A.; Fedorov, A. V.; Lanzara, A., Phys. Rev. Lett. 2008, 101, 086402.
10. Nosho, Y.; Ohno, Y.; Kishimoto, S.; Mizutani, T., Nanotechnology 2007, 18, 415202.
11. Strano, M. S.; Dyke, C. A.; Usrey, M. L.; Barone, P. W.; Allen, M. J.; Shan, H. W.; Kittrell, C.; Hauge, R. H.; Tour, J. M.; Smalley, R. E., Science 2003, 301, 1519.
12. Usrey, M. L.; Lippmann, E. S.; Strano, M. S., J. Am. Chem. Soc. 2005, 127, 16129.
13. Nair, N.; Kim, W.-J.; Usrey, M. L.; Strano, M. S., J. Am. Chem. Soc. 2007, 129, 3946.
14. Baik, S.; Usrey, M.; Rotkina, L.; Strano, M. S., J. Phys. Chem. B 2004, 108, 15560.
15. Kim, W. J.; Usrey, M. L.; Strano, M. S., Chem. Mater. 2007, 19, 1571.
16. An, L.; Fu, Q.; Lu, C.; Liu, J., J. Am. Chem. Soc. 2004, 126, 10520.
17. Balasubramanian, K.; Sordan, R.; Burghard, M.; Kern, K., Nano Lett. 2004, 4, 827.
18. Koehler, F. M.; Jacobsen, A.; Ensslin, K.; Stampfer, C.; Stark, W. J., Small 2010, 6, 1125.
19. Sharma, R.; J.H., B.; C.J., P.; M.S., S., Nano Lett. 2010, 10, 398.
20. Sharma, R.; Nair, N.; Strano, M. S., J. Phys. Chem. C 2009, 113, 14771.
21. Pierson, H. O., Handbook of Carbon, Graphite, Diamond and Fullerenes - Properties, Processing and Applications 1st ed.; Noyes Publications: Park Ridge, New Jersey, 1993.
22. Robertson, J., Mater. Sci. Eng., R 2002, 37, 129.
ACS Paragon Plus Environment
22 23. Silva, S. R. P., Properties of amorphous carbon. 1st ed.; INSPEC, Inc. The Institution of Electrical Engineers: London, 2003.
24. Colavita, P. E.; Streifer, J. A.; Sun, B.; Wang, X.; Warf, P.; Hamers, R. J., J. Phys. Chem. C 2008, 112, 5102.
25. Colavita, P. E.; Sun, B.; Tse, K. Y.; Hamers, R. J., J. Am. Chem. Soc. 2007, 129, 13554.
26. Colavita, P. E.; Sun, B.; Wang, X.; Hamers, R. J., J. Phys. Chem. C 2009, 113, 1526.
27. Garrett, D. J.; Lehr, J.; Miskelly, G. M.; Downard, A. J., J. Am. Chem. Soc. 2007, 129, 15456.
28. Barriere, F.; Downard, A. J., J. Solid State Electrochem. 2008, 12, 1231.
29. Pandurangappa, M.; Lawrence, N. S.; Compton, R. G., Analyst 2002, 127, 1568.
30. Yang, W.; Baker, S. E.; Butler, J. E.; Lee, C.-s.; Russell, J. N.; Shang, L.; Sun, B.; Hamers, R. J., Chem. Mater. 2005, 17, 938.
31. Bahr, J. L.; Tour, J. M., Chem. Mater. 2001, 13, 3823.
32. Lomeda, J. R.; Doyle, C. D.; Kosynkin, D. V.; Hwang, W.-F.; Tour, J. M., J. Am. Chem. Soc. 2008, 130, 16201.
33. Adenier, A.; Cabet-Deliry, E.; Chausse, A.; Griveau, S.; Mercier, F.; Pinson, J.; Vautrin-Ul, C., Chem. Mater. 2005, 17, 491.
34. Combellas, C.; Delamar, M.; Kanoufi, F.; Pinson, J.; Podvorica, F. I., Chem. Mater. 2005, 17, 3968.
35. Lehr, J.; Williamson, B. E.; Downard, A. J., J. Phys. Chem. C 2011, 115, 6629.
36. Wildgoose, G. G.; Wilkins, S. J.; Williams, G. R.; France, R. R.; Carnahan, D. L.; Jiang, L.; Jones, T. G. J.; Compton, R. G., ChemPhysChem 2005, 6, 352.
37. Kiema, G. K.; Aktay, M.; McDermott, M. T., J. Electroanal. Chem. 2003, 540, 7.
38. Proctor, A.; Sherwood, P. M. A., Anal. Chem. 1982, 54, 13.
39. Shirley, D. A., Phys. Rev. B 1972, 5, 4709.
40. Bosman, M.; Keast, V. J.; Watanabe, M.; McCulloch, D. G.; Shakerzadeh, M.; Teo, E. H. T.; Tay, B. K., Carbon 2009, 47, 94.
41. Ferrari, A. C.; Robertson, J., Phys. Rev. B 2000, 61, 14095.
42. McCulloch, D. G.; Prawer, S., Appl. Phys. Lett. 1995, 78, 3040.
43. McCulloch, D. G.; Prawer, S.; Hoffman, A., Phys. Rev. B 1994, 50, 5905.
44. Casiraghi, C.; Piazza, F.; Ferrari, A. C.; Grambole, D.; Robertson, J., Diamond Relat. Mater. 2005, 14, 1098.
45. Robertson, J., Phys. Rev. B 1996, 53, 16302.
ACS Paragon Plus Environment
23 46. Casiraghi, C.; Ferrari, A. C.; Robertson, J., Phys. Rev. B 2005, 72, 085401.
47. Buijnsters, J. G.; Gago, R.; Jiménez, I.; Camero, M.; Agulló-Rueda, F.; Gómez-Aleixandre , C., J. Appl. Phys. 2009, 105, 093510.
48. Ferrari, A. C.; Kleinsorge, B.; Adamopoulos, G.; Robertson, J.; Milne, W. I.; Stolojan, V.; Brown, L. M.; LiBassi, A.; Tanner, B. K., J. Non-Cryst. Solids 2000, 266-269, 765.
49. Tauc, J., Amorphous and liquid semiconductors. 1st ed.; Plenum Press: London and New York, 1974.
50. Foulani, A., J. Phys. D: Appl. Phys. 2003, 36, 394.
51. Sun, B.; Colavita, P. E.; Kim, H.; Lockett, M.; Marcus, M. S.; Smith, L. M.; Hamers, R. J., Langmuir 2006, 22, 9598.
52. Kassavetis, S.; Patsalas, P.; Logothetidis, S.; Robertson, J.; Kennou, S., Diamond Relat. Mater. 2007, 16, 1813.
53. Patsalas, P.; Logothetidis, S.; Kennou, S.; Gravalidis, C., Thin Solid Films 2003, 428, 211.
54. Haerle, R.; Riedo, E.; Pasquarello, A.; Baldereschi, A., Phys. Rev. B 2001, 65, 045101.
55. Jackson, S. T.; Nuzzo, R. G., Appl. Surf. Sci. 1995, 90, 195.
56. Xing, R.; Rankin, S. E., J. Phys. Chem. B 2005, 110, 295.
57. Tolstoy, V. P.; Chernyshova, I.; Skryshevsky, V. A., Handbook of Infrared Spectroscopy of Ultrathin Films. John Wiley & Sons, Inc.: Hoboken, New Jersey, 2003.
58. Jenkins, G. M.; Kawamura, K., Nature 1971, 231, 175.
59. Brown, N. M. D.; You, H. X., J. Mater. Chem. 1991, 1, 469.
60. Delamar, M.; Désarmot, G.; Fagebaume, O.; Hitmi, R.; Pinsonc, J.; Savéant, J. M., Carbon 1997, 35, 801.
61. Allongue, P.; Delamar, M.; Desbat, B.; Fagebaume, O.; Hitmi, R.; Pinson, J.; Savèant, J.-M., J. Am. Chem. Soc. 1997, 119, 201.
62. Brooksby, P. A.; Downard, A. J., Langmuir 2004, 20, 5038.
63. McCreery, R. L., Chem. Rev. 2008, 108, 2646.
64. Kissinger, P. T.; Heineman, W. R., Laboratory techniques in electroanalytical chemistry. 2nd ed.; Marcel Dekker, Inc.: New York, 1996.
65. McDermott, M. T.; McDermott, C. A.; McCreery, R. L., Anal. Chem. 1993, 65, 937.
66. Davies, T. J.; Moore, R. R.; Banks, C. E.; Compton, R. G., J. Electroanal. Chem. 2004, 574, 123.
67. Cline, K. K.; McDermott, M. T.; McCreery, R. L., J. Phys. Chem. 1994, 98, 5314.
ACS Paragon Plus Environment
24 68. Banks, C. E.; Davies, T. J.; Wildgoose, G. G.; Compton, R. G., Chem. Commun. (Cambridge, U. K.) 2005, 829.
69. Robertson, J., Adv. Phys. 1986, 35, 317.
70. Stenzel, O., The physics of thin film optical spectra. Springer Verlag: Berlin, 2005.
71. Toupin, M.; Belanger, D., Langmuir 2008, 24, 1910.
72. Lud, S. Q.; Steenackers, M.; Jordan, R.; Bruno, P.; Gruen, D. M.; Feulner, P.; Garrido, J. A.; Stutzmann, M., J. Am. Chem. Soc. 2006, 128, 16884.
73. Masel, R. I., Adsorption II: Adsorption Isotherms. In Principles of Adsorption and Reaction on Solid Surfaces, John Wiley & Sons: New York, 1996.
74. Vinokurov, I. A.; Kankare, J., Langmuir 2002, 18, 6789.
75. Jiang, D.-e.; Sumpter, B. G.; Dai, S., J. Phys. Chem. B. 2006, 110, 23628.
76. Kariuki, J. K.; McDermott, M. T., Langmuir 1999, 15, 6534..
77. Ray, K.; McCreery, R. L., Anal. Chem. 1997, 69, 4680.
78. Kobayashi, K., Phys. Rev. B 1993, 48, 1757.
79. Giunta, P. L.; Kelty, S. P., J. Chem. Phys. 2001, 114, 1807.
80. Niimi, Y.; Matsui, T.; Kambara, H.; Tagami, K.; Tsukada, M.; Fukuyama, H., Appl. Surf. Sci. 2005, 241, 43.
81. McDermott, M. T.; McCreery, R. L., Langmuir 1994, 10, 4307.
82. Wesner, D.; Krummacher, S.; Carr, R.; Sham, T. K.; Strongin, M.; Eberhardt, W.; Weng, S. L.; Williams, G.; Howells, M.; Kampas, F.; Heald, S.; Smith, F. W., Phys. Rev. B 1983, 28, 2152.
83. Cho, G.; Yen, B. K.; Klug, C. A., J. Appl. Phys. 2008, 104, 013531.
ACS Paragon Plus Environment
Figure 1. (a) Raman spectra of the three different amorphous carbon films deposited on silicon. Spectra were recorded with a 514 nm laser line. (b) Absorption coefficient in the C—H stretching mode region obtained from infrared spectra of all three carbon films used in our experiments.
82x127mm (300 x 300 DPI)
ACS Paragon Plus Environment
Figure 2. XPS spectra of a-C, a-C:H1 and a-C:H2 films in the C 1s region; the Shirley background and individual contributions obtained from best fits are shown under each curve.
80x142mm (300 x 300 DPI)
ACS Paragon Plus Environment
Figure 3. (a) An in situ ATR-FTIR spectrum showing the N=O stretching mode region recorded after 120 min deposition on an a-C surface. (b) In situ time evolution of the symmetric N=O stretching peak at an a-C surface over 90 min, at selected times after the injection of 1×10⁻⁴ M pNBD into the ATR-FTIR cell. (c) Curves of normalized net adsorbance vs. deposition time obtained for a-C, a-C:H1
and a-C:H2 films in 1×10⁻⁴ M pNBD aqueous solutions. 82x170mm (300 x 300 DPI)
ACS Paragon Plus Environment
[image:28.612.197.410.112.562.2]
Figure 4. Initial deposition rate obtained from straight line fits in the range 0-1 min. The initial rate is expressed as the ratio ∆A/∆t (at 1348 cm-1,) and reported vs. Tauc bandgap values for each
of the samples characterized via in situ ATR-FTIR spectroscopy (error bars represent one standard deviation). Data points in the region 0.4-0.8 eV, 0.9-1.2 eV and 1.5-2.0 eV are associated to C,
a-C:H1 and a-C:H2 carbons, respectively. 80x55mm (300 x 300 DPI)
ACS Paragon Plus Environment
Figure 5. (a) Cyclic voltammogram obtained in 0.1 M H2SO4 at 0.2 V s-1 from a pNBD-grafted a-C electrode; both first (—) and second (---) scans are reported. The carbon electrode was modified via
immersion in a 6×10⁻⁴ M pNBD aqueous solution for 10 min. (b) Surface coverage of nitrophenyl groups, ΓNP, on a-C (•) and GC (○) electrodes as a function of deposition time in 6×10⁻⁴ M pNBD
solutions (dotted lines are included to guide the eye). 81x110mm (300 x 300 DPI)
ACS Paragon Plus Environment
Figure 6. Cyclic voltammetry of a-C and GC electrodes modified via partial intercalation of 4-NBA from acetonitrile solutions, obtained in 0.1 M H2SO4 at 0.2 V s-1. The electroreduction peak of
nitrophenyl groups appears at approximately -0.5 V (vs. Ag/AgCl) as in films modified via pNBD grafting.
80x59mm (300 x 300 DPI)
ACS Paragon Plus Environment
Figure 7. Summary of relative initial rates of pNBD adsorption at amorphous carbon surfaces as a function of sp2 content obtained from combining in situ and ex situ measurements. Rates are
plotted relative to that measured at a-C:H2 samples. 80x59mm (300 x 300 DPI)
ACS Paragon Plus Environment
We report for the first time in situ aryldiazonium adsorption measurements at amorphous carbon surfaces of varying composition using ATR-FTIR spectroscopic methods. Adsorption rates were
found to increase nonlinearly with an increase in the sp2 content of the films. 129x44mm (300 x 300 DPI)
ACS Paragon Plus Environment