Available online www.jocpr.com
Journal of Chemical and Pharmaceutical Research, 2013, 5(12):1222-1229
Research Article
ISSN : 0975-7384
CODEN(USA) : JCPRC5
RP-UPLC method development and validation for the simultaneous
estimation of proguanil and atovaquone in pharmaceutical dosage form
Khagga Bhavyasri
1*,
V. Murali Balaram
2, R. Nageswarao
3, D. Rambabu
4and M. Ajitha
11
Center for Pharmaceutical Sciences Department, J. N. T. University, Kukatpally, Hyderabad, A.P, India
2
Sultan Ul-Uloom College of Pharmacy, Hyderabad, A.P, India
3
Indian Institute of Chemical Sciences, Tarnaka, Hyderabad, A.P, India
4
Agilent Technologies India Pvt. Ltd, Hyderabad, A.P, India
_____________________________________________________________________________________________
ABSTRACT
A simple, rapid, and accurate reversed phase ultra-performance liquid chromatographic (RP-UPLC) method has been developed and subsequently validated for the simultaneous determination of proguanil (PRG) and Atovaquone (ATV) in combination. The separation is carried out using a mobile phase consisting of 0.05% perchloric acid and Acetonitrile. The column used is Extended C18(50 × 3.0 mm, 1.8 µm). With flow rate of 0.8 mL/min using UV detection at 257nm. The total run time is 6 min and the retention time of PRG and ATV is 1.6 minand 3.0 min respectively. The described method is linear for the assay of PRG and ATV over a concentration range of 2.5-20 µg/Ml and 6.25-50 µg/mL respectively. Results of the analysis have been validated statistically and by recovery
studies. The limit of quantitation for PRG and ATV has been found to be 0.0357 µg/mL and 0.126 µg/mL
respectively. The results of the studies showed that the proposed RP-UPLC method is simple, rapid, precise, and accurate, which is useful for the routine determination of PRG and ATV in bulk drug and its pharmaceutical dosage form.
Key words: Atovaquone, proguanil, UPLC, Simultaneous and Validation.
_____________________________________________________________________________________________
INTRODUCTION
Proguanil chemically known as 1-(4-chlorophenyl)-2-(N'-propan-2-ylcarbamimidoyl) guanidinea prophylactic antimalarial drug, Proguanil hydrochloride is marketed as Paludrine by Astra Zeneca. Proguanil, a synthetic biguanide derivative of pyrimidine,is widely used in chemoprophylaxis of malaria. It is chronically administered for malaria prophylaxis in sickle cell patients in Nigeria. The emergence of chloroquine resistant Plasmodium falciparum in our environment has led to a resurgence of interest in the use of proguanil when daily prophylaxis of malaria is indicated. In addition proguanil has found use in combination with other drugs such as atovaquone and dapsone in the treatment of resistant cases of falciparum malaria (Looareesuwan et al., 1996). This renewed interest in the use of proguanil makes it necessary to elucidate fully the pharmacokinetics of the drug in biological fluids, which requires highly sensitive, accurate and specific method of analysis.
______________________________________________________________________________
syndrome (AIDS) patients intolerant to trimethoprim/sulfamethoxazole. Its potent antiprotozoal activity against Plasmodium, Pneumocystis and Toxoplasma
treatment of T. gondi encephalitis in AIDS patients. A previous study of atovaquone disposition in humans yielded no evidence of metabolites. To date, the assays published for atovaquone are limited to complex gas chromatographic methods and high
preparation and extraction procedures.
The ever increasing need for speed and efficient the development of fast and high thro combination drugs with big difference
based assess. The process of reducing analysis time while adequately resol is often accomplished with column with small particles. The
resolved peaks with high theoretical plates over small concentration.
Present drug stability test guidance
suggest that stress studies should be carried out on a drug product to establish its inherent stability characteristics, leading to identification of degradation products and hence supporting the suitability of the proposed analytical procedures. It also requires that analytical test procedures for stability samples should be stability indicating and they should be fully validated.
Accordingly, the aim of the present study was to establish inherent stability of under a variety of ICH recommended test conditions and to develop a rapid stability method.
Literature survey reveals that a
colorimetric determination, ratio derivative, and a stability
determination PRG and ATV either single or in combination with other dru chromatography method has been reported for simultaneous quantitative d combined dosage form.
Hence a rapid simple reproducible Ultra performance liquid chromatography method was developed fo simultaneous quantitative determination of
[image:2.595.150.448.493.569.2]degradation products.
Figure 1.
2.1Reagents and chemicals
HPLC grade Acetonitrile and water of HPLC grade were procured from Merck, Mumbai (India). Perchloric acid and were of analytical grade delivered by S.D. Fine Chemicals, India. Malarone tablets manufactured by Alkem Laboratories, Ltd., were procured from l
gift sample from Alkem Laboratories, Ltd., (Mumbai, India) and Kangyo Pharmaceuticals Co., Ltd., Mumbai, India.
2.2 Instrumentation
______________________________________________________________________________
syndrome (AIDS) patients intolerant to trimethoprim/sulfamethoxazole. Its potent antiprotozoal activity against Toxoplasma had prompted further investigations including clinical trials for encephalitis in AIDS patients. A previous study of atovaquone disposition in humans yielded no evidence of metabolites. To date, the assays published for atovaquone are limited to complex gas chromatographic methods and high-performance liquid chromatography (HPLC) methods with multiple sample preparation and extraction procedures.
The ever increasing need for speed and efficient use of time in pharmaceutical and other fields, there is demand for the development of fast and high through put analytical procedures. The rapid quantitative determination of combination drugs with big difference in label claims (20mg for ) with shorter runtimes is challenge. For UPLC based assess. The process of reducing analysis time while adequately resolving analytes from degradation products is often accomplished with column with small particles. The theoretical advantages for small
resolved peaks with high theoretical plates over small concentration.
Present drug stability test guidance Q1A (R2) issued by international conference on harmonization (ICH) [1 suggest that stress studies should be carried out on a drug product to establish its inherent stability characteristics,
of degradation products and hence supporting the suitability of the proposed analytical procedures. It also requires that analytical test procedures for stability samples should be stability indicating and
aim of the present study was to establish inherent stability of PRG and ATV
under a variety of ICH recommended test conditions and to develop a rapid stability-indicating reverse phase assay
variety of spectrophotometric and chromatographic methods including UV, colorimetric determination, ratio derivative, and a stability- indicating HPLC methods have been reported for
either single or in combination with other drugs [7
chromatography method has been reported for simultaneous quantitative determination of PRG and
Hence a rapid simple reproducible Ultra performance liquid chromatography method was developed fo simultaneous quantitative determination of PRG and ATV in pharmaceutical dosage forms in the presence of
Figure 1.Chemical structure of Proguanil and Atovaquone
EXPERIMENTAL SECTION
HPLC grade Acetonitrile and water of HPLC grade were procured from Merck, Mumbai (India). Perchloric acid and were of analytical grade delivered by S.D. Fine Chemicals, India. Malarone tablets manufactured by Alkem Laboratories, Ltd., were procured from local market (Mumbai, India). Proguanil working standard was obtained as a gift sample from Alkem Laboratories, Ltd., (Mumbai, India) and Atovaquone working standard from Zhejianh Kangyo Pharmaceuticals Co., Ltd., Mumbai, India.
______________________________________________________________________________
syndrome (AIDS) patients intolerant to trimethoprim/sulfamethoxazole. Its potent antiprotozoal activity against had prompted further investigations including clinical trials for encephalitis in AIDS patients. A previous study of atovaquone disposition in humans yielded no evidence of metabolites. To date, the assays published for atovaquone are limited to complex gas nce liquid chromatography (HPLC) methods with multiple sample
use of time in pharmaceutical and other fields, there is demand for ugh put analytical procedures. The rapid quantitative determination of in label claims (20mg for ) with shorter runtimes is challenge. For UPLC analytes from degradation products for small particles are to get well
issued by international conference on harmonization (ICH) [1-5] suggest that stress studies should be carried out on a drug product to establish its inherent stability characteristics, of degradation products and hence supporting the suitability of the proposed analytical procedures. It also requires that analytical test procedures for stability samples should be stability indicating and
PRG and ATV through stress studies indicating reverse phase assay
variety of spectrophotometric and chromatographic methods including UV, indicating HPLC methods have been reported for gs [7-12]. Whereas no liquid etermination of PRG and ATV in the
Hence a rapid simple reproducible Ultra performance liquid chromatography method was developed for in pharmaceutical dosage forms in the presence of
Khagga Bhavyasri et al
J. Chem. Pharm. Res., 2013, 5(12):1222-1229
______________________________________________________________________________
controller(Julabo, Seelbach, Germany) was used for hydrolysis studies. Photo stability studies were carried out in a photo stability chamber (Sanyo, Leicestershire, UK). Thermal stability studies were performed in a dry air oven (MACK Pharmatech, Hyderabad, India).
2.3 Chromatographic Conditions:
The chromatographic column was a Zorbax Extended C18, 50 mm X3.0 mm i.d with1.8 µm particles. Mobile phase contained Acetonitrile and 0.05% Perchloric acid .The flow rate of mobile phase was 0.8 mL min-1 and the detection was monitored at a wavelength of 257 nm. The column temperature was maintained at 40oC and injection volume was 5 µL.
2.4Preparation of standard solution
The standard stock solutions of PRG and ATV (1 mg/mL) were prepared separately by dissolving 50mg of each drug in 50mL of methanol. Several aliquots of these standard stock solutions were taken in different 10 mL volumetric flask and diluted up to the mark with Acetonitrile and methanol in the ratio(1:1) that the final linearity concentrations of PRG and ATV were 2.5-20µg/mL and 6.25-50µg/mL, respectively.
2.5 Preparation of sample solution
Twenty tablets each containing 100 mg of PRG and 200 mg of ATV were weighed and powdered equivalent to dose, transferred to a 100 mL volumetric flask, and extracted with mixture of methanol and water (80:20). The mixture was sonicated for 20 min in an ultrasonic bath. The volume was adjusted to 100 mL with the same solvent mixture and then filtered. From this solution,1.0 mL was pipetted and the volume was made up to 1000 mL with diluents to get the concentration 10 µg/mL of PRG and 25 µg/mL of ATV.
RESULTS AND DISCUSSION
3.1 Method development and optimization
Some important parameters like pH of the mobile phase, concentration of the acid or buffer solution, percentage and type of the organic modifier, etc., were tested for a good chromatographic separation. Trials showed that an acidic mobile phase with reverse phase Zorbax Extended C18 column gives symmetric and sharp peaks. For this reason, 0.05% Perchloric acid solution was preferred as an acidic buffer. Acetonitrile was chosen as the organic modifier because it dissolves drugs very well. The simple gradient program was applied for the analysis (T/%B: 0/10, 3/100, 4/100, 6/10) at a flow rate of 0.8 mL/min showed good resolution. The resolution between PRG and ATV was much greater than 3.0 with a decrease in peak tailing. Retention times of the drugs obtained under these conditions were1.65 and3.00 min for PRG and ATV, respectively. To determine the wave length of simultaneous determination of PRG and ATV were injected into the UPLC system and obtained the UV spectra in the range 200-400nm by DAD. The UV spectra of the solutions obtained shown maximum at 257nm. For the quantitative analytical purposes the wavelength was set at 257 nm. The typical chromatogram of the sample is shown in Figure 2.
______________________________________________________________________________
3.2 Validation
System suitability studies
The column efficiency, resolution, and peak asymmetry were calculated for the standard solutions. The values obtained(Table I) demonstrated the suitability of the system for the analysis of this drug combination.
Table .I System Suitability Parameters
Parameter ATV PRG Retention time 1.30min 3.0min % RSD(n=6) 0.15 0.14 Asymmetric factor 1.18 1.2 Theoretical plates 7645 8345 Resolution factor _ 6.02
3.3 Linearity
The linearity was determined for two drugs, ATV and PRG. The Calibration curve by using 25%,50%,100%,150% and 200% standard solution of each drug with respect to test concentration of 10 µg/mL and 25 µg/mL.
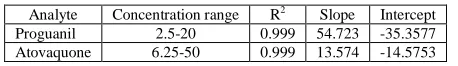
The linear regression equation for two drugs : PRG:Y = 54.7232X – 35.3577 (r = 0.999)(n=5) ATV:Y = 13.574X – 14.5753 (r = 0.999) (n=5)
[image:4.595.185.414.398.431.2]The results showed that an excellent correlation exists between peak area and concentration of the drugs within the concentration range indicated previously. The data was analyzed by “linear regression least squares fit,” and the parameters are listed in Table II.
Table .II Linearity Study
Analyte Concentration range R2 Slope Intercept
Proguanil 2.5-20 0.999 54.723 -35.3577 Atovaquone 6.25-50 0.999 13.574 -14.5753
3.4Limit of detection and limit of quantitation
The linearity for PRG was performed from2.5-20 µg/mL and that for ATV from 6.25-50 µg/mL. Linearity graph was plotted and the correlation coefficient (r) determined. The limit of detection (LOD) was calculated from the linearity curve using the formula:
LOD = 3.3X STyex (Residual standard deviation) Slope
The LOD for PRG was confirmed to be 0.024 µg/mL and for ATV it was confirmed to be 0.0418 µg/mL. The limit
of quantitation (LOQ) was calculated from the linearity curve using the formula:
LOQ = 10 X Styex Slope
The LOQ for PRG was confirmed to be 0.0357 µg/mL and for ATV it was confirmed to be 0.126 µg/mL.
3.5 Accuracy
Khagga Bhavyasri et al
J. Chem. Pharm. Res., 2013, 5(12):1222-1229
______________________________________________________________________________
Table .III Recovery Studies for Spiked Concentration of Proguanil and Atovaquone
Analyte Recovery level Actual Conc. Found Conc. %Recovery
Proguanil
25% 2.5 2.485 99.40 50% 5.0 4.958 99.16 100% 10 10.064 100.64 150% 15.0 12.485 99.88 200% 20 19.985 99.92
Atovaquone
25% 6.25 6.241 99.85 50% 12.5 12.485 99.88 100% 25 24.975 99.99 150% 37.5 37.495 99.98 200% 50 49.985 99.97
3.6 Precision
Precision was determined by studying the reputability and intermediate precision. Repeatability results indicate the precision under the same operating conditions over a short interval time inter assay precision. The standard deviation, Coefficient of variance and standard error were calculated for two drugs. The results are mentioned in Table IV. Intermediate precision was carried out by doing intra and inter day precision studies. In the intraday study, the concentrations of two drugs were calculated on the same day at interval of 1h. In the inter day study, the concentrations of drug contents were calculated on three different days, and the study express with in laboratory variation in different days. In both intra and inter day precision studies for the methods, COV % values were not more than 2%, which indicates good intermediate precision (Table IV).
Table IV: Intraday and Inter day Precision results of PRG and ATV from tablets (n=5)
Day Name API Pre-1% Assay Pre-2% Assay Pre-3% Assay Pre-4% Assay Pre-5% Assay Mean RSD %
Intraday precision
PRG 100.02 99.56 99.97 99.84 99.95 99.868 0.18 ATV 99.69 99.86 99.95 99.71 99.98 99.838 0.16 Interday
Precision
PRG 100.17 99.97 99.88 99.94 100.05 100.002 0.13 ATV 99.87 99.94 99.86 99.67 99.81 99.83 0.10
3.7 Specificity:
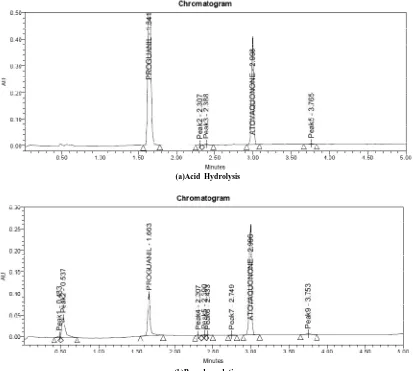
Specificity of the method was assessed by comparing the chromatograms obtained from standard drugs (Figure III). The chromatogram obtained from tablet (Figure V) solutions. Because the retention time of standard drugs and retention time of two drugs in sample solution were the same, the method was specific. The developed method was specific and selective as no interference of excipients was found.
3.8 Forced Degradation Studies:
Stress testing of a drug substance can help to identify the likely degradation products, which can help to establish the degradation path ways and the intrinsic stability of the molecule.
All stress decomposition studies were performed at initial drug concentration 10µg/ml of PRG and 25 µg/ml of ATV. The degradation conditions are selected on the basis of literature survey.
3.9 Hydrogen Peroxide Induced Degradation
For hydrogen peroxide-Induced degradation, the studies were carried out at room temperature in 1% Hydrogen Peroxide for 6 hrs. Shows the minor degradation found at RT 2.3 min. All the major and minor degradation products were well separated from PRG and ATV Peaks. The peak Purity is checked for PRG and ATV the results are summarized in Table V.
3.10 Acid Induced Degradation
______________________________________________________________________________
3.11 Base Induced Degradation
Base hydrolysis was performed in 1N NaOH at 60oC for 6hrs. Shows the major degradation found at Rt 0.6 min and all the major and minor degradation products were well separated from PRG and ATV peaks. The Peak purity is checked for PRG and ATV and the results are summarized in Table V.
3.12 Photo degradation
[image:6.595.196.400.254.314.2]Photo degradation studies were carried out at according to option 2 of QIB in ICH guide lines. Samples were exposed to light for an overall illumination of 1.2 million lux hours and an integrated near ultraviolet energy of 200 Watt hm2. Samples were withdrawn at appropriate time and subjected to UPLC analysis after suitable dilution (10µg/ml of PRG and 25 µg/ml of ATV). The drugs PRG and ATV are stable under Photolytic condition. The peak purity is checked for PRG and ATV and the results are summarized in Table V.
Table V.Peak purity results of PRG and ATV
Stress condition PRG ATV Purity angle Purity Threshold PRG ATV Thermal Stress 0.060 1.18 0.533 4.580 Acid Stress 0.065 1.306 0.536 5.057 Base Stress 0.060 1.727 0.499 5.776 Peroxide Stress 0.070 1.118 0.538 4.580
Fig 3. A typical Chromatograms obtained from Proguanil and Atovaquonone tablets and stressed samples
[image:6.595.90.503.346.717.2]Khagga Bhavyasri et al
J. Chem. Pharm. Res., 2013, 5(12):1222-1229
______________________________________________________________________________
(c) Oxidative degradation
(d) Thermal degradation
(e) Photo Degradation
3.13Solution stability and Mobile Phase stability
______________________________________________________________________________
by assaying the freshly prepared standard solution for 24hrs interval upto 48 hrs. The mobile phase preparation was kept constant during the study period. The percentage RSD of assay of PRG and ATV was calculated for the study period during mobile phase and solution stability experiments. The % RSD of the assay of PRG and ATV during solution stability and mobile phase experiments were within 1% and it indicated that both standard and test preparation and mobile phase were stable for 2 days on bench top at room temperature.
CONCLUSION
The proposed method gave good resolution between PRG and ATV within short Analysis time (< 5.0 min). Solution stability studies showed that the active pharmaceutical ingredients remained stable for 24 h at room temperature. The changes in flow rate, composition of mobile phase, and temperature of column did not affect the percentage assay of drug, confirming the robustness of the method. Ruggedness of the method was confirmed as no significant changes were observed on analysis using different instrument. High percentage recovery of drug shows the method is free from interference of Excipients present in the formulation. Thus the proposed method is simple, rapid, sensitive, specific, accurate, and precise, and does not involve complicated sample preparation procedures.
Acknowledgments
The authors would like to thank the director Institute of Science and Technology, Jawaharlal Nehru Technological University for their support to Carry this investigation .
REFERENCES
[1]ICH QIA (R2). Stability Testing of New Drug Substances and Products. 2003.
[2]Snyder LR, Kirkland JJ, Glajch JI. Practical HPLC Method Development. 2nd ed.; 1997.
[3]ICH, Q2B.Validation of Analytical Procedure: Methodology. International Conference on Harmonization, IFPMA, Geneva, 2005.
[4]Validation of Analytical Procedure: Methodology, ICH Harmonized Tripartite Guidelines. 1996. p. 1-8.
[5]ICH, 1994. Text on validation of analytical procedures, Q2A, International Conference on Harmonization, IFPMA, Geneva. Harmonization, IFPMA, Geneva.
[6]Chiluba EM, Fletcher KA, Price AH (1987). Afr. J. Med. Sci. Br. 16: 43-46.
[7]Eidstein MD (1986). J. Chromatogr. Amsterdam, 380: 184-189
[8]Kelly JA, Fletcher KA (1986). J. Chromatogr. Amsterdam. 381: 464-471.
[9]Kalpesh N patel, Jayvadhan K patel, Manish P patel, Ganesh C Rajput, A validated method for development of
Atovaquone as API and tablet dosage forms by UV spectroscopy, Pharmaceutical methods vol-1,issue-1,2010,pg: 61-64
[10]Lindegardh.N, Bergqvist.Y, Journal of chromatography B Biomedical sciences and application vol
744No.1,Pg:9-17.