ISSN 2250-3153
Evaluation of Contrast Sensitivity in Diabetic Patients
Erick Yudistira*, Bobby R.E. Sitepu**, Aslim D. Sihotang**
*Ophthalmology Resident, Department of Ophthalmology, Sumatera Utara University ** Ophthalmologist, Department of Ophthalmology, Sumatera Utara University ** Ophthalmologist, Department of Ophthalmology, Sumatera Utara University
DOI: 10.29322/IJSRP.9.01.2019.p8507
http://dx.doi.org/10.29322/IJSRP.9.01.2019.p8507
ABSTRACT
Background
Diabetes mellitus is a series of chronic metabolic disorders due to the pancreas does not produce enough insulin resulting from defects in insulin secretion, insulin action, or both leading to the increase of glucose concentration in blood. Diabetic retinopathy is a retinal disorder found in diabetic patients. It is a cause of blindness found throughout the world. As diabetes increases and glycemic control worsens, these diabetic patients have a decrease in contrast sensitivity. Clinically, it can be used as a tool in assessing retinal function in diabetic patients. Contrast sensitivity test has a strong indication and is a prediction of a real picture of vision that affects the quality of life of someone.
Method
This study was observational analytic with a cross sectional study method. The subjects were control patients without diabetes mellitus, people with diabetes mellitus less than 5 years and people with diabetes mellitus for more than 5 years at the Sumatera Utara University Hospital.
Results
Of the 45 subjects (90 eyes), 15 subjects (30 eyes) experiencing a decrease in the value of contrast sensitivity, namely people with diabetes mellitus more than 5 years.
Conclusion
There was no relationship between age and group characteristics of the subjects (p value > 0.05). There was no relationship between age and contrast sensitivity values (p value > 0.05). There was a relationship between the characteristics of the patient group in the study subject to contrast sensitivity values (p value <0.05). There was a significant difference in the value of contrast sensitivity between groups of control patients without diabetes mellitus with a group of diabetic patients < 5 years, a group of control patients without diabetes mellitus with group of diabetic patients > 5 years and between group of diabetic patients < 5 years with diabetic patients > 5 years (p value <0.05).
Keywords: Diabetes Mellitus, Diabetic Retinopathy, Contrast Sensitivity, Pelli Robson Chart
INTRODUCTION
Diabetes mellitus is a group of metabolic diseases with characteristics of hyperglycemia that occur due to abnormal insulin secretion, insulin performance or both. Diabetes mellitus cannot be cured but blood sugar levels can be controlled through diet, exercise, and medication. To be able to prevent the occurrence of chronic complications, good DM control is needed.1
Diabetic retinopathy is a retinal disorder found in people with diabetes mellitus. The abnormalities found in the examination of diabetic retinopathy due to prolonged diabetes mellitus can be aneurysms, dilated veins, bleeding and fat exudates.3,4,5 Sensitivity of contrast is the value of the amount of contrast between light and dark (monochrome or color), which is
ISSN 2250-3153
II. METHOD
This study is an analytic observational with cross sectional design study with control was approved by the ethics committee of Medical Faculty of Sumatera Utara University. The research subjects were all patients in the Neuro Ophthalmology Division and Endocrine Metabolic Diabetes Division of Sumatera Utara University Hospital with control patients without diabetes mellitus, patients with diabetes mellitus less than 5 years and diabetic patients for more than 5 years from September to October 2018. The samples for 45 patients over 40 years were tested firstly for the acuity of vision, and followed by examination of the anterior segment using a Slit Lamp, then examination of intraocular pressure by using the Schioetz Tonometer to assess eyeball pressure, then examination of posterior segment using Funduscopy Direct then, contrast sensitivity testing was carried out using Pelli Robson Chart so that contrast sensitivity of patients without evaluation of diabetes mellitus could be evaluated, patients with diabetes mellitus less than 5 years and people with diabetes mellitus were more from 5 years. The data is entered with SPSS (IBM SPSS Statistic for Windows, Version 19.0). Anova One Way Test (relationship between age and contrast sensitivity values) p value > 0.05 is considered not significant. Chi-Square Test (relationship between characteristics of patient groups in research subjects against contrast sensitivity values) p value < 0.05 is considered significant. In the multiple comparisons test, the LSD method (the difference between the variables of contrast sensitivity values) showed that there were significant differences in contrast sensitivity values between the control patients without diabetes mellitus and those with diabetes mellitus less than 5 years, the group of patients without diabetes mellitus with groups people with diabetes mellitus more than 5 years and between groups of people with diabetes mellitus less than 5 years with a group of people with diabetes mellitus more than 5 years (p < 0.05).
III. RESULTS
Of the 45 subjects (90 eyes), there were 15 subjects (30 eyes) experiencing a decrease in the value of contrast sensitivity, namely people with diabetes mellitus more than 5 years.
Table 1. Distribution of subjects based on the characteritics of demography
Characteristics n %
Age
• 46 - 55 years 14 31.1
• 56 - 65 years 16 35.6
• > 65 years 15 33.3
Sex
• Female 21 46.7
• Male 24 53.3
Patient Group
• Control 15 33.3
• DM < 5 year 15 33.3
• DM > 5 year 15 33.3
Total 45 100
[image:2.595.43.490.423.574.2]In table 1 it shows that the distribution of research subjects based on demographic data. From the table, it can be concluded that the number of research subjects is 45 people based on the age according to The Ministry of Health, Republic of Indonesia in 2009, subjects aged 46-55 years were 14 people (31.1%), subjects aged 56-65 years were 16 people (35.6%) and subjects with age> 65 years as many as 15 people (33.3%) with a total subject of 45 people (100%). Female were 21 people (46.7%), while male were 24 people (53.3%), with a total subject of 45 people (100%). From table 4.1, it also shows that subjects with control patients as many as 15 people (33.3%), subjects with patients with diabetes mellitus <5 years as many as 15 people and subjects with patients with diabetes mellitus> 5 years as many as 15 people (33.3%) with a total subjects of 45 people (100%).
Table 2. Distribution of Age Correlation Againts Characteristics of Patients Group
Age (Years)
Patient Group
Total p value
Control DM < 5 years DM > 5 years n % n % n %
ISSN 2250-3153
56 – 65 4 26.7 6 40.0 6 40.0 16
> 65 4 26.7 5 33.3 6 40.0 15
Total 15 100 15 100 15 100 45
[image:3.595.38.490.272.423.2]From table 2 above, it explains that the characteristics of research subjects aged 46-55 years with control patients as many as 7 people (46.7%), subjects with < 5 years diabetes mellitus as many as 4 people (26.7%), subjects with diabetes mellitus > 5 years as many as 3 people (20.0%) with a total subject of 14 people (100%). Research subjects aged 56-65 years with control patients as many as 4 people (26.7%), subjects with <5 years diabetes mellitus as many as 6 people (40.0%), subjects with diabetes mellitus > 5 years as many as 6 people (40.0%) with total subjects 16 people (100%). Research subjects aged > 65 years with control patients as many as 4 people (26.7%), subjects with < 5 years diabetes mellitus as many as 5 people (33.3%), subjects with diabetes mellitus > 5 years as many as 6 people (40.0%) with a total subject 15 people (100%). The results of the Chi-Square Test obtained p value 0.599 meaning there was no relationship between age on the characteristics of the group of study subjects (p value > 0.05).
Table 3. Distribution of Age Correlation to Contrast Sensitivity Value
Patient Group Age (Years)
Contrast Sensitivity Value p value
n x̄ ± SD
Control
46-55 7 1.9500 ± 0.001 0.269
56-65 4 1.9475 ± 0.005
> 65 4 1.9493 ± 0.001
DM < 5 year
46-55 4 1.9000 ± 0.001
0.299
56-65 6 1.9017 ± 0.040
> 65 5 1.8960 ± 0.089
DM > 5 year
46-55 3 1.5500 ± 0.001
0.507
56-65 6 1.5500 ± 0.001
> 65 6 1.5750 ± 0.612
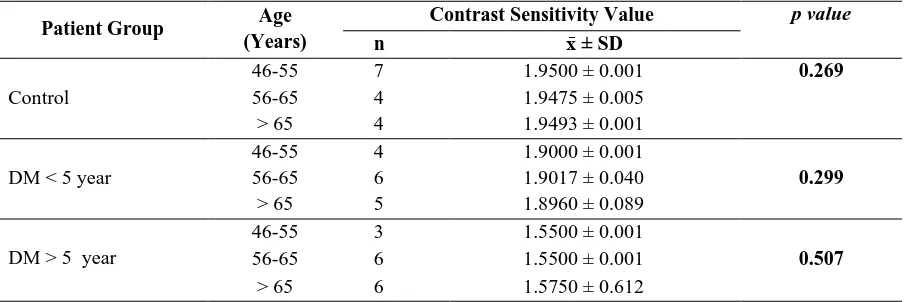
[image:3.595.36.494.543.624.2]Results of Anova one way test in table 3 above explains the absence of a relationship between age and contrast sensitivity values in control patients with a value of 0.269. In patients with diabetes mellitus < 5 years, there was also no relationship between age and sensitivity value contrast with p value 0.299 and in patients with diabetes mellitus > 5 years there is also no relationship between age and contrast sensitivity values with p value 0.507. In this study the relationship between the value of contrast sensitivity and increasing age did not have a significant value, namely p value > 0.05.
Table 4. Distribution of Characteristics of Groups of Research Subjects with Contrast Sensitivity Value
Patient Group
Contrast Sensitivity Value
Total n %
p value
Decrease n %
Normal n %
Control 0 0 15 100 15 100
DM < 5 year 0 0 15 100 15 100 0.0001
DM > 5 year 15 100 0 0 15 100
From table 4 it illustrates the relationship between the characteristics of the group of study subjects with contrast sensitivity values with p value 0.0001 according to the Chi-Square Test. From the above data, it can be concluded that there is a relationship between the characteristics of the group of patients in the study subject to contrast sensitivity values (p value <0.05).
Table 5. Distribution of Contrast Sensitivity Value
Patient Group n Contrast Sensitivity Value x̄ p value
± SD
ISSN 2250-3153
DM < 5 year 15 1.899 ± 0.006 DM > 5 year 15 1.560 ± 0.387
[image:4.595.39.490.174.234.2]Anova one way test results in table 5 above explains the difference in Contrast Sensitivity Value which is significant with p value 0.001 (p value < 0.05). To see the average Sensitivity Value Different contrasts, it can be seen by the multiple comparisons LSD method, namely:
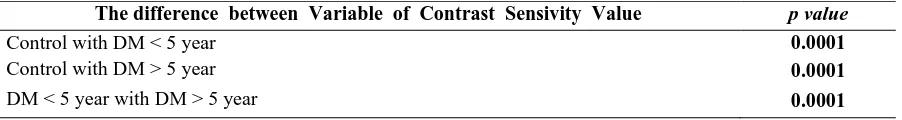
Table 6. Distribution of the difference between Variable of Contrast Sensitivity Value The difference between Variable of Contrast Sensivity Value p value
Control with DM < 5 year 0.0001
Control with DM > 5 year 0.0001
DM < 5 year with DM > 5 year 0.0001
In table 6 it can be seen that there is a significant difference in the value of contrast sensitivity between groups of control patients without suffering from diabetes mellitus with a group of patients with diabetes mellitus < 5 years (p value 0.0001). Significant differences in contrast sensitivity values were also obtained between groups of control patients without suffering from diabetes mellitus with a group of patients with diabetes mellitus > 5 years (p value 0.0001) and between groups of patients with diabetes mellitus < 5 years with groups of diabetes mellitus > 5 years (p value 0.0001 ).
IV. DISCUSSION
Diabetes mellitus is a series of chronic metabolic disorders due to the pancreas does not produce enough insulin, causing insulin deficiency as a result of there is an increase in glucose concentration in the blood.1,5 World Health Organization (WHO)
predicts an increase in the number of people with diabetes 8.4 million in 2000 to around 21.3 million in 2030. Contrast sensitivity is the value of the amount of contrast between light and dark (monochrome or color), which is needed to detect or recognize a visual target. This value shows information about visual functions that are not detected by Snellen charts or field tests. Sensitivity can be measured in various spatial frequencies to detect functional defects in less sensitive parts of retinal ganglion cells (RGCs) or in the higher visual pathway.7,8,11,12 In normal subjects, contrast sensitivity and visual acuity are interconnected. Decreased
vision due to refractive abnormalities is said to have an effect on contrast sensitivity. However, various types of visual dysfunction including cerebral lesions, optic neuritis, glaucoma, diabetes neuropathy, cataracts can reduce contrast sensitivity even though the vision is near normal, so contrast sensitivity testing is recommended as a means of differential diagnosis and screening.14,15,16
In table 1, it shows that the distribution of research subjects is based on demographic data. From the table it was concluded that the number of research subjects was 45 people based on age according to Ministry of Health, Republic of Indonesia in 2009, subjects aged 46-55 years were 14 people (31.1%), subjects aged 56-65 years were 16 people (35.6%) and subjects with age> 65 years as many as 15 people (33.3%) with a total subject of 45 people (100%). Female subjects were 21 people (46.7%), while male subjects were 24 people (53.3%), with a total subject of 45 people (100%). From table 4.1 it shows that subjects with control patients as many as 15 people (33.3%), subjects with DM patients < 5 years as many as 15 people and subjects with DM patients > 5 years as many as 15 people (33.3%) with a total subject of 45 people ( 100%).
From table 2, it explains that the characteristics of research subjects aged 46-55 years with control patients as many as 7 people (46.7%), subjects with < 5 years diabetes mellitus as many as 4 people (26.7%), subjects with diabetes mellitus > 5 years as many as 3 people (20.0%) with a total subject of 14 people (100%). Research subjects aged 56-65 years with control patients as many as 4 people (26.7%), subjects with <5 years diabetes mellitus as many as 6 people (40.0%), subjects with diabetes mellitus > 5 years as many as 6 people (40.0%) with total subjects 16 people (100%). Research subjects aged > 65 years with control patients as many as 4 people (26.7%), subjects with < 5 years diabetes mellitus as many as 5 people (33.3%), subjects with diabetes mellitus> 5 years as many as 6 people (40.0%) with a total subject 15 people (100%). The Chi-Square Test results obtained p value 0.599 which showed no relationship between age and characteristics of the research subjects (p value> 0.05). This study is in line with the study of Abbas Azimi (2010) et al. That there were no statistically significant differences between age in the control group, < 5 years of diabetes mellitus patients and > 5 years of mellitus patients.9
ISSN 2250-3153
sensitivity and aging did not have a significant value, namely p value > 0.05. This study is in line with Naser Shoeibi (2010) research et al. That there was no statistically significant difference between age and contrast sensitivity values.9
From table 4, it shows the relationship between the characteristics of the group of study subjects with contrast sensitivity values that are worth p value 0.0001 according to the Chi-Square Test. From these data it can be concluded that there is a relationship between the characteristics of the group of patients in the study subject to contrast sensitivity values (p value < 0.05). This study was in line with the research of Shayesteh Yasini, MSc (2010) that found a statistically significant difference between groups of patients on contrast sensitivity values.10 This study was not in line with Mayasari Nasrul (2015) study that there was no
statistically significant relationship between concomitant sensitivity binoculars with long-standing type 2 diabetes without diabetic retinopathy.8
Anova One Way test results in table 5 explains the difference in contrast sensitivity values that are significantly p value 0.001 (p value < 0.05). In table 6 the multiple comparisons test of the LSD method shows that there are significant differences in the value of contrast sensitivity between groups of control patients without diabetes mellitus with a group of < 5 years of diabetes mellitus (p value 0.0001). Significant differences in contrast sensitivity values were also obtained between groups of control patients without suffering from diabetes mellitus with groups of people with diabetes mellitus > 5 years (p value 0.0001) and between groups of patients with diabetes mellitus < 5 years with groups of people with diabetes mellitus > 5 years (p value 0.0001 ) This research is also in line with Javad Heravian, Phd (2010) et al that there is significant differences in the value of contrast sensitivity between groups of control patients with < 5 years of diabetes mellitus and people with diabetes mellitus > 5 years.9
V. CONCLUSION
Of the 45 subjects (90 eyes), 15 subjects (30 eyes) experienced a decrease in the value of contrast sensitivity, namely diabetic patients for more than 5 years. There was no relationship between age and group characteristics of the study subjects (p value > 0.05). There was no relationship between age and contrast sensitivity values (p value > 0.05). It was found that there was a relationship between the characteristics of the patient group in the study subject to contrast sensitivity values (p value < 0.05). There was a significant difference in the value of contrast sensitivity between groups of patients without diabetes mellitus with a group of patients with diabetes mellitus < 5 years, a group of control patients without diabetes mellitus with a group of patients with diabetes mellitus > 5 years and between groups of patients with diabetes mellitus < 5 years with groups of patients diabetes mellitus > 5 years (p value < 0.05).
REFERENCES
1. Acceptance criteria for enforcing DM, available at, www. Diabetes Nusantara.com/pages/ clinic about diabetes / control.hbalr.php. 2. American Academy of Ophthalmology, Basic and Clinical Science Course, Neuro-Ophthalmology section 5, 2016-2017
3. American Academy of Ophthalmology, Basic and Clinical Science Course, Retinal Vascular Disease in Retina and Vitreous, section 12, 2016-2017 4. National strategy plan for managing visual impairment and blindness to achieve vision 2020, attachment to the decision of the minister of health number
1473, 2005.
5. Eva PR, Whitcher JP. Vaughan & Asbury Oftalmologi Umum. Ed. 17. Jakarta: Penerbit Buku Kedokteran EGC; 2009. H. 185-211.
6. Hendriati, Ibrahim S, Rahman K, Suitability of Values and Functions of SK in Diabetic Retinopathy. Eye Health Research Thesis at Andalas University. Padang. 2005.
7. Damayanti Kun D et al., Prevalence & Risk Factors of Diabetic Retinopathy in DM Patients in Hasan Sadikin Hospital, Bag. Eye Health Sciences, Medical Faculty Padjajaran University, Cicendo Hospital, 2006.
8. Mayasari, Nasrul, The Relationship Between Contrast Sensitivity and Color Vision with Length of Diabetes Mellitus in Type 2 Diabetes Mellitus without Diabetic Retinopathy. Eye Health Research Thesis at Andalas University. Padang. 2015
9. Heravian J, Shoeibi N, Azimi A, Yasini S, Monghaddam HO, Yekta AA, Esmaily H. Evaluation of Contrast Sensitivity, Color Vision and Visual Acuity in Patients with and without Diabetes. Irianian J of Ophthalmology 2010;22(3):33-40.
10. Pelli D G, Robson J G, Wilkins J A J. The Design of a New Letter Chart for Measuring Contrast Sensitivity. Institute for Sensory Research, Syracuse University, U.S.A, Cambridge Universitv, England October 1988. pl87-197.
11. Beck Roy w. Optic Neuritis. In: Walsh and Hoyt's Clinical Neuroophthalmology. Vol I. Editor Neil R. Meller.MD & Nancy J. Newman. MD. Williams & Wilkins. 1998. 612-3.
12. Pelli DG, Robson JG, Wilkins AJ. The design of a new letter chart for measuring contrast sensitivity. Clin Vis Sci 1988; 2: 187–189. 13. Stavrou EP, Wood JM. Letter contrast sensitivity changes in early diabetic retinopathy. Clin Exp Optom 2003; 86: 152–156.
14. Ghafour IM, Foulds WS, Allan D, McClure E. Contrast sensitivity in diabetic subjects with and without retinopathy. Br J Ophthalmol 1982; 66: 492–495. 15. Arend O, Remky A, Evans D, et al. Contrast sensitivity loss is coupled with capillary dropout in patients with diabetes. Invest Ophthalmol Vis Sci
1997;38(9):1819-24.
Authors
ISSN 2250-3153
Second Author – Bobby R.E. Sitepu, Department of Ophthalmology, Sumatera Utara University, bobbyres@yahoo.com
Third Author – Aslim D. Sihotang, Department of Ophthalmology, Sumatera Utara University, aslimsihotang@yahoo.com