Digital Attendance Calculation System using Support
Vector Machine & Image Processing
Rajib Bag, Gautam, Komal Das, P. Mohini Amma
Computer Science & Engineering Dr. B.R. Ambedkar Institute of Technology Port Blair, Andaman & Nicobar Island, INDIA
Abstract
— This paper deals with recognizing and classifying handwritten characters and classifies it with respect to other characters in the method for attendance calculation system. Existing system of calculation of attendance contains manual calculation for the number of students present or absent in a class. In this paper we proposed a digitized method for calculating number of classes present and absent for a student which in the previous case is time consuming and may sometimes produce incorrect result in some cases. It uses features of a character extracted using feature extraction techniques. There are methods been proposed for feature extraction that can be simulated using support vector machine for further calculation of the attendance using the attendance register. Support vector machine is one of the techniques that are used to classify a handwritten character based on handwriting recognition and identify the digitized output Support vector machine classifies a character by using a large number of training set that needs to be fed into the database for the accurate output.Key words—Support Vector Machine, Image Processing, Feature Extraction, Attendance Calculation System
INTRODUCTION
In the world, where everything has been digitized, using computer based algorithms and various coding and decoding techniques, data is processed with the help of programs and we get the desired output. Identification of objects in a real world plays a key role for human-computer interaction in a computer-augmented environment using augmented reality techniques. There are two characters used in this application. The main aim of this paper is to present an application using support vector machine that calculates the consolidated attendance of each student by the image of attendance register. This application has been developed using steps including pre-processing for image acquisition, feature extraction to extract the features from an acquired image and Support Vector Machine where these features are used to train a SVM classifier with different samples and a training set is developed. The extracted features is used to form a training set for Support Vector Machine, a test sample
is
checked to illustrate that whether a sample belongs to the class or not. Whenever a new character either P or A is given to the system it forms a testing set and classifies whether the character is P or A. The total number of P and A are calculated for each row.PREPROCESSING
A. CONVERSION OF RGB TO BINARY
Binarization[8] is one of the most important techniques for preprocessing stage. Among many binarization techniques, the Otsu’s method is considered as the most commonly-use done in the survey papers. If a pixel is greater than or equal to the threshold intensity, the resulting pixel is white ("0"). On the other hand, if a pixel in the image has intensity less than the threshold value, the resulting pixel is black ("1").Binarization[8] of image consists of that either global or local threshold. Global thresholding has a good performance in the case that there is a good separation between the foreground and the background.
Otsu’s global threshold method finds the global threshold t that minimizes the intra-class variance of the resulting black and white pixels. Then the binarization is formed by the setting
Unlike global approaches, local area information may guide the threshold value for each pixel in local (adaptive) thresholding techniques. A local algorithm is introduced in that calculates a Pixel-wise threshold by shifting a rectangular window across the image.
The threshold T for the center pixel of the window is computed using the mean m and the variance s of the gray values in the window:
Where k is a constant set to -0.2. The value of k is used to determine how much of the total print of object boundary is taken as a part of the given object.
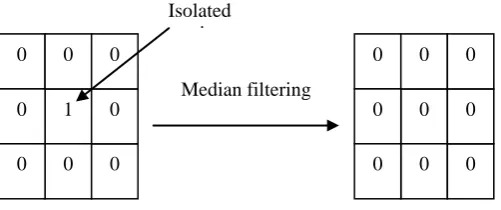
B. MEDIAN FILTERS
The median
m
of a set of values is the value that possesses the property that half the values in the set are less thanm
and half are greater thanm
. Median filtering is the operation that replaces each pixel by the median of the grey level in the neighborhood of that pixel.Median filters[8] are nonlinear filters because for two sequences
x
(
n
)
andy
(
n
)
Median filters[8] are useful for removing isolated lines or points (pixels) while preserving spatial resolutions. They perform very well on images containing binary (salt and pepper) noise but perform poorly when the noise is Gaussian.
Fig 1 Median Filter
C. RESIZING
Resizing[8] an image is defined as reducing or enlarging dimensions of an image. The resizing is usually done described given below:
400 x 400 32 x 32
Fig 2 Image resizing
D. THINNING
Thinning [8] is an important preprocessing step in optical character recognition. The purpose of thinning is to delete redundant information and at the same time retain the characteristic features of the image. In order to reduce the quantity of information minimally, a thinning algorithm play an important role in recognition of the character, figure, and drawing.
Thinning [8] is usually involves removing points or layers of outline from a pattern until all the lines or curves are of unit width, or a single pixel wide. The result in set of lines or curves is called the skeleton of the object as shown in figure.
Figure 3: Skeleton produced by thinning process
EXISTING FEATURE EXTRACTION
TECHNIQUES
A. FREEMAN CHAIN CODE
The main objective of feature extraction is to remove redundancy from data. The task of human expert is to select features that allow effective and efficient recognition of pattern. The architecture of recognition system
Feature extraction is a very important in recognition system because it is used by the classifier to classify the data. Chain code is one of the representation techniques that is useful for image processing, shape analysis and pattern recognition fields. Chain code representation gives the boundary of character image in which the codes represent the direction of where is the location of the next pixel. The first approach of chain code was introduced by Freeman in 1961 that is known as Freeman Chain Code (FCC)[16] .There are two directions of chain code, namely 4-neighborhood and 8-neighborhood.
B.
CAEMASTRA TECHNIQUE
The present feature extraction[7] works on global and local features. The global feature includes the analysis of pattern with respect to baseline and width/height ratio. The local features divides the character by dividing into 4 x 4 grid and calculating the number of pixels horizontally and vertically along each column at regular pixels. A probability of number of pixels in the grid with respect to the number of pixels found by the same method with the whole image. If ni is the number of foreground pixels in cell i and M is the total number of foreground pixels in the pattern, then the gray feature related to cell i is ni/M. The other operators try to estimate to which extent the black pixels in the cell are aligned along some directions. For each direction of interest, a set of N, equally spaced, straight lines are defined, that span the whole cell and that are parallel to the chosen direction. Along each line j ∈ [1,N] the number nj of black pixels is computed and the sum
is then obtained for each direction. The first global feature measures the fraction of the character below the baseline and detects eventual descenders. The second feature is the width/height ratio. The number of local features can be arbitrarily determined by changing the number of cells or directions examined in each cell. Therefore the feature set was tested changing the number of cells and the grid giving the best results (4 × 4) was selected. A feature vector of 34 elements was formed. Two features are global (baseline and width/height ratio) while the remaining 32 are generated from 16 cells, placed on a regular 4×4 grid from each cell.
SUPPORT VECTOR MACHINE
Although there are several other algorithms[12][13][14] as pattern classifiers, Support Vector Machine (SVM) [2][3][4][7][16] is an algorithm that is widely used among them, after projecting data in the Feature space, computes an Optimal Separating Hyper plane, based on Statistical Learning Theory [5][13].
Isolated point
Median filtering
0
0 0
0 0
0 0 0
0 0
1 0
0 0
0 0 0
0
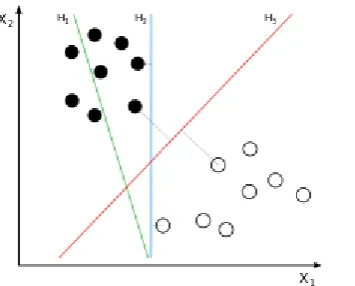
Fig 4. H2 provides the maximum margin hyperplane between two classes
A. LINEAR CLASSIFICATION USING SVM:
OPTIMAL SEPARATING HYPERPLANE:
We are given a set D of patterns with each pattern belongs to either of two
[image:3.595.40.284.349.548.2]classes . The patterns with output +1 are called positive patterns, while the others are called negative patterns. The goal is to establish the equation
Fig 5. A linear SVM that seperates two classes by a maximum margin hyperplane
of the Optimal Hyper planethat divides D leaving all points of the same class on the same side while maximizing the distance between the two classes and the hyper plane. This can be expressed by the constraints:
In most practical problems a separating hyper plane may not exist. Due to presence of noise, an overlapping between classes may exist. Hence it has to allow that the constraints can be violated by some examples
Using slack variables £>0 the constraints can be relaxed in:
Therefore we can construct a classifier, Support Vector Machinesolving the following optimization problem
½||
The classifier controls at the same time the margin ||w|| and the number of training errors. The regularization constant C > 0 determines the trade-off between the two terms. The conditional optimization problem can be solved by introducing Lagrange multipliers £> 0 and a Lagrangian function
The Lagrangian L has to be minimized with respect to the primal variables w and b and maximized with respect to the dual variables i, i.e. a saddle point has to be found. The condition at the saddle point implies that the derivatives of L with respect to the primal variables must vanish
[image:3.595.316.548.504.609.2]4.2. NON-LINEAR CLASSIFICATION USING SVM:
Fig 6. A nonlinear classification by using Kernel Functions
The original optimal hyper plane algorithm proposed by Vapnik in 1963 was a linear classifier. However, in 1992, Bernhard E. Boser, Isabelle M. Guyon and Vladimir N. Vapnik suggested a way to create nonlinear classifiers by applying the kernel trick (originally proposed by Aizerman et al.) to maximum-margin hyperplanes. The resulting algorithm is formally similar, except that every dot product is replaced by a nonlinear kernel function.
Some of the common kernel functions [6][10][15] include:
1.
Polynomial(homogeneous):2.
Polynomial(inhomogeneous):3.
Gaussian radial basisfunction: for
Sometimes parameterized using
4.
Hyperbolic tangent: ,for some and
B. MULTICLASS SVM:
In order to use SVM when the number of classes K is larger than 2, a few different strategies have been suggested. In our experiments we have adopted One-versus-rest (o-v-r) method. The method learns one classifier for each of the K classes against all the other classes. More formally, the method consists in training K SVM classifiers fj by labeling all training points having yi = j with +1 and yi = j with -1 during the training of the jth classifier. In the test stage, the final decision function F(¢) is given by:
PROPOSED METHODS
A. DISTANCE MEAN FEATURE EXTRACTION
There are various feature extraction techniques as given in [1][2][3][4][7]. The algorithm takes mean from all the sides by the distance from the first element pixel to the first black pixel in the row. The features are calculated as per the dimensions given below as four features gives four dimensions in an image. There are four features extracted from the character which are calculated as below:
Extracted distance from left to right
Extracted distance from left to right
Extracted distance from left to right
Extracted distance from left to right
These four features extracted are given as parameters to Support Vector Machine for further simulation.
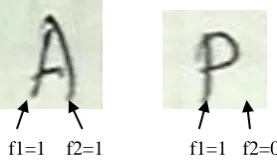
B. FUDICIAL POINTS FEATURE EXTRACTION
The yet another technique for feature extraction is quiet simplified as it works for only P and A as the features is as per two characters. The features of the character are taken as per below:
[image:4.595.308.447.163.243.2]
Fig 7. Fudicial Point Feature Extraction
1. The algorithm works as follows:
1. Start scanning from left bottom corner of the image. 2. If a black pixel A[i][j]!=1 is found along the row then
iterate i=i+1 and scan next row until A[i][j]=1 is found or f1=1.
3. If a black pixel A[i][j]=1 is found along horizontal scanning assign f1=1 and search for f2=1 in the same row.
a. If f2=1 in the same row then assign features as 1 and 1.
b. If f2=0 along the same row, then scan for the next 5 rows with iterations and search for f2=1 as given in the above figure, if not found assign f2=0.
4. Note the features f1 and f2 as parameter to Support Vector Machine.
2. Pseudocode
1. Algorithm FeatureExtraction(I2) 2. {
3. s:=size([I2]; 4. f1:=0; 5. f2:=0; 6. row:=s(1); 7. while(row>0) 8. {
9. for col=1 to s[2] 10. {
11. x:=I2[row,col]; 12. if(x==0) 13. { 14. f1:=1; 15. break; 16. } 17. } 18. if(f1==1) 19. { 20. break; 21. }
22. row:=row-1; 23. }
24. for c=col+10: to s[2] 25. {
26. y:=I2[row,c]; 27. if(y==0) 28. { 29. f2:=1; 30. break; 31. } 32. if(f2==1) 33. { 34. break; 35. } 36. } 37. if(f2~=1) 38. {
39. r=:row-1; 40. while(r>=row-3) 41. {
42. for c=col+10 to s(2) 43. {
44. y1:=I2[r,c]; 45. if(y1==0) 46. { 47. f2:=1; 48. break; 49. } 50. } 51. if(f2==1)
52. {
53. break; 54. } 55. r:=r-1; 56. } 57.} 58.if(f2~=1) 59.{
60. r:=row-1; 61. while(r>=row-3) 62. {
63. c:=col-10; 64. while(c>0)
65. {
66. y1:=I2[r,c]; 67. if(y1==0) 68. { 69. f2:=1; 70. break; 71. } 72. c:=c-1; 73. } 74. if(f2==1) 75. { 76. break; 77. }
78. r:=r-1; 79. } 80.}
81. A:=[f1;f2]; 82. write f1,f2; 83.}
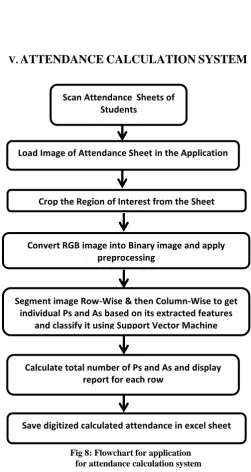
V. ATTENDANCE CALCULATION SYSTEM
[image:5.595.309.561.152.625.2]COPYRIGHT FORMS
Fig 8: Flowchart for application for attendance calculation system
Scan Attendance Sheets of Students
Load Image of Attendance Sheet in the Application
Crop the Region of Interest from the Sheet
Convert RGB image into Binary image and apply preprocessing
Segment image Row-Wise & then Column-Wise to get individual Ps and As based on its extracted features
and classify it using Support Vector Machine
Calculate total number of Ps and As and display report for each row
Fig 9. Sample of a cropped region from an Attendance sheet
Fig 10. Snapshot of the application
VI.
TEST CASE AND RESULTS
A.
PERFORMANCE EVALUATION
Sl. No Samples taken(120)
Image fed for testing
Number of images classified
[image:6.595.50.270.272.525.2]1. Sample 1 30 30 2. Sample 2 30 30 3. Sample 3 30 29 4. Sample 4 30 29
Table 1. Performance Evaluation (Fudicial Point Method)
Sl. No Samples taken(120)
Image fed for testing
Number of images classified
1. Sample 1 30 30 2. Sample 2 30 30 3. Sample 3 30 28 4. Sample 4 30 28
Table 2. Performance Evaluation (Distance Mean Method)
VII. CORRECTNESS VERIFICATION
The application is developed in MATLAB. The following are the accuracy results for the two methods in the analysis of the two proposed methods of feature extraction:
Sl. No
Name of the Proposed Method
No. of training Image
No of testing image
Accuracy rate
1. Fudicial Point Feature Extraction
128 127 99.21%
2. Distance Mean Feature Extraction
[image:6.595.301.568.292.395.2]128 125 97.65%
Table 3. Correctness Verification
IX.
CONCLUSION AND FUTURE WORK
This system proposes an algorithm that can achieve a task of scanning an attendance sheet that will speed up the process in the current system. This makes a manual work lot easier as user just need to scan an attendance register and calculation of attendance for each student will be done automatically. The simple user interface allows any user to easily operate the work. The user could also save the results for further work. The user could work easily using the system as this system is useful for the case where there are a large number of data available for calculation. The calculation time for support vector machine to identify is not too large as it uses only two characters for the classification of a character. There are a large number of data set available as a training set for accurate recognition of a character in support vector machine. This proposed system could reduce the work load of calculation of attendance from the attendance register.
There may be a mobile application which will capture attendance register and will produce the same result. This will be more easy of the calculation for a faculty. Moreover similar system can be developed for other languages as well.
ACKNOWLEDGMENTS
First of all we would like to thank the Almighty, who has always guided us to work on the right path of the life. Our greatest thanks are to our parents who bestowed ability and strength in our, to complete this work.
technology, PortBlair. His enthusiasm and optimism made this experience both rewarding and enjoyable.
We are equally grateful to HOD,C.S.E, Dr.B.R.Ambedkar Institute of technology, PortBlair who always encouraged us to keep going with work and always advised with his invaluable suggestions.
We would like to express our sincere gratitude towards, entire faculty and staff members of Dr. B.R.Ambedkar Institute of Technology, PortBlair for their direct-indirect help, cooperation, love and affection for completion this work.
REFERENCES
[1]. R. Plamondon, S. Srihari, On-line and off-line handwriting recognition:
a comprehensive survey, IEEE Trans. Pattern Anal. Mach. Intell. (2000) Correspondence Author – Rajib Bag,
63–84. [email protected] .
[2]. A. Senior, A. Robinson, An off-line cursive handwriting recognition system, IEEE Trans. Pattern Anal. Mach. Intell. 20 (3) (1998) 309–321.
[3]. G. Kim, V. Govindaraju, A lexicon driven approach to handwritten word recognition for real time applications, IEEE Trans. Pattern Anal. Mach. Intell. 19 (4) (1997) 366–379.
[4]. R. Bozinovic, S. Srihari, Off-line cursive script word recognition, IEEE Trans. Pattern Anal. Mach. Intell. 11 (1) (1989) 69–83.
[5]. V. Vapnik, Statistical Learning Theory, Wiley, New York, 1998.
[6]. J. Shawe-Taylor, N. Cristianini, Kernels Methods for Pattern Analysis, Cambridge University Press, Cambridge, 2004.
[7]. F. Camastra, “A SVM-based cursive character recognizer,” in Pattern Recognition, vol. 40, pp. 3721-3727, March 2007.
[8]. J. R. Parker, Algorithms for Image Processing and Computer Vision, John Wiley and Sons, 1997.
[9]. Mathworks MatlabTM – The language of technical computing. Link: http://www.mathworks.com/products/matlab/
[10]. SINGIRESU S. RAO, “Engineering Optimization”, A Wiley -Interscience Publication John Wiley & Sons, Inc.
[11]. Cleber Zanchettin, Byron Leite Dantas Bezerra and Washington W. Azevedo, “A KNN-SVM Hybrid Model for Cursive Handwriting Recognition”, WCCI 2012 IEEE World Congress on Computational Intelligence June, 10-15, 2012 - Brisbane, Australia.
.
[12]. Duda, Hart, and Stork, "Pattern classification" Chapter 5, Wiley, 2000. [13]. Vapnik V. N. “An overview of statistical learning theory’, IEEE Trans . on Neural Networks, 10(5):988–999, 1999.
[14]. Haykin, S. “Neural networks - a comprehensive foundation”, Prentice Hall, 1996.
[15].J. Smola and B. Schölkopf. Learning with Kernels. The MIT Press, Cambridge ,MA, 2002.
[16] ] R.Aruna devi, S.Latha, K.Vidhya, ”Handwritten Character Recognition Using Based Segmentation And Support Vector Machine Classifier” IJART, Vol. 2 Issue 1, 2012.”
AUTHORS
First Author – Rajib Bag, M.Tech, DBRAIT and
Second Author – Gautam, qualifications, DBRAIT and
Third Author – Komal Das, B.Tech, DBRAIT and
Fourth Author – P. Mohini Amma, B.Tech, DBRAIT and