Geosciences Theses Department of Geosciences
5-10-2019
A Disparity Analysis of Health Determinants and
Outcomes in 500 Cities in the United States
Margaret Boateng
Follow this and additional works at:https://scholarworks.gsu.edu/geosciences_theses
This Thesis is brought to you for free and open access by the Department of Geosciences at ScholarWorks @ Georgia State University. It has been accepted for inclusion in Geosciences Theses by an authorized administrator of ScholarWorks @ Georgia State University. For more information, please contactscholarworks@gsu.edu.
Recommended Citation
Boateng, Margaret, "A Disparity Analysis of Health Determinants and Outcomes in 500 Cities in the United States." Thesis, Georgia State University, 2019.
A DISPARITY ANALYSIS OF HEALTH DETERMINANTS AND OUTCOMES IN 500 CITIES IN THE UNITED STATES
By
MARGARET BOATENG Under the Direction of Dajun Dai, PhD
ABSTRACT
Health disparity is an issue of global concern necessitating diverse studies. This study thus, investigated intra city and inter-city health disparity for the 500 largest cities in the United States using the health determinant and outcome data at census tract level from the Centers for Disease Control and Prevention. The Urban Health Index (UHI) approach for small area assessment was used to compute for the UHI and disparity ratios for all 500 cities. Data for socioeconomic status was obtained from 2013-2017 American Community Survey 5-year estimate data. Urban sprawl data was collected from National Cancer Institute. Cities were ranked based on their disparity ratios from best to worst. OLS regression analysis was employed to research the driving factors of disparities. This research found that larger cities recorded higher health disparities than smaller cities. Greater disparities were present in cities in higher residential segregation for African Americans and less availability of cars, but in lower residential segregation for Hispanics. Because the regression residuals in the OLS model were not independent, more advanced models such as
spatial regression models are necessary to investigate the influential factors.
A DISPARITY ANALYSIS OF HEALTH DETERMINANTS AND OUTCOMES IN 500 CITIES IN THE UNITED STATES
by
MARGARET BOATENG
A Thesis Submitted in Partial Fulfillment of the Requirements for the Degree of Master of Science
in the College of Arts and Sciences Georgia State University
Copyright by Margaret Serwaa Boateng
A DISPARITY ANALYSIS OF HEALTH DETERMINANTS AND OUTCOMES IN 500 CITIES IN THE UNITED STATES
by
MARGARET BOATENG
Committee Chair: Dajun Dai
Committee: Jeremy Diem Richard Rothenberg
DEDICATION
ACKNOWLEDGEMENTS
TABLE OF CONTENTS ... VI
LIST OF TABLES ... IX
LIST OF ABBREVIATIONS ... XI
1 INTRODUCTION ... 1
1.1 Background ... 1
1.2 Assessing Health Disparities ... 2
1.3 The Influence of Socioeconomic Status (SES) on Health Disparities ... 4
1.4 Impacts of Residential Segregation and Urban Sprawl on Health ... 5
1.5 Research Question and Objectives ... 7
1.6 Significance of this Study ... 7
2 STUDY AREA AND DATA SOURCES ... 8
2.1 Study Area ... 8
2.2 500 Cities Data ... 9
2.3 Census Data ... 11
2.5.1 UHI Ranking ... 13
2.5.2 Residential Segregation ... 15
2.5.3 Relationship between Health Disparities and Socioeconomic Status in Cities ... 15
3 RESULTS ... 18
3.2 Minority Residential Segregation and Urban Sprawl ... 21
3.3 Correlation and Regression Results ... 25
4 DISCUSSION AND CONCLUSION ... 30
4.1 UHI and Health disparities... 30
4.2 Health Disparities and Socioeconomic Factors ... 31
4.3 Residential segregation and Urban Sprawl ... 32
4.4 Conclusion and Limitations ... 33
APPENDICES ... 41
LIST OF TABLES
Table 1 the 28 Measures of Health Factors ... 10
Table 2 Socioeconomic Variables ... 12
Table 3 Summary Statistics of Disparity Ratio ... 19
Table 4 Associations between Health Disparities, Segregation, Sprawl and Socioeconomic Characteristics ... 27
Table 5 Rotated Factor Structure of Independent Variables ... 28
Table 6 OLS Model Summary ... 29
LIST OF FIGURES
Figure 1 Causal Web of Health Outcomes ... 3
Figure 2 the 500 Largest Cities in the US ... 9
Figure 3 Histogram of Health Disparities ... 17
Figure 4 Disparity Ratio and Rank Order ... 19
Figure 5 Disparity Ratio Ranking for 500 Cities ... 20
Figure 6 Level of Sprawl among Cities ... 22
Figure 7 Black Residential Segregation ... 23
LIST OF ABBREVIATIONS
UHI – Urban Health Index
GIS- Geographical Information Systems GWR - Geographically Weighted Regression FA - Factor Analysis
1 INTRODUCTION
1.1 Background
The health outcomes of cities differ from one geographical region to another both locally and globally. The health of cities is described by complex and interconnected health indicators and health determinants (Rothenberg et al, 2014). Some key questions arise as to how some cities have better health outcomes than others and vice versa. It is also important to know what factors drive the better health outcomes in some regions than others.
Many health disparities in the United States are associated with inequalities in education and income (Drewnowski et al, 2004). In its broadest sense, the term “health disparities” can be explained as preventable differences in the indicators of health of different population groups, often defined by race, ethnicity, sex, educational level, socioeconomic status, and geographic location of residences (Mensah et al, 2005). Health disparities are largely attributed to social determinants of health, the conditions where people are born, grow, live, work, and age (World Health Organization, 2010; Dai et al, 2017).
Generally, researchers have used three different comparisons to assess the association between cities and health (Galea, Freudenberg, & Vlahov, 2005). The first and most common approach compares and contrasts urban to non-urban areas (Chen, Chen, & Cheng, 2017; Eberhardt & Pamuk, 2004; Fotso, 2006; Hartley et al., 1994). Second line of research focuses on cross-urban studies mostly highlighting the differences across cities within a country or across countries (Brown et el., 2000; Davydova, 2005; Hunt et el., 2014; Yerger et al., 2007). The third group of studies seek to investigate intra-urban differences or variability of health within cities or smaller geographical regions (Dai, 2010; Krieger, 2002; Pardo-Crespo et al., 2013).
1.2 Assessing Health Disparities
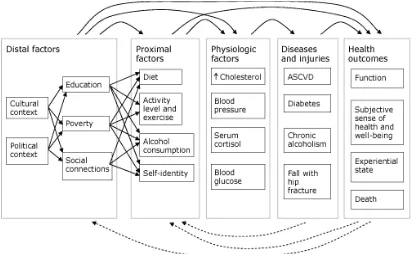
can help to provide responsive measures and action on specific health determinants and population groups to reduce disparity in health outcomes and improve overall level of health (Parrish, 2010). According to Center for Disease Control and Prevention, “an ideal population outcome metric should reflect a population’s dynamic state of physical, mental, and social well-being. Positive health outcomes include being alive; functioning well mentally, physically, and socially; and having a sense of well-being. Negative outcomes include death, loss of function, and lack of well-being”. The Center for Disease Control and Prevention designed a causal web that illustrates relationships among contributing factors that generate health outcomes in a simplified model in figure 1. These factors may contribute to health disparity as different populations exhibit characteristics distinct to their livelihood status.
Figure 1 Causal Web of Health Outcomes
Figure1 demonstrates a causal web that illustrates various factors influencing health out-comes and interactions among them. Solid arrows represent potential causal relationships between factors, diseases, and outcomes. Dashed arrows represent potential feedback from outcomes and diseases on proximal and distal factors. Distal and proximal factors operate through both intermediate factors and directly on health outcomes. For example, a person’s level of education can directly influence his or her subjective sense of health and level of social function and also influence intermediate factors, such as diet and exercise. Similarly, the understanding that death or loss of function may occur as a result of a person’s lifestyle or social and economic factors, such as education and poverty, may influence those factors through either behavior change or changes in social or economic policy.
1.3 The Influence of Socioeconomic Status (SES) on Health Disparities
An individual’s health is undoubtedly affected by socioeconomic factors, the social determinants of health. These socioeconomic factors have been measured based on three indicators, alone or in combination to assess a person’s socioeconomic status. These include an individual’s educational level, income, and occupation (Katz, 2006). Socioeconomic factors are well-recognized to be associated with health disparities within the United States (Spatz, Beckman, Wang, Desai, & Krumholz, 2016) and internationally (Vafaei, Rosenberg, & Pickett3, 2010). Previous researchers have investigated the associations between SES and health disparities within the country by focusing on individual socioeconomic factors simultaneously or individually by focusing on how a population’s income, educational level or occupation trends can affect their health outcomes and consequently lead to health disparities.
lowest income and who are least educated are consistently least healthy than wealthiest and most educated groups (Braveman, Cubbin, Egerter, Williams, & Pamuk, 2010). In response to investigating existing relationships between socioeconomic factors and health disparity, researchers have conducted a wide range of study with supporting findings. A study has found that the association between income and premature mortality was stronger among low-income counties than high-income counties (Cheng & Kindig, 2012). A similar study found mean hospitalization rates to be significantly higher among low-income areas compared with high income areas (Spatz et al., 2016). Further, some researchers have conducted empirical analysis quantifying the relative impact of each socioeconomic measure (income, education and occupation) to assess the strongest predictor of health outcomes. According to Davis et al. (1995), education rather than income or occupation may be the strongest predictor of health outcomes. Ross and Wu (1995), support this by establishing that high educational attainments directly improves health, and also indirectly improves health through work, economic conditions, social-psychological resources, and healthy behaviors.
1.4 Impacts of Residential Segregation and Urban Sprawl on Health
segregated neighborhoods. Given the history of racial segregation in the US, a majority of the research in the past decade have been focused on white/black segregation and health disparities as compared to whites and other minority groups (Yang, Zhao, & Song, 2017). One such study suggested that blacks living in metropolitan areas characterized by high black residential isolation have a higher likelihood of reporting poor health than blacks living in low black isolation neighborhoods (Subramanian, Acevedo-Garcia, & Osypuk, 2005). Similarly, Yang et al (2017) found that blacks who lived in segregated neighborhoods had poor Self-Rated Health than their counterparts in neighborhoods that are more diverse.
A considerable evidence also shows that residential segregation is deleterious to the health of Hispanics. Lee (2009) found positive associations between Hispanic segregation, depression and anxiety and established that living in a Mexican American-dominated neighborhood is detrimental to mental health. Hispanics living in isolation are more exposed to risk factors that facilitates tuberculosis transmission than non-Hispanic Whites (Acevedo-Garcia, 2001). Thus, residential segregation needs to be accounted for, to determine its influence on health disparities among cities in the US.
suburbs increases the risk of overweight or obesity and inadequate physical activity (Garden & Jalaludin, 2008).
1.5 Research Question and Objectives
There is no systematic research at a national scale to study both intra city and inter-city disparities in health in the United States. To fill in this research gap, this thesis, using the 500 cities project from the Centers for Disease Control and Prevention (CDC), raises two research questions: (1) are there any health disparities among these largest 500 cities? (2), if so, what are the possible factors explaining these disparities? These questions led to two primary objectives: (1) assessing the level of health and health disparity of each city by comparative ranking, and (2) examine the factors that influence the disparities in health these cities may demonstrate.
1.6 Significance of this Study
2 STUDY AREA AND DATA SOURCES
2.1 Study Area
Figure 2 the 500 Largest Cities in the US
2.2 500 Cities Data
data where “the higher the value, the worse the measure”. This was done by subtracting the original value from 100.
Table 1 the 28 Measures of Health Factors
Group field Variables Preventive
Care(10)
Taking medicine for high blood pressure control among adults aged > = 18 Years with high blood pressure
Visits to doctor for routine checkup within the past Year among adults aged > = 18 Years
Cholesterol screening among adults aged > = 18 Years
Fecal occult blood test, sigmoidoscopy, or colonoscopy among adults aged 50-75 Years
Older adult men ages > = 65 Years who are up to date on a core set of clinical preventive services: Flu shot past Year, PPV shot ever, Colorectal cancer screening. Older adult women ages > = 65 Years who are up to date on a core set of clinical preventive services: Flu shot past Year, PPV shot ever, Colorectal cancer screening, and Mammogram past 2 Years
Visits to dentist or dental clinic among adults aged > = 18 Years Mammography use among women aged 50-70 Years
Papanicolaou smear use among adult women aged 21-65 Years Current lack of health insurance among adults aged 18-64 Health
Outcomes(13)
Arthritis among adults aged > = 18 Years
High blood pressure among adults aged > = 18 Years
Cancer excluding skin cancer) among adults aged > = 18 Years Current asthma among adults aged > = 18 Years
Chronic obstructive pulmonary disease among adults aged > = 18 Diagnosed diabetes among adults aged > = 18 Years
High cholesterol among adults aged > = 18 Years who have been screened in the past 5 Years
Chronic kidney disease among adults aged > = 18 Years
Mental health not good for > = 14 days among adults aged > = 18 Years Physical health not good for > = 14 days among adults aged > = 18 Years Stroke among adults aged > = 18 Years
All teeth lost among adults aged > = 65 Years Unhealthy
Behavior (5)
Binge drinking among adults aged > = 18 Years Current smoking among adults aged > = 18 Years
No leisure-time physical activity among adults aged > = 18 Years Obesity among adults aged > = 18 Years
Sleeping less than 7 hours’ adults aged > = 18 Years
2.3 Census Data
(less than high school graduate), median income(dollars), poverty status (below 100 percent of the poverty level), mean travel time to work (minutes), no vehicle available, owner-occupied housing units, percent uninsured and Management, business and financial occupation.
Table 2 Socioeconomic Variables
Socioeconomic Variables
Less than high school graduate Speak English less than very well Median income(dollars)
Poverty status (below 100 percent of the poverty level) Mean travel time to work (minutes)
No vehicle available Public transportation
Owner-occupied housing units Percent uninsured
Management, business and financial occupation
2.4 Urban Sprawl Data
metropolitan areas. (Ewing and Hamidi, 2010). Sprawling is a significant phenomenon and key to this research because it alters the physical plan of a geographical area.
Sprawling cities threatens the quality of drinking water sources and the availability of green spaces, which may affect the network of social interactions and even mental health (Frumkin, H., Frank, L., & Jackson, R. J., 2004). Understanding the physical attributes of sprawl within the 500 cities was therefore important to assess its health implications and to aid in developing better future public health policies. The excel data obtained from the sprawl indices on census tracts level had values that ranged between 40-120 where lower values signified less sprawling and more geographical compactness and higher values interprets more urban sprawling. The sprawl data were included in subsequent analysis to assess the impact of urban sprawling on health disparities.
2.5 Methods
2.5.1 UHI Ranking
To be able to assess health disparities for these 500 cities, WHO’s Urban Health Index was used. The Urban Health Index (UHI) method developed by the World Health Organization Centre for Health Development (WHO Kobe Centre) provides a flexible approach for identifying intra-urban disparities for small geographic areas (Rothenberg et al., 2014).
To calculate for the UHI, values for each indicator is standardized. For each indicator, which in this case is a variable at each census tract, for example cancer rates among adults aged > = 18 Years, the actual value is transformed into a dimensionless proportion: the distance of the value from minimum, divided by the range:
I
S=
𝐼𝑖 – 𝑚𝑖𝑛∗(𝐼)ISis the standardized indicator, I
i is the observation, e.g., cancer rate in a census tract, “max
(I)” is the maximum value for that indicator, e.g., the highest cancer rate of a census tract in the country, and “min*(I)” is the minimal value, e.g., lowest cancer rate of a census tract in the country altered by a very small amount, which in this case is 10% of the standard deviation, to avoid zero values in the numerator. In small areas for which Ii is the minimum value, the numerator would be zero without this small alteration, rendering the UHI for that area zero. After standardizing the indicators that were used in the index, the indicators then become the same logical type in terms of the proportions of the range. These indicators are then combined using the geometric mean approach:
where IiS is the ith standardized indicator.
2.5.2 Residential Segregation
Segregation has been measured along five distinct dimensions: clustering, isolation, centralization, concentration and unevenness (Chang, 2006; Massey & Denton 1988). This research focused on the isolation aspect, which is a common practice to investigate the extent to which Black and Hispanic groups were isolated from other groups in geographical settings. The isolation index is calculated as follows; assuming finding the black isolation index for city j which consists of n census tracts, the formula is explained as follows:
𝑅𝑗 = ∑
𝑏𝑖 𝑏𝑡𝑜𝑡𝑎𝑙 𝑛
𝑖=1
×𝑏𝑖 𝑇𝑖
where i is the ith census tract in the city j, bi is the black population in i, btotalis the total
black population in j, and Ti is the total population in census tract i. The isolation index ranges
between 0 and 1 where 0 interprets no segregation and 1, maximal segregation (Massey and Denton, 1988) The resulting values of the index can be interpreted as the chance of having blacks as neighbors. (Dai, 2010; Hass et al., 2008). For instance, a black residential segregation index of 0.65 means that, on average, a Black person lives in a neighborhood where 65% of his or her co-residents are also Black. This study considered residential segregation for Blacks and Hispanics separately.
2.5.3 Relationship between Health Disparities and Socioeconomic Status in Cities
3 RESULTS
3.1 UHI
The results of disparity ratios generated values ranging from 1.098 to 3.22. Lower values explain low disparity ratios and higher values denotes high disparity ratios. Cities were ranked based on their disparity ratios from 1 to 500, one being the “best” city with lowest health disparity and 500 being the “worst” city with very high disparity. The best-off city—Cicero, Illinois-- recorded the lowest disparity of 1.098. It suggests the best part of the area in Cicero is 1.098 times better off than the worst part of Cicero. In contrast, Champagne Illinois was found to be the worst-off city with a disparity ratio of 3.22 (Table 3), suggesting the best area of Champagne is 3.22 times better than the worst area of Champagne.
Table 3 Summary Statistics of Disparity Ratio
Figure 4 Disparity Ratio and Rank Order
3.2 Minority Residential Segregation and Urban Sprawl
The residential segregation indices generated output values ranging between 0-1 where values closer to zero suggests less segregation and values closer to one indicate high rates of residential segregation. Black residential segregation was high around eastern areas of the United States with observed clustered patterns throughout the north eastern to south eastern areas (Figure 5). On the other hand, Hispanic segregation was clustered on the south western areas of the country with a few clustered observations on the extreme north eastern region (Figure 6). Both Hispanic and Black segregation are concentrated in the states located at the extreme north eastern areas such as New Jersey, New York, Connecticut and Massachusetts.
3.3 Correlation and Regression Results
As shown in Table 4, health disparities are significantly correlated (p< 0.05) with segregation and socioeconomic factors except for income and sprawl. Language is strongly correlated with education and Hispanic segregation. Income has a strong positive association with financial occupation and poverty. In addition, there is a strong positive relationship between no vehicle available and public transport. However, there are significantly negative associations between poverty status and financial occupation including owner-occupied housing units. Multicollinearity exists among these variables especially among the socioeconomic variables which may affect interpretation of the results.
The factor analysis method was used to remove multicollinearity to ensure that
observations are independent to avoid violating that regression assumption. Four factors were generated from the factor analysis. These four factors explain 80% of the total variance in the original dataset, reducing its complexity. Factor 1 loads three main variables which include median income, poverty status and financial occupations. Factor 2 loaded mainly four variables. These include educational level, language, uninsured persons and Hispanics residential
segregation. A high factor 2 implies high suggests high levels of uneducated persons, persons that speak English less than very well, uninsured persons and high Hispanic segregation. Factor 3 characterizes three main factors reflecting transportation challenges and owner-occupied housing units. The transportation challenges include no vehicle available and public transportation. Factor 4 positively loads one main variable which is average urban sprawl (Table 5).
therefore added to the four factors to make a total of five independent variables for regression analysis. The OLS regression model suggested that the five factors explained 14.9% of variance of the dependent variables that is the health disparity ratios. An R value of .386 suggests a low correlation between dependent and independent variables used for the regression (Table 6). Significance values generated from ANOVA <.05 suggests that that there is a statistically significant relationship between the dependent variable and Black segregation, Hispanic segregation and no vehicle available. However, Hispanic segregation presents a negative correlation, which suggests greater values of Hispanic segregation were associated with decreased disparity ratios. There was no statistically significant associations between health disparities and median income as well as urban sprawl (Table 7).
Table 4 Associations between Health Disparities, Segregation, Sprawl and Socioeconomic Characteristics
Sprawl 1
Lang 0.051 1
Educ 0.012 .732** 1
Income -0.002 .117** .549** 1
Poverty -0.021 0.062 .492** .820** 1
Travel 0.039 .422** .192** .321** -.340** 1
No_veh -0.059 .172** .211** .194** .401** .113* 1
Public_tra -0.022 .236** .092* 0.079 .118** .356** .846** 1
Own_occu 0.05 .272** .360** .418** -.609** .145** -.599** -.455** 1
Uninsured .166** .504** .666** .500** .394** -0.008 0.052 -0.077 -.237** 1
Financial -0.017 .243** .681** .866** -.690** .176** -.147** .090* .339** -.484** 1
BlackSeg 0.015 .252** 0.069 .317** .479** -.091* .375** .225** -.303** .163** -.197** 1
HispSegh 0.058 .781** .776** .245** .162** .324** 0.083 0.069 -.189** .625** -.366** -.240** 1
Disparity -0.011 .269** .273** -0.053 .224** .255** .224** .209** -.306** -.128** .155** .312** -.239** 1
Sprawl Lang Educ Income Poverty Travel No_veh Public_tra Own_occu Uninsured Financial BlackSeg HispSeg Disparity ** Correlation is significant at the 0.01 level (2-tailed).
Table 5 Rotated Factor Structure of Independent Variables
Variables Factor 1 Factor 2 Factor 3 Factor 4
Urban sprawl 0.027 0.05505 -0.05255 0.94266
Less than high school graduate 0.036 0.91568 0.14923 -0.0292
Speak English less than very well -0.475 0.80932 0.11239 -0.00235
Median income(dollars) 0.918 -0.1736 -0.04782 -0.0054
Poverty status (below 100 percent of the poverty level) -0.877 0.05034 0.31847 -0.00219
Mean travel time to work (minutes) 0.552 0.49642 0.25773 0.10635
No vehicle available -0.139 0.0614 0.92639 -0.03776
Public transportation 0.196 0.11547 0.92391 -0.01031
Owner-occupied housing units 0.464 -0.1437 -0.64077 0.10550
Percent uninsured -0.491 0.61267 -0.05816 0.27038
Management, business and financial occupation 0.820 -0.3420 0.01117 0.00956
Black segregation -0.442 -0.3236 0.46409 0.26103
Hispanic segregation -0.1214 0.92146 -0.01267 0.00059
Table 6 OLS Model Summary
Table 7 Coefficients of OLS
R R Square Adjusted R Square Std. Error
.386a 0.149 0.140 0.16575
Unstandardized Coefficients Standardized Coefficients
Model B Std. Error Beta t Sig
(constant) .390 .017 23.455 .000
Black Segregation .166 .038 .203 4.332 .000
Hispanic Segregation -.167 .036 -.202 -4.646 .000
4 DISCUSSION AND CONCLUSION
4.1 UHI and Health disparities
This thesis research sought to investigate the spatial distribution of health disparities among the 500 largest cities in the United States and the driving factors of the disparities. The UHI approach was used as a small area disparity assessment tool which recorded both intra city and intercity disparities among the cities. To achieve the second objective, socioeconomic factors were employed to examine their extent of influence on the recorded disparities by adopting OLS regression. Both bivariate correlation and OLS were used to analyze relationships between dependent and independent variables. Black and Hispanic segregation as well as unavailability of personal vehicles had a significant influence on health disparities among cities.
Furthermore, this research revealed that larger cities have higher health disparities as compared to smaller cities as shown in Figure 4. However, a few larger cities were found to be among the first 100 cities with low health disparities while some smaller cities were ranked among the last 100 cities with the largest disparities. Past studies have also found that substantial inequalities among urban population is partly due to common spatial and socioeconomic factors (Chandola, 2012). Living in cities or urban areas is accompanied by both pros and cons. The concept of “urban health advantage” comes into play here, which explains that people living in cities enjoy better health care access as opposed to rural areas and is therefore a driving force to better health outcomes of cities (Vlahov, Galea, & Freudenberg, 2005). That could explain the reason why certain larger cities among the 500 cities ranked among the first 100 with low health disparities and lower UHI values within its census tracts.
healthy behaviors and influence the quality of health in such areas (Koplan and Fleming, 2000). That notwithstanding, cities also have many other built social and physical environmental features that might have an influence on population health (Richardson et al., 2012). Health levels of cities are largely dependent on residents’ conditions and lifestyle which results from a complicated interaction of health determinants; physical, economic and social, in residential environments (Takano T & K, 2001).
4.2 Health Disparities and Socioeconomic Factors
health care profoundly affect health, wellbeing and safety of growing urban populations (Badland et al., 2014).
4.3 Residential segregation and Urban Sprawl
Segregation of minority population influences health disparities of cities. Clustering of minority populations allows for characteristics of racial traits to be centered on specific geographical areas, which in turn results in disparities. The persistence of racial/ethnic disparities, particularly black health disparities, is measured across multiple mortality and morbidity outcomes (White & Borrell, 2011). The OLS regression model as well as bivariate correlation in this research found a significant correlation between black residential segregation and health disparities, which is in line with past studies.
that residing in highly segregated areas for minorities’ impacts overall disparities of a city’s population.
Urban sprawl did not present any significant relationship with the disparities among cities. This is different compared to previous literature that have established associations
between these two factors (Ewing et al., 2006; Garden & Jalaludin, 2009). However, such studies assessed urban sprawl’s influence on specific health indicators such as obesity and diseases associated with physical inactivity (Lopez & Hynes, 2006; Ewing et al., 2003; Zhao & Kaestner, 2010; Plantinga & Bernell, 2007). Health disparity as computed in this research is a compound of several health indicator variables without focusing on specific diseases, as such a combination might affect the strength of correlation with urban sprawl.
4.4 Conclusion and Limitations
REFERENCES
Acevedo-Garcia, Dolores (2001). Zip Code-Level Risk Factors for Tuberculosis: Neighborhood Environment and Residential Segregation In New Jersey, 1985–1992. American Journal of Public Health 91:734–41
Adler, N., & Rehkopf, D. (2008). US disparities in health: descriptions, causes, and mechanisms. Public Health, 29. doi:10.1146/annurev.publhealth.29.020907.090852
Amey C, Miller M, Albrecht S. The role of race and residence in determining stage at diagnosis of breast cancer. J Rural Health. 1997; 13:99–108.
Badland, H., Whitzman, C., Lowe, M., Davern, M., Aye, L., Butterworth, I., . . . Giles-Corti, B. (2014). Urban liveability: emerging lessons from Australia for exploring the potential for indicators to measure the social determinants of health. Soc Sci Med, 111, 64-73. doi:10.1016/j.socscimed.2014.04.003
Braveman, P. A., Cubbin, C., Egerter, S., Williams, D. R., & Pamuk, E. (2010). Socioeconomic Disparities in Health in the United States: What the Patterns Tell Us. Am J Public Health, 100(10), 186-196. doi:10.2105/
Brown, E., Wyn, R., & Teleki, S. (2000). Disparities in Health Insurance and Access to Care for Residents Across U.S. Cities. UCLA: Center for Health Policy Research. Retrieved from https://escholarship.org/uc/item/0725q4xf
Center for Disease Control and Prevention (2015). 500 Cities Project: Local Data for Better Health. Chandola, T. (2012). Spatial and social determinants of urban health in low-, middle- and
high-income countries. Public Health, 126(3), 259-261. doi:10.1016/j.puhe.2011.12.008 Chang, V.W., 2006. Racial residential segregation and weight status among US adult. Social
Science and Medicine 63, 1289–1303.
Chen, C. C., Chen, L. W., & Cheng, S. H. (2017). Rural-urban differences in receiving guideline-recommended diabetes care and experiencing avoidable hospitalizations under a universal coverage health system: evidence from the past decade. Public Health, 151, 13-22. doi:10.1016/j.puhe.2017.06.009
Chu, K., Tarone, R., Kessler, L., Ries, L., Hankey, B., Miller, B., & Edwards, B. (1996). Recent trends in US breast cancer incidence, survival, and mortality rates. JNCI Cancer Spectrum, 88.
Comber, A., & Harris, P. (2018). Geographically weighted elastic net logistic regression. Journal of Geographical Systems, 20(4), 317-341. doi:10.1007/s10109-018-0280-7
D.S. Massey, N.A. Denton (1988). The dimensions of residential segregation. Social Forces, 67 (2), pp. 281-315.
Dai, D. (2010). Black residential segregation, disparities in spatial access to health care facilities, and late-stage breast cancer diagnosis in metropolitan Detroit. Health Place, 16(5), 1038-1052. doi:10.1016/j.healthplace.2010.06.012
Davydova, S. (2005). Heavy metals as toxicants in big cities. Microchemical Journal, 79(1-2), 133-136. doi:10.1016/j.microc.2004.06.010
DeChello, L., & Sheehan, T. (2007). Spatial analysis of colorectal cancer incidence and proportion of late-stage in Massachusetts residents: 1995 - 1998. International Journal of Health Geographics, 6. doi:10.1186/1476-072x-6-20
Eberhardt, Mark S. and Elsie R. Pamuk(2004). The Importance of Place of Residence: Examining Health in Rural and Nonrural Areas. American Journal of Public Health, Vol 94, No. 10 Reid Ewing, Ross C. Brownson, David Berrigan (2006). Relationship Between Urban Sprawl and
Weight of United States Youth. American Journal of Preventive Medicine. doi:10.1016/j.amepre.2006.08.020
Ewing, R., Schmid, T., Killingsworth, R., Zlot, A., & Raudenbush, S. (2003). Relationship between Urban Sprawl and Physical Activity, Obesity, and Morbidity. American Journal of Health Promotion, 18(1), 47–57
Farmer, M. M., & Ferraro, K. F. (2005). Are racial disparities in health conditional on socioeconomic status? Soc Sci Med, 60(1), 191-204. doi:10.1016/j.socscimed.2004.04.026 Fotso, Jean-Christophe (2006) Child health inequities in developing countries: differences across
urban and rural areas. International Journal for Equity in Health 10.1186/1475-9276-5-9 Galea, S., Freudenberg, N., & Vlahov, D. (2005). Cities and population health. Soc Sci Med, 60(5),
1017-1033. doi:10.1016/j.socscimed.2004.06.036
Griffith, D.A., Amrhein, C.G., (1997). Multivariate Statistical Analysis for Geogra- phers. Prentice Hall, Upper Saddle River, NJ.
Haas, J.S., Earle, C.C., Orav, J.E., Brawarsky, P., Neville, B.A., Williams, D.R. (2008). Racial segregation and disparities in cancer stage for seniors. Journal of General Internal Medicine 23, 699–705.
Hartley, D. , Quam, L. and Lurie, N. (1994), Urban and Rural Differences in Health Insurance and Access to Care. The Journal of Rural Health, 10: 98-108. doi:10.1111/j.1748-0361.1994.tb00216.x
Health Impact Assessment (2013). World Health Organisation, www.who.int/hia/evidence/doh/en Hunt Bijou R., Steve Whitman, Marc S.Hurlbert (2014). Increasing Black:White disparities in breast cancer mortality in the 50 largest cities in the United States. Cancer Epidemiology, Volume 38, Issue 2, Pages 118-123
Katz, J. N. (2006). Lumbar Disc Disorders and Low-Back Pain: Socioeconomic Factors and Consequences. The Journal of Bone & Joint Surgery, Volume 88(suppl_2) Supplement 2, p 21–24.
Kindig, D. A., Asada, Y., & Booske, B. (2008). A Population Health Framework for Setting National and State Health Goals. JAMA, 299(17), 2081-2083. doi:10.1001/jama.299.17.2081
Koplan JP, Fleming DW. Current and Future Public Health Challenges. JAMA. 2000;284(13):1696–1698. doi:10.1001/jama.284.13.1696
Krieger Nancy, Jarvis T. Chen, Pamela D. Waterman, Mah-Jabeen Soobader, S. V. Subramanian, Rosa Carson (2002), Geocoding and Monitoring of US Socioeconomic Inequalities in Mortality and Cancer Incidence: Does the Choice of Area-based Measure and Geographic Level Matter?: The Public Health Disparities Geocoding Project, American Journal of Epidemiology, Volume 156, Issue 5, Pages 471–482
Landrine, H., & Corra, I. (2009). Separate and Unequal: Residential Segregation and Black Health Disparities. Ethnicity and Disease, 19(19), 179-184.
Lee Min-Ah (2009). Neighborhood residential segregation and mental health: A multilevel analysis on Hispanic Americans in Chicago. Social Science & Medicine, Volume 68, Issue 11, Pages 1975-1984
LI, C., Malone, K., & Daling, J. (2003). Differences in breast cancer stage, treatment, and survival by race and ethnicity. Archives of internal medicine, 163. doi:10.1001/archinte.163.1.49 Lopez, R. (2004). Urban Sprawl and Risk for Being Overweight or Obese. American Journal of
Public Health, 94(9), 1574-1579.
Marmot, M., & Friel, S. (2008). Global health equity: evidence for action on the social determinants of health. J Epidemiol Community Health, 62(12), 1095-1097. doi:10.1136/jech.2008.081695
Massey, D.S., Denton, N.A., (1988). The dimensions of residential segregation. Social Forces 67, 281–315.
McLafferty, S. and Wang, F. (2009), Rural‐urban disparities in late‐stage cancer risk in Illinois, 115: 2755-2764. doi:10.1002/cncr.24306
Mieskowski P, Mills E (1993). The causes of metropolitan suburbanization. J Econ Perspect. Vol 7(3):135–147.
Murray, C. J., Kulkarni, S., & Ezzati, M. (2005). Eight Americas: new perspectives on U.S. health disparities. Am J Prev Med, 29(5 Suppl 1), 4-10. doi:10.1016/j.amepre.2005.07.031 Nelson A. Unequal treatment: confronting racial and ethnic disparities in health care. J Natl Med
Assoc. 2002;94(8):666-8.
Pardo-Crespo MR, Narla NP, Williams AR, et al (2013). Comparison of individual-level versus area-level socioeconomic measures in assessing health outcomes of children in Olmsted County, Minnesota J Epidemiol Community Health;67:305-310
Parrish, R. G. (2010). Measuring Population Health Outcomes. Public Health Research, Practice, and Policy, VOLUME 7: NO. 4, A71.
Plantinga Andrew J., Stephanie Bernell (2007). The Association Between Urban Sprawl And Obesity: Is It A Two‐Way Street? Journal of Regional Science. https://doi.org/10.1111/j.1467-9787.2007.00533.x
Roberts, B., & Wilson, R. (2009). Urban Segregation and Governance in the Americas: Palgrave Macmillan US.
Ross, Catherine E., and Chia-ling Wu. “The Links Between Education and Health.” American Sociological Review, vol. 60, no. 5, 1995, pp. 719–745. JSTOR, www.jstor.org/stable/2096319.
Rothenberg, R., Weaver, S. R., Dai, D., Stauber, C., Prasad, A., & Kano, M. (2014). A flexible urban health index for small area disparities. J Urban Health, 91(5), 823-835. doi:10.1007/s11524-014-9867-6
Russell P Lopez, H Patricia Hynes (2006). Obesity, physical activity, and the urban environment: public health research needs. Environmental Health, doi:10.1186/1476-069X-5-25
Rydin, Y., Bleahu, A., Davies, M., Dávila, J. D., Friel, S., De Grandis, G., . . . Wilson, J. (2012). Shaping cities for health: complexity and the planning of urban environments in the 21st century. The Lancet, 379(9831), 2079-2108. doi:10.1016/s0140-6736(12)60435-8
Spatz, E. S., Beckman, A. L., Wang, Y., Desai, N. R., & Krumholz, H. M. (2016). Geographic Variation in Trends and Disparities in Acute Myocardial Infarction Hospitalization and Mortality by Income Levels, 1999-2013Trends and Disparities in Acute Myocardial Infarction by Income LevelsTrends and Disparities in Acute Myocardial Infarction by Income Levels. JAMA Cardiology, 1(3), 255-265. doi:10.1001/jamacardio.2016.0382 Subramanian, S. V., Acevedo-Garcia, D., & Osypuk, T. L. (2005). Racial residential segregation
and geographic heterogeneity in black/white disparity in poor self-rated health in the US: a multilevel statistical analysis. Soc Sci Med, 60(8), 1667-1679. doi:10.1016/j.socscimed.2004.08.040
Takano T, & K, N. (2001). An analysis of health levels and various indicators of urban environments for Healthy Cities projects. Journal of Epidemiology & Community Health, 55, 263-270.
Tian, N., Wilson, J., & Zhan, F. (2011). Spatial association of racial/ethnic disparities between late-stage diagnosis and mortality for female breast cancer: where to intervene?
International Journal of Health Geographics, 10(1), 24. doi:10.1186/1476-072x-10-24 Vafaei, A., Rosenberg, M. W., & Pickett3, W. (2010). Relationships between income inequality
Vlahov, D., Galea, S., & Freudenberg, N. (2005). The urban health "advantage". J Urban Health, 82(1), 1-4. doi:10.1093/jurban/jti001
Wang, Y., Holt, J. B., Xu, F., Zhang, X., Dooley, D. P., Lu, H., & Croft, J. B. (2018). Using 3 Health Surveys to Compare Multilevel Models for Small Area Estimation for Chronic Diseases and Health Behaviors. Preventing chronic disease, 15, E133. doi:10.5888/pcd15.180313
White, K., & Borrell, L. N. (2011). Racial/ethnic residential segregation: framing the context of health risk and health disparities. Health Place, 17(2), 438-448. doi:10.1016/j.healthplace.2010.12.002
Williams, D. R., & Collins, C. (2001). Racial Residential Segregation: A Fundamental Cause of Racial Disparities in Health. Public Health Reports (1974-), Vol. 116, pp. 404-416. Yang, T. C., Zhao, Y., & Song, Q. (2017). Residential segregation and racial disparities in
self-rated health: How do dimensions of residential segregation matter? Soc Sci Res, 61, 29-42. doi:10.1016/j.ssresearch.2016.06.011
Yerger, V. B. & Przewoznik, J. & Malone, R. E. (2007). Racialized Geography, Corporate Activity, and Health Disparities: Tobacco Industry Targeting of Inner Cities. Journal of Health Care for the Poor and Underserved 18(6), 10-38. Johns Hopkins University Press. Retrieved April 20, 2019, from Project MUSE database.
APPENDICES
Appendix A: The First 100 Cities and Disparity Ranks
City name Rank City name Rank City name Rank City name Rank
Cicero 1 Clifton 29 Santa Maria 57 West Jordan 85
Lakewood 2 Bellflower 30 Burbank 58 Manchester 86
Parma 3 Paterson 31 Salinas 59 Concord 87
South Gate
4 Westminster 32 Escondido 60 Pawtucket 88
Pharr 5 Napa 33 Livonia 61 Camden 89
Ogden 6 Deltona 34 Flint 62 Trenton 90
Redondo Beach
7 Miami
Gardens
35 Hollywood 63 Independence 91
Downey 8 Manteca 36 St. George 64 Allentown 92
Lynwood 9 Sioux City 37 Bloomington 65 Inglewood 93
Warren 10 Warwick 38 Compton 66 Lowell 94
Kennewick 11 Citrus Heights
39 Palmdale 67 Mesquite 95
Fishers 12 Port St. Lucie
40 Portland 68 Santa Monica 96
Brockton 13 Whittier 41 Longview 69 Mount
Vernon
97
Norwalk 14 Westland 42 Simi Valley 70 Nampa 98
Union City 15 Springfield 43 Clearwater 71 Roswell 99
Garden Grove
16 Modesto 44 Cape Coral 72 Perris 100
Gary 18 Moreno Valley
46 Santa Ana 74
Medford 19 Sandy 47 Merced 75
Elizabeth 20 Broken Arrow
48 Hemet 76
New Bedford
21 Gresham 49 Lafayette 77
Palm Coast
22 Reading 50 San Mateo 78
Norwalk 23 Redding 51 Waukesha 79
Hialeah 24 Temecula 52 Tracy 80
Fort Smith 25 St. Joseph 53 Arlington Heights
81
Sterling Heights
26 Santa Rosa 54 Newport
Beach
82
Southfield 27 Spokane Valley
55 Wyoming 83
Apple Valley