Abstract — Computer Aided Diagnosis (CAD) combining engineering approach and medical approach is popular in medical works. Bone fracture detection system which is medical image processing is one important system in CAD field. The purpose of this work is that Lower Leg Bone (Tibia) in x-ray image is used to detect fracture or not by computer vision system. Bone fracture is a common problem which is mostly encountered in recent year. Using image processing tools, bone injury diagnosis is developed to be more accurate and reliable. Generally, fracture detection systems use image processing tools in matlab based on mathematical calculation. Automatic fracture detection system can effectively aid to doctors and radiologists to overcome heavy workload. The proposed system was implemented by preprocessing, feature extraction and classification. Sharpening is used for preprocessing, Harris corner detection is used for corner feature and SVM is used for classification. According to the result, the algorithm can correctly classify normal bone and broken bone with good accurate and quick rate with efficient features and single classifier.
Keywords: Tibia, X-ray, Sharpening, Harris, SVM.
INTRODUCTION
In recent year, Computer Aided Diagnosis becomes popular which can help the physicians and radiologists by computerized system. Sometimes doctors may encounter many patients with large of x-ray images so tired doctors can decide miss decisions. Moreover, manual inspection is tedious and time consuming. CAD systems are used to support the detection and characterization of disease.CAD can be applied to digital images for the purpose of addressing a variety of diagnostic problems. And then, many applications in medicine are using widely image processing techniques.
In many places, the problem of bone fracture mostly happens because of bone cancer, accident, osteoporosis, high pressure. Various types of bone fracture are compound, oblique, comminute, transverse, greenstick and spiral. To detect fracture, x-rays are most commonly used. Computerizing fracture detection in bone from x-ray images makes an orthopaedicians to work easy and also
Wint War Myint is with the Department of Electronic Engineering, Yangon Technological University, Gyogone, Insein, PO, 1011, Yangon, Myanmar (corresponding author to provide phone: 09960031700; e-mail: [email protected]).
Dr. Hla Myo Tun is now with the Department of Department of Electronic Engineering of Yangon Technology University, Gyogone,
Insein, PO,1011, Yangon, Myanmar(e-mail: hlamyotun.ytu@gmail .com).
Dr. Khin Sandar Tun is with the Department of Electronic Engineering of Yangon Technology University, Gyogone, Insein, PO, 1011, Yangon, Myanmar (e-mail: [email protected] ).
helps them in diagnosing the fractured system. Though the MRI and CT scans give the most reliable and high-quality. x-ray also give good quality images at a low price DICOM, the standard format for the storage of medical images which includes text [2].X-ray machine take bone position by 53 kV and 4mAs using sensor plate. Using this plate, x-ray images can be printed.
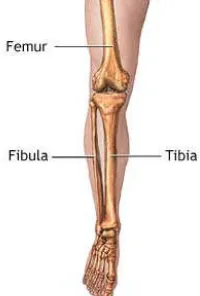
[image:1.595.370.470.566.714.2]Human body has 206 bones. The second largest bone is leg bone which is made up of two bones, the tibia and fibula. The tibia bone is larger and ticker than the fibula bone. Moreover, tibia fracture most commonly happens because it carries the significant portion of the body weight [1]. The central goal in this paper is detection of the lower leg bone (tibia bone) fracture from x-ray images. This paper is summarized as follow: section II presents Litecture study of the related work. Section III explains the background theory and section IV discusses the methodologies of the proposed method. Section V discusses simulation results and discussion of the result. The last section is that conclusion of the result and future direction will be discussed.
Figure 1. Lower Leg Bone of Human Body
Analysis on Detecting of Leg Bone Fracture from X-ray Images
Wint War Myint1, Hla Myo Tun2, Khin Sandar Tun3
1,2,3Department of Electronic Engineering, Yangon Technological University
Republic of the Union of Myanmar
[email protected],[email protected], [email protected]
DOI: 10.29322/IJSRP.8.9.2018.p8150
RELATED WORKS
San Myint et al [1] present Leg Bone Fracture in x-ray image with preprocessing, segmentation, fracture detection and classification algorithm. In this work, feature extraction is carried out by Hough Transform technique to get line feature. Simulation result is that it can detect fracture or not in the image. It can be extent on small bone, ankle fractures. Fracture detection is carried out with classification approach. Visala DeepilaVegi et al [2] uses fracture detection system with preprocessing, segmentation and Hough Transform technique. There is no classification method .The author also describes comparing the detectors in segmentation. They are Sobel, Prewitt, Roberts and Canny. The author gives conclusion which is Sobel Edge detector is more efficient than the rest of the edge detectors for detecting Hough lines. The result helps the orthopaedicians to identity the fractured area of the bone in no time with transform approach. Future work is identification of type of fracture for radiologists. S.K.Mahendran, et al [3] describe tibia fracture detection with fusion classification techniques in x-ray images. This work is performed SACEN algorithm for preprocessing, wavelets and morphological and active contour based segmentation for segmentation. GLCM features are used for fusion classification. They observe that the results improve accuracy than single classifier. They describe future consideration is that other features like shape are to be considered for detection rate. They also publish ensemble system for fracture detection [4].In this work, results clearly indicates that combination classifiers shows high performance but time is considered single classifier works better. Mahmoud Al-Ayyoub, et al [5] apply various feature extraction methods, binary classification and 5-class classification .In the result, SVM classifier is the most accurate with 85%than 10-fold cross validation technique .But author emphasize classification, no detail explanation for feature extraction process.
BACKGROUND THEORY
Automatic bone fracture detection from x-ray images become popular as an important process in analysis of medical images for orthopaedicians and radiologists. Different types of medical images are X-ray, Magnetic Resonance Imaging (MRI), ultrasound, Computed Tomography (CT) etc. Among them, CT and X-ray are most frequently found in diagnosis of fracture. They are ease and fast for doctor to acquire the fractures of bone and joints[6].Automatic detection bone fracture system are most commonly done by preprocessing, segmentation, feature extraction (or) fracture detection and classification.
A. Preprocessing
Several medical images are noisy due to sensor and circuitry /digital camera so image data can degrade with respect to brightness value and geometry. Preprocessing step is to enhance the image in term of reducing noise and adjusting image intensity values. Resolution, brightness and contrast adjustment are included in preprocessing phase. The main goal of image enhancement is to remove noise, sharpen image edges and get soft focus (blurring) effect.
Image enhancement can be completed both in the spatial and in frequency domain. In spatial filtering can be
divided into liner filtering and non-linear filtering.Using of both linear and nonlinear filtering in image enhancement is for noise removal. Several noises are found in images. Typical noise are ‘ salt and pepper’ and Gaussian noise [6]. There are number of different filters for removing this noise. They are:
• Mean filter or Averaging filter
The mean filter, liner filter replaces each pixel by average of all intensity values in local neighbourhood. The size of the neighbourhood controls the amount of filtering. Mean filtering may be used as a method for suppressing noise in an image. But, there are some limitations in mean filter.
• Median filter
Median filters are statistical non-linear filters often described in spatial domain. A median filter is smooth image by utilizing median of neighborhoods. Median filters perform with two steps. Firstly, all pixels in neighborhoods of the pixel in image which are identified by the mask are sorted in the ascending (or) descending order. Secondly, the median of sorted value is computed and is chosen as the pixel value for the process image.
• Gaussian filter
Gaussian filters are very significant not only theoretical but also practical reasons. Gaussian is type of linear smoothing filter according to weight chosen Gaussian function shape. The Gaussian kernel is broadly applied for smoothing resolution.
2-D Gaussian function can be stated by ;
f (x ,y)=
) 2 (
2
2 2 2
2
1
σπσ
y x
e
+ −
(1)
where, σ is the width of Gaussian
Gaussian filter is separable. The Gaussian smoothing filters are very fine filters for removing noise drawn from a normal distribution. Gaussian functions have properties. Gaussian function are rotationally symmetric in two dimensions. The smoothening degree is controlled via variance σ.
The larger σ indicates a wider Gaussian filter and greater smoothening.
Filtering is also used in edge detection. Derivative
filter for discontinuities , First-order edge
detection(Prewitt , Sobel and Roberts, edge detector filter kernels, linearly separable filtering),Second-order edge detection(Laplacian edge detection, Laplacian of Gaussian, Zero-crossing detector) are filtering method using respective kernels and operators for edge detection.
An edge enhancement method is frequently recognized as image sharpening
•Laplacian Edge Sharpening
for enhancement good detail in the image imitatively.
Ioutput(x,y)=Iin
(x,y)-2
∇
Iin(x,y) (2)where,
∇
2is Laplacian operator. •Unsharp Mask FilterAn another edge enhancement filter to Laplacian-based methods is the unsharp mask filter ( boost filtering). Unsharp filtering works by subtracting a smoothed (or unsharp) form of an image from the original to emphasize or enhance the high-frequency component (edges) in the image. This operator creates an edge image from the original image by the following equation:
I edge(c,r)=Ioriginal(c,r)-Ismoothed(c,r) (3)
The original is filtered with a mean or a Gaussian kernel. Image from resulting difference is added onto the original to result some sharpening degree.
Ienhanced(c,r)=Ioriginal(c,r)+k(Iedges(c,r)) (4)
where, k is scaling factor.
In this paper, Unsharp Masking Filter is used for enhancement and finding edge in image. So,edge detection step can be done in preprocessing stage.
B. Segmentation
Image Segmentation is the process of partitioning an image into group of pixels. Image segmentation can be broadly classified into two types: local segmentation and global segmentation. Image segmentation can be approached from three philosophical perspectives: Edge approach, Boundary approach, Region approach.
Edge detection is the process of finding meaningful transitions in an image. The points where sharp changes in the brightness. These points can be detected by computing intensity differences in local image. Edge-based segmentation is more suitable for bone fracture detection system [1]. In this paper, Canny edge detection method can be produced good view of the bone position. The Canny operator works in a multi-stage process. But, Sobel edge detection algorithm is more efficient in speed compared the Canny edge detection method [9]. Sobel edge operator is member of gradient method family and it used to find the absolute value of the gradient magnitude in the image [10]. Prewitt, Roberts, Log edge detection algorithm are also used in respective application. An enhanced active contour model using region growing algorithm to calculate initial seeds presented in [9]. K-means Clustering method is the simplest method in unsupervised classification. K-mean clustering is an iterative procedure. The K-means clustering algorithm clusters data by iteratively computing a mean intensity for each class and segmenting the image by classifying in the class with the closet mean. K-mean based algorithm is used in shaft segmentation by minimizing and objective function [11].However, our work uses finding edge process by Unshrpe Making algorithm, there is no need other segmentation process.
C. Feature Extraction (or) Fracture Detection
A feature is an image characteristic that can capture certain visual property of image. Feature Extraction is main step in various image processing. According to the favourable features, there are number of feature extraction techniques.
• GLCM (Gray Level Co-occurrence Matrix) is used for extraction of features. Texture images are complex visual patterns with color, brightness, size and shape. GLCM is a statistical technique to point out image texture. Image texture analysis is carried out by GLCM tool which extracts entropy, contrast, correlation, homogeneity. By calculating GLCM statistical value, bone fracture or non-fracture can decide [11]. For non-fracture detection, texture feature which is GLCM Mean, GLCM Variance, Energy, Entropy, Homogeneity, Gabor Orientation, Markov Random Field (MRF) and Intensity Gradient Direction (IGD) can be used[10].
• Hough transform is a feature extraction technique used in image analysis, computer vision, and digital image processing. It can identified straight lines, shapes, curves in image. The conventional Hough transform was emphatic by lines identification in the image. In commonly, a straight line y = mx + b can be represented as a point (b, m) in the parameter space. For computational reasons using the Hesse normal form r = xcos
θ
+ ysinθ
, where r is the distance from the origin to the closest point on the straight line,θ
(theta) is the angle between the x-axis and the line connecting with the original with the closet point. The points in the parameter space have numbers of lines in hough space according to different angles. The linear Hough transform method applied a two dimensional array, which assign an accumulator, to identify the existence of a line [12][13][14].0 r
x y
θ
Figure 2. Hough Space for Straight Line
reliable have been proposed by researchers for capturing the corners from the image[15].
In this work, Harris algorithm is carried out to extract corner points of fracture structure in images.
D. Classification
Classification is a phase of information analysis to learn a set of data and categorize them into a number of categories. Classification takes a feature vector as an input and responds category to which the object belongs [5]. Classification can be divided into supervised classification and unsupervised classification. Image classification includes two main processing tasks: training and testing. In training task, characteristic properties of typical image features are isolated. In testing task, these feature-space partitions are used to classify image feature[16]. There are various type of classifiers for solving training and testing phases. Among them, some popular classifiers are;
• Decision tree classifier is a hierarchically based classifier which compares the data with a range of properly selected features. Each decision tree or set of rules should be designed by an expert. It is also called a binary decision tree classifier.
• ANN (Artificial Neural Network), a brain-style computational model has been used for much application. According the research needed, various ANN’ s structure can be designed. After tthe network is trained, it can be used for image classification.
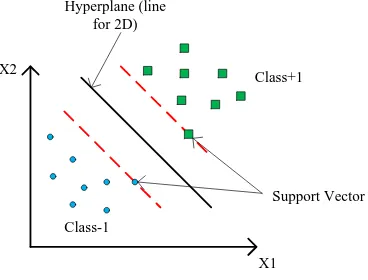
• Support Vector Machine (SVM) is popular method in pattern classification image classification. SVM builds the optimal separating hyperplanes depended on a kernel function (K). Feature vectors of images lies on one side of hyper plane. Class1 is one side of the hyper plane and other side is class2.
IMPLEMENTATION
In this paper, tibia a fracture detection system is implemented by three steps. They are preprocessing, feature extraction and classification.
Input X-ray Image
Feature Extraction Preprocessing
[image:4.595.355.487.62.316.2]Final Result Classification
Figure 3. Block Diagram of The System
A. Preprocessing
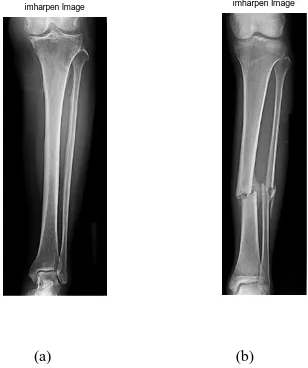
In this study, preprocessing phase is done by Unsharp Mark Filter. It is image sharpening technique. This technique uses a blurred, or "unsharp", negative image which is a mask of the original image. Unsharp mask, less blurry than the original is then combined with the positive (original) image. USM can increase either sharpness or (local) contrast because of differences values between original image and blur image. By using the mask, edge enhancement image can be created.
imharpen Image imharpen Image
[image:4.595.330.484.492.676.2](a) (b)
[image:5.595.310.530.52.261.2](c)
Figure 5. Results of Hariis Corner Detection
B. Feature Extraction
In our work, Harris algorithm is used to find the edge points as features. Harris corner detection algorithm can analyse liner edge, flat and corner belong to X-derivative and Y-derivative. It finds energy (gradient values) to get two eigenvalues which can decide edge, flat and corner. If two eigenvalues are small, the result is flat region. If two eigenvalues are large, the result is edge. If one eigenvalue is larger than other value, it is a corner. The mathematical calculation of energy equation is
E=
∑
w(x,y) [I(x+u,y+v)-I(x,y)]2 (5) E is the difference between the original and the moved window. u is the window's displacement in the x direction. v is the window's displacement in the y direction.(x, y) is the window at position (x, y) which acts like a mask. I is the intensity of the image at a position (x, y). I(x+u, y+v) is the intensity of the moved window. I(x, y) is the intensity of the original. Ix and Iy is gradient components for x-axis and y-axis. Its derivatives form is( )
[
( )
( )
]
2,
,
,
v
I
x
y
uI
vI
I
x
y
u
E
≈
∑
+
x+
y−
(6)Expand square and
I
( )
x
,
y
cancels out,( )
2 2 2 22
,
y
u
I
xuvI
xI
yv
I
yx
E
≈
∑
+
+
(7)Matrix form is
( )
u
v
[
u
v
]
E
,
≈
∑
2 2 y y x y x xI
I
I
I
I
I
v
u
(8)Rename the summed-matrix,
M=
∑
) , ()
,
(
y xy
x
w
2 2 y y x y x xI
I
I
I
I
I
(9)( )
[
]
≈
v
u
M
v
u
v
u
E
,
(10)where, M is 2x2 matrix from image derivative. Eigenvalues
(
λ
1,
λ
2)
of the matrix can help determine the suitability of a window. R, is calculated for each window.R= det M – k(trace M)2 (11) Det M=
λ
1λ
2 (12)trace M=
λ +
1λ
2 (13)The results of feature extraction are shown in figure(5).
C. Classification
In this paper, SVM classifier is conducted for classification phase. It is supervised learning models. It performs binary classification for this work. A Support Vector Machine (SVM) is a discriminative classifier formally defined by a separating hyperplane. In two dimentional space, this hyperplane is a line dividing a plane in two parts where in each class lay in either side. Firstly, support vector are calculated for setting hyperplane. Efficient feature vectors help to get good hyperplane for deciding the classification. Input image is firstly trained into a training image feature set . It built an optimal hyperplane according to the support vectors which are one side of hyperplane [17].
[image:5.595.348.532.560.700.2]X2 Support Vector Hyperplane (line for 2D) Class+1 Class-1 X1 Figure 6. Overview of SVM Classification
than zero is classified as class+1(broken bone). And then, tested images go to class -1 and class+1 according to the detected feature corner or break points.
SIMULATION RESULTS
Convert to Gray Image Acquired Image
Detect corner point(nb) by Harris
Classify using SVM Start
Check (nb)
[image:6.595.328.507.82.456.2]End
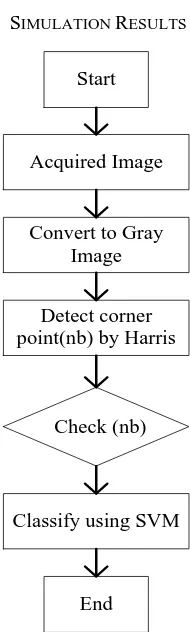
Figure 7. Flow Diagram of the System
This paper is detection of tibia bone fracture in x-ray image combining Harris and SVM. Image sharpening is very effective for noise removal and edge finding because it makes blur image with liner or non-linear filtering and subtracts it from original image to get the edge. So, in this step, edges can also find so segmentation step is not required. In feature extraction phase, Harris corner algorithm produces every edge and corner points by choosing sensitivity factor (0.2) and quality level (0.1). In bone image, if there is a fracture, there may be edge or corner. To get the useful corner, there is setting maximum 10 corner points and threshold values (0.3 and 0.8 for normalize images) to reduce upper and lower joints (knee and ankle), it is not interested portion. These detected features input to SVM. SVM trains the fracture as class+1 and non-facture as class-1. After that all, the system can detect broken bone as class+1 and normal bone as class-1 in the results.
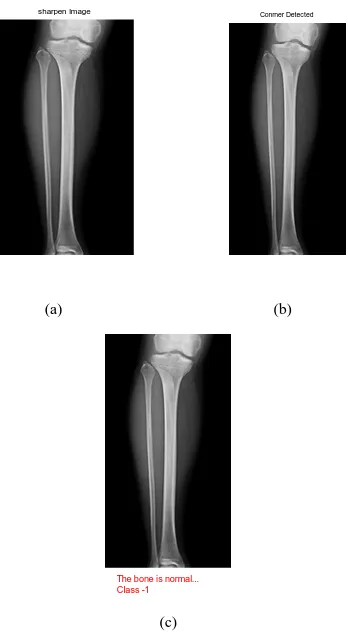
In figure (8), there is bone broken in middle region, Hariis detects eight corner points and SVM classifies as class +1 bone broken. Although there is many corner points in image, harris works in important points. Similarly, in figure (9), it is fracture bone. There is 2 corners by Harris algorithm and SVM results class+1. At least one corner is detected the system can output the fracture answer. According to figure (8) and figure (9), the algorithm knows not only worst the break but also simple of break. According to figure(10),as diaphysis(middle) region is not broken, there is no detected corner point.
Moreover, SVM produces the answer as normal belong to class-1.
sharpen Image Conrner Detected
(a) (b)
The bone is broekn Class +1
(c)
Figure 8. Result of Bone Fracture
sharpen Image Conrner Detected
(a) (b) Broken
[image:6.595.123.218.94.410.2]The bone is broekn Class +1
[image:7.595.141.203.57.228.2](c)
Figure 9. Result of Bone Fracture
sharpen Image Conrner Detected
(a) (b)
The bone is normal... Class -1
(c)
Figure 10. Result of Non-Fracture CONCLUSION
This paper presented the detection of leg bone fracture analysis in X-ray images using image processing tool. X-ray images are collected from Yangon orthopaedic hospital. In this paper, 25 x-ray images are tested. Among them, 10 images are normal image and 16 are fracture images. This system cannot correctly detect 2 fracture images. So, Harris detects fracture correctly with 92%.
In this work, time can save because segmentation step is reduced. Although some other researchers use edge detectors in segmentation stage, edge finding is done in sharpening process in preprocessing in this work In other paper, bone fracture detection is conducted by hough transform method but classification method is used for this work. So, processing time and classification accuracy is
more efficient . This system can produce the result during approximately 0.98 second. The system is designed to operate with around 200x400 image size. If the form of bone fracture is vertical line which is not corner algorithm cannot correctly answer the fracture . In future, it can focus on another portions like ulna, radius fibula and problem of type classification.
ACKNOWLEDGMENT
The author would like to thank many colleagues from the Biomedical Engineering Research Group of Department of Electronic Engineering of Yangon Technology University. The author would like to express their thanks to all persons who have given support during the preparation period of this paper.
REFERENCES
[1] S.Myint, A. S.Khaing and H.M.Tun, “Detecting Leg Bone Fracture in X-ray Images”, International Journal of Scientific & Research, vol. 5, Jun. 2016, pp. 140-144.
[2] V.D.Vegi and S.L.Patibandla, S.SKavikondala and CMAK Z. Basha, “Computerized Fracture Detection System using x-ray Images”, International Journal of Control Theory and Applications, vol. 9, Nov. 2016, pp. 615-621.
[3] S.K.Mahendran and S.Santhosh Baboo, “An Enhanced Tibia Fracture Detection Tool Using Image Processing and Classification Fusion Techniques in X-Ray Images”, Global Journal Of Computer Science and Technology, vol. 11, Aug. 2011, pp. 27-28.
[4] S.K.Mahendran and S.Santhosh Baboo, “Ensemble Systems for Automatic Fracture Detection”, International Journal of Engineering and Technology (JACSIT), vol. 4, Feb. 2012, pp.7-10. [5] M. AL-AYYOUB and D. AL-ZGHOOL, “Determining the Type of
Long Bone Fracture in X-ray Images”,WSEAS TRANSACATIONS on INFORMATION SCIENCE and APPLICATIONS, vol. 10, Aug. 2013, pp.261-270.
[6] A.T.C, Mallikarjunaswamy M.S. and Rajesh Raman , “Detection of Bone Fracture using Image Processing Methods”, International Journal of Computer Application, National Conference on Power & Industrial Automation(NCPSIA, Aug. 2015, pp. 6-9.
[7] S Jayaraman, S Esakkirajan and T Veerakumar, Digital Image Processing, 2009, pp. 243-274.
[8] CHRIS SOLOMON, TOBY BRECKON, FUNDAMENTALS OF DIGITAL IMAGE PROCESSING,2011 pp. 90-108.
[9] N.Umadevi, Dr.S.N. Geethalakshmi, “Multiple Classification System for Fracture Detection in Human Bone X-ray Images”, in Proc. Third International Conference on Computing Communication & Networking Technologies (ICCCNT), India , 2012, pp. 1-8.
[10] I.Hmneidi and M.Al-Ayyoub, “Detecting Hand Bone Fractures in X-Ray Images”, in Proc. The International Conference on Signal Processing and Imaging, Tunisia, 2013, pp. 10-14.
[11] H.Y.Chai, L.K.Wee, T.T.Swee, S.Salleh, A.K.Ariff and Kamarulafizam, “Gray-Level Co-occurrence Matrix Bone Fracture Detection”, American journal of Applied Sciences, vol. 8, Jan. 2011, pp. 26-32.
[12] M.Donnelley and F.Knowles, “Computer Aided Long Bone Fracture Detecttion”, ”, in Proc. the Eight International Symposium on Signal Processing and Its Applications, Australia, 2005, pp. 175-178.
[13] M.Donnelley, G.Knowles, “Automated Bone Fracture Detection”, in conf. Rec. 2012 IEEE Int..Conf. Signal Processing and Communication Applications Conference(SIU), pp. 955-965. [14] https://en.wikipedia.org/wiki/Hough_transform
[15] https://en.wikipedia.org/wiki/Harris_Corner_Detector
[16] S.K.Mahendranand S.S.Baboo, “Automatic Fracture Detection Using Classifier- A Review”,International Journal of Computer Science(IJCSI),vol.8, Nov. 2011, pp. 340-345.
[image:7.595.88.262.252.571.2]