Computer Assisted Instruction and Teaching of
Arithmetic
Prof. Dr. Harsha Patadia**, Ms. Pramila Ramani*
** CASE, Faculty of Education and Psychology, The M.S. University of Baroda, Vadodara, Gujarat, India * School of Science and Education, Navrachana University, Vadodara, Gujarat, India
Abstract- This True Experimental study compared academic
performance of students in class VIII in initial tryout in one of the English Medium Schools of Vadodara, India among three methods of teaching arithmetic subject viz. (i) Conventional Method (in control group –C), (ii) Computer Assisted Instruction (CAI) only (in Experimental Group A - Exp A) and (iii) Computer Assisted Instruction with simultaneous discussion (in Experimental Group B - Exp B). After experimentation in the initial tryout, CAI was modified according to the comments given by the students of the groups (Exp A and Exp B), mathematics teacher and the observations made by the investigators. The modified version of CAI used in the final tryout in another school. Methodology used in both the tryouts is as follows. The design used in this study was post-test only control group design. Three sections of class VIII students selected and groups randomly allotted. ANOVA and Tukey HSD Test used for data analyses. In both the tryouts there was significant difference in the posttest scores of students receiving conventional method, CAI only and CAI with simultaneous discussion. Further data were analysed using Tukey HSD test. In both the tryouts level of significance was at .05. In Initial Tryout findings revealed that (1) there was significant difference between mean achievement score of Exp B and Exp A (2) there was significant difference between mean achievement score of Exp B and Control Group (3) there was no significant difference between Exp A and Control Group. In final tryout findings revealed that (1) there was no significant difference between mean achievement score of Exp A and Control Group (2) there was no significant difference between mean achievement score of Exp A and Exp B. (3) There was significant difference between mean achievement score of Control Group and Exp B.
Index Terms: Computer Assisted Instruction, Self Learning
Material, Auto Instructional Method, Simultaneous Discussion and Symbolic language.
1.INTRODUCTION
ducation gives skill and competency to the individual for a successful living. It is an instrument of social change, modernization, development, economic and social development of a country. The 21st century world can be called a scientific world, advancing rapidly in information technology, medicine, engineering, space communication, astronomy, astrophysics, artificial intelligence, robotics and many other disciplines. Our country requires technically skilled manpower. For all disciplines mathematics is the base. India has a rich Mathematical heritage. An Instrument was actually used for drawing circles in the Indus
valley as early as 2500 BC. Several significant contributions to the world of mathematics have been made during the last two millennia, for example, by Aryabhata I(475 AD), Brahma Gupta(7th Century), Mahavira(850AD), Bhaskara II(1150 AD), Madhava(14th Century), Ramanujan(1887-1920). (NCERT, 1971) also emphasizes that mathematics should be visualized as the vehicle to train a child to think, reason, analyze and articulate logically, apart from being a specific subject it should be treated as concomitant to any subject involving analysis and reasoning. Yet many school students find difficulty with learning of mathematics and fail in mathematics. A major reason for the failure is that the teachers quite often pay no attention to the basic concepts and generally adopt methods of solving questions with crammed up formulae. In order to overcome the difficulties faced by the students, teacher should adopt different methodology in teaching of mathematics like drill method, using different audio visual aids, computer aided instruction, mathematical club etc. One of the methods is auto-instructional method. It is a method of individualized instruction. One of its forms is CAI (Computer Assisted/Aided Instruction) auto instructional teaching. It is very useful to the teachers and the students as it lessens the burden of teaching and learning and it makes teaching and learning interesting. It also helps the students to learn at their own pace and at their own convenience. It motivates the students and increases the enthusiasm of the students. In this method students read different frames and answer the questions that follow and by this way they learn automatically. Even the learning that takes place through CAI is accurate and untiring. The most beneficial part of CAI is it provides the mixture of wide range of visual, graphics and pictures to make the teaching learning more interesting. Investigators have developed the Computer Assisted Instruction for teaching and learning mathematics for class VIII students in arithmetic portion and tested the effectiveness of the developed CAI.
2.COMPUTER ASSISTED INSTRUCTION IN LEARNING
MATHEMATICS
ICT (Information and Communication Technology) has great potential for teaching and learning process at all levels. The use of ICT has enriched the teaching learning process with the help of computer. It has brought a great change, innovativeness, and creativity in teachers in teaching learning process. Mathematics and computer are both important in today’s life as they open the
gate of ample opportunities in this modern world. Mathematics is widely used in computers both in hardware and software. Computer helps in improving the knowledge of mathematics. It helps in making classroom teaching lively. It plays vital role in learning process as it works with the imagination of students. Any concept in mathematics can be explained with the help of pictures and this visual image can help in understanding the concept at ease. In paper pencil method student can get bored easily and can find it difficult to practice the sum again and again. CAI works as a change and increases the curiosity of students and they can learn interestingly without any difficulty. Also whatever is learnt through computer aided instructions, the contents can be retained for longer time as they use more senses of the students. (project, 2000) CAI brings with it several potential benefits as a teaching/learning medium. These include self-paced learning, self-directed learning, the exercising of various senses and the ability to represent content in a variety of media. Humans are multi-sensory animals. Certain chapters like Profit and loss, Simple and compound interest can be explained very easily using CAI. Varity of exercises can be provided and this ensures active involvement of the students. The material can be provided according to the needs of the students.
3.RATIONALE OF THE STUDY
Many studies have been conducted on low achievements in mathematics. (Jain & Burad, 1988) studied the low results in mathematics at Secondary Examination in Rajasthan and found that the cause of failure was non-availability of mathematics teachers due to late appointments and frequent teacher transfers; lack of appropriate classrooms. (Chel, 1990) found that the causes responsible for under achievements were gaps in knowledge of concepts, difficulties in understanding of mathematics language. These studies clearly show that students find difficulty in learning mathematics and there is a need to develop some self learning material to make learning easy. Many studies have been conducted to find out the effectiveness of CAI in terms of achievement of the students in learning. (Jeyamani, 1991)found that experimental group performed better on post test. The studies conducted by (Rose Antony Stella, 1992) ,(Adhikari, 1992), (Barot, 2005), (Khirwadkar, 1998), (Singh, 1992) and (Zyoud, 1999) showed that CAI was effective than conventional method. (Vansia, 2011) in his study found that mathematics learning through CAI with Peer Instruction (CAIPI) was effective on post-test. (Spradlin, Dye, & Ackerman, 2010) found that there was no statistically significant difference in the post-test scores of students receiving traditional instruction and traditional instruction supplemented with computer assisted instruction. Results of the present study may initiate changes in
teaching and learning mathematics, in the instructional modes in order to enhance mathematical achievement for all students. With information about the potential impact of computer assisted instruction, institutions can invest their resources wisely. In addition, it may lead to investigation on students’ highest achievement in the various delivery formats.
4.METHODOLOGY OF THE STUDY
4.1 The Present Study Entitles
Computer Assisted Instruction and Teaching of Arithmetic 4.2 Objectives of The Study
a. To develop the CAI in Mathematics for Standard VIII students studying in schools affiliated to GSHSEB (Gujarat State Secondary and Higher Secondary Education Board).
b. To study the effectiveness of the developed CAI in terms of students’ achievement in Mathematics with one of the Experimental Groups(Exp A) of standard VIII students.
c. To study the effectiveness of the developed CAI in terms of students’ achievement in Mathematics with another experimental group (Exp B) of standard VIII students along with treatment of simultaneous discussion.
d. To study the relative effectiveness of learning mathematics in class VIII among the three experimental groups A, B and C (Where C is the control group and A and B are experimental groups) in terms of achievement of the students.
4.3 Hypotheses of The Study
• There is no significant difference between Experimental group A (Exp A) and Control Group (C) towards effectiveness of the developed CAI.
• There is no significant difference between Experimental group B (Exp B) and Control Group (C) towards effectiveness of the developed CAI.
• There is no significant difference between Experimental group A(Exp A) and Experimental group B(Exp B) towards effectiveness of the developed CAI.
4.4 Explanation of The Terms
CAI with Discussion: In the context of the present study CAI with discussion means the learners learned arithmetic unit with the help of CAI along with the simultaneous discussion led by the investigators with students where ever and whenever needed. 4.5 Operationalization of Terms
• CAI: For the purpose of this study CAI means Computer Assisted Instruction, which is a self-learning material developed by the investigators after observation of mathematics classroom to understand the student’s ability, potential, grasping power and other learning behaviour.
• Achievement in Mathematics: The mark scored by each student in the test constructed by the investigators on the arithmetic unit was the achievement of that student.
4.6 Delimitation of The Study
The present study was delimited to standard VIII English Medium GSHSEB students and only arithmetic unit of the mathematics textbook in the year 2010 was covered during experimentation of the present study.
4.7 Design of The Study
The present study was true experimental in nature. True experimental design was followed in this present study. The design was post-test-only control group design.
4.8 Population of The Study
There are 61 grant-in-aid schools in the city of Vadodara, functioning under the Gujarat State Board of secondary and Higher Secondary Education (GSHSEB) following the rules and regulations laid by the Ministry of Human Resources of the Government of India. The population of the study consists of all the Standard VIII English medium students of GSHSEB of Vadodara city in the year 2010.
4.9 Sample and Procedure of The Study
Initial Try out
For initial try out Standard VIII students of three sections of one of the English Medium schools of Vadodara were taken for the present study. These selected sections (A, B, C) were assigned randomly as Exp A, Exp B and control group (C). For ANOVA calculation, groups were matched on the basis of comparable mean and standard deviation based on their VII standard mathematics marks. All students in three sections participated in the study but only matched group students were considered for the calculation purpose. Students of section C (13 students) were selected as control group who were taught by conventional method. Students of Section B (13 students) were selected as Experimental Group A who were taught by using CAI only. Students of section A were selected as Experimental Group B (13 students) who were taught by using CAI with simultaneous discussion. Each group was taught for one period daily over a period of one month. After completion of teaching the arithmetic content viz. profit and loss, simple interest and compound interest topics, students were tested through scholastic achievement test prepared by the investigators and validated by the experts on the basis of content analysis.
CAI was further modified according to the suggestions given by the students, mathematics teacher and observation by the investigators. Modified CAI was used for final tryout.
Final Try out
For final try out Standard VIII students of three sections of one of the English medium schools of Vadodara were taken for the present study. These selected sections (A, B, C) were assigned randomly as Exp A, Exp B and control group (C). For ANOVA calculation, groups were matched on the basis of comparable mean and standard deviation based on their mathematics achievement test prepared by the investigators. All students in the three sections participated in the study but matched group students were considered for the calculation purpose. Students of section B (20 students) were selected as control group (C) who were taught by conventional method. Students of section A (20 students) were selected as Experimental Group A who were taught by CAI only. Students
of section C (20 students) were selected as Experimental Group B who were taught by CAI with simultaneous discussion. Each group was taught for one period daily over a period of one month. After completion of teaching the arithmetic content viz. profit and loss, simple interest and compound interest topics, students were tested through scholastic achievement test prepared by the investigators and validated by the experts on the basis of content analysis.
4.10 Tools for Data Collection
The investigators prepared Scholastic Achievement test based on content analysis serving the purpose of posttest. The experts validated the test.
4.11 Plan and Procedure Of Data Collection
Step 1: One of the English medium school of Vadodara, India following GSHSEB syllabus class VIII students were selected purposively having the required facility to conduct the experiment.
Step 2: Students were divided randomly into three groups control group taught by usual conventional method, Experimental Group A (only CAI) and Experimental Group B ( CAI with simultaneous discussion).
Step 3: Students were taught in their respective methods for a month for the completion of the selected arithmetic unit.
Step 4: Test was administered to the students and their marks were collected and analysed.
Step 5: CAI was modified according to the suggestion of the students, mathematics teacher and the observation made by the investigators. The modified CAI was used for final tryout. Step 6: Steps 1 to 4 is followed as above.
5.LIMITATIONS OF THE PRESENT STUDY
The present study was limited to arithmetic unit of Class VIII GSHSEB text book and therefore whole content of mathematics textbook was not covered. The duration of the study was one month for each tryout. Data was analysed using quantitative methods only.
6.DATA ANALYSIS
Collected data were analyzed through appropriate statistical techniques. To study the effectiveness of the developed CAI, ANOVA was computed.
[image:3.612.310.572.636.734.2]6.1 Initial Tryout
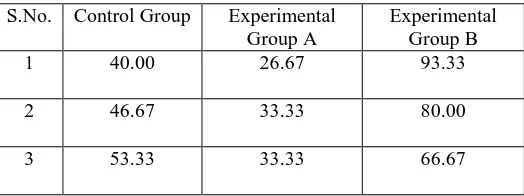
Table 1: Data for One-Way ANOVA for 3 Samples –Post test scores (Marks out of 100)
S.No. Control Group Experimental Group A
S.No. Control Group Experimental Group A
[image:4.612.27.556.43.743.2]Experimental Group B 4 53.33 40.00 73.33 5 60.00 40.00 93.33 6 40.00 40.00 73.33 7 60.00 20.00 60.00 8 33.33 46.67 73.33 9 60.00 20.00 60.00 10 33.33 40.00 46.67 11 40.00 40.00 46.67 12 53.33 46.67 60.00 13 26.67 46.67 80.00
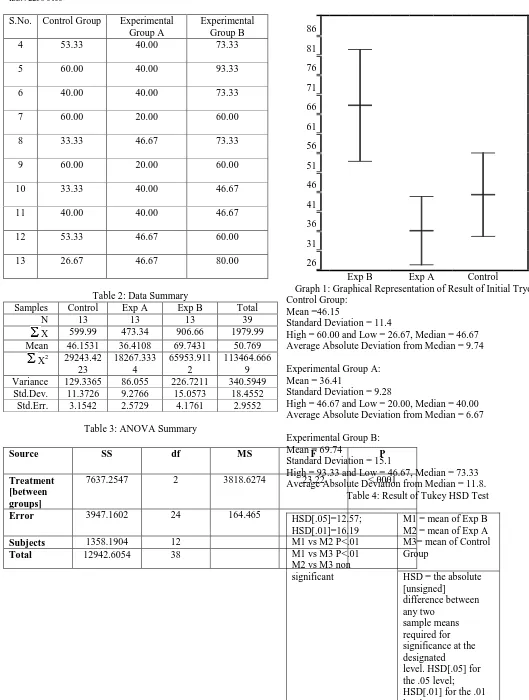
Table 2: Data Summary
Samples Control Exp A Exp B Total N 13 13 13 39 X 599.99 473.34 906.66 1979.99 Mean 46.1531 36.4108 69.7431 50.769
X2 29243.42 23
18267.333 4
65953.911 2
113464.666 9 Variance 129.3365 86.055 226.7211 340.5949 Std.Dev. 11.3726 9.2766 15.0573 18.4552
Std.Err. 3.1542 2.5729 4.1761 2.9552 Table 3: ANOVA Summary
Source SS df MS F P
Treatment [between groups]
7637.2547 2 3818.6274 23.22 <.0001
Error 3947.1602 24 164.465
Subjects 1358.1904 12
Total 12942.6054 38
86
81
76 71 66 61 56 51 46 41 36 31 26
Exp B Exp A Control Graph 1: Graphical Representation of Result of Initial Tryout Control Group:
Mean =46.15
Standard Deviation = 11.4
High = 60.00 and Low = 26.67, Median = 46.67 Average Absolute Deviation from Median = 9.74 Experimental Group A:
Mean = 36.41
Standard Deviation = 9.28
High = 46.67 and Low = 20.00, Median = 40.00 Average Absolute Deviation from Median = 6.67 Experimental Group B:
Mean = 69.74
Standard Deviation = 15.1
High = 93.33 and Low = 46.67, Median = 73.33 Average Absolute Deviation from Median = 11.8.
Table 4: Result of Tukey HSD Test HSD[.05]=12.57;
HSD[.01]=16.19 M1 vs M2 P<.01 M1 vs M3 P<.01 M2 vs M3 non significant
M1 = mean of Exp B M2 = mean of Exp A M3= mean of Control Group
[image:4.612.321.559.53.326.2]HSD = the absolute [unsigned]
difference between any two
sample means required for significance at the designated
6.2 Final Tryout
Table 5: Data for One-Way ANOVA for 3 Samples- Post Test Scores (Marks out of 100)
S.No. Control Group
Experimental Group A
Experimental Group B
1 35 40 40
2 86.67 45 53.33 3 66.67 73.33 86.67 4 93.33 80 80 5 66.67 93.33 93.33 6 35 86.67 100 7 45 86.67 100 8 40 86.67 100 9 80 93.33 100 10 33.33 86.67 100 11 86.67 80 100 12 93.33 86.67 86.67 13 45 86.67 100 14 80 50 40 15 86.67 80 73.33 16 93.33 73.33 100 17 40 50 80 18 80 66.67 86.67 19 93.33 66.67 93.33 20 86.67 86.67 100
Table 2: Data Summary Sample
s
Control Exp A Exp B Total N 20 20 20 60
X 1366.67 1498.35 1713.33 4578.35 Mean 68.3335 74.9175 85.6665 76.3058
X2 103789.37 79
117472.15 57
154177.42 23
375438.95 59 Varian 547.3702 274.7116 389.602 442.1041
Sample s
Control Exp A Exp B Total ce
Std.De v.
[image:5.612.319.569.165.603.2]23.3959 16.5744 19.7383 21.0263 Std.Err. 5.2315 3.7062 4.4136 2.7145
Table 3: ANOVA Summary
Source SS df MS F P
Treatment [between
groups]
3062.153 2 1531.0765 4.73 0.014644
Error 12303.0214 38 323.7637
Subjects 10718.9695 19 Total 26084.1439 59
Graph 1: Graphical Representation of Result of Final Tryout
Control Group:
Mean = 68.33
Standard Deviation = 23.4
High = 93.33 and Low =33.33, Median = 80.00 Average Absolute Deviation from Median = 19.7
Experimental Group A:
Mean = 74.92
Standard Deviation = 16.6
High =93.33 and Low = 40.00, Median = 80.00 109
103
97 91 85 79 73 67 61 55 49 43
Average Absolute Deviation from Median = 12.4
Experimental Group B:
Mean =85.67
Standard Deviation = 19.7
High = 100 and Low =40.00, Median = 93.33 Average Absolute Deviation from Median = 13.7
Table 4: Result of Tukey HSD Test HSD[.05]=13.88;
HSD[.01]=17.65
M1 vs M2 non significant M1 vs M3 non significant M2 vs M3 P<.05
M1 = mean of Exp A M2 = mean of Control Group M3= Mean of Exp B
HSD = the absolute [unsigned]
difference between any two sample means required for significance at the designated level. HSD[.05] for the .05 level;
HSD[.01] for the .01 level. 7.FINDINGS OF THE STUDY
Following are the major findings obtained from the data analysis of Post test.
7.1 Initial Tryout
Initial try out using inferential statistics ANOVA at .05 level of significance it was found that there was significant difference between the mean achievement score of Experimental Group A, Experimental Group B and the Control Group (C) . Further using Tukey HSD Test it was found that
i .
There was no significant difference between the mean achievement score of Experimental Group A (only CAI) and the Control Group (C) (Conventional Method).ii. There was significant difference between the mean achievement score of Experimental Group B (CAI with simultaneous discussion) and the Control Group (C) (Conventional Method)
iii. There was significant difference between the mean achievement score of Experimental Group A (only CAI) and the Experimental Group B (CAI with simultaneous discussion) 7.2 Final Tryout
Final try out using inferential statistics ANOVA at .05 level of significance it was found that there was significant difference
between the mean achievement score of Experimental Group A, Experimental Group B and the Control Group. Further using Tukey HSD Test it was found that
i. There was no significant difference between the mean achievement score of Experimental Group A (only CAI) and the Control Group (C) (Conventional Method).
ii. There was significant difference between the mean achievement score of Experimental Group B (CAI with simultaneous discussion) and the Control Group (C) (Conventional Method)
iii. There was no significant difference between the mean achievement score of Experimental Group A (only CAI) and the Experimental Group B (CAI with simultaneous discussion)
8. DISCUSSION
had separate computers throughout the session. Moreover, in initial tryout students needed investigators help most of the time because of the problems they faced using the computers. Whereas, in the final tryout students didn’t face any such problems using the computer and they were able to operate by themselves. Experimental Group B students asked doubt whenever they faced problems in understanding the concept. So, it can be concluded that students learn better in CAI with simultaneous discussion than with CAI only (in similar condition of schools like initial tryout).Students learn equally well using CAI with or without the presence of teacher (in similar condition of schools like final tryout). Hence it follows that computers have the potential to be useful tools to improve learning. Educators can tap into this interest by using CAI to deliver instruction and assess learning in arithmetic. Technological advances have made computers more powerful and less expensive, which has resulted in more students having access to computers. Computer learning systems provide educators the opportunity to present topics in a variety of alternative forms as compared to the conventional method in order to address the different learning styles and preferences of students. Educators using the conventional method of teaching may consider supplementing their method of teaching with the help of CAI so as to enhance students learning and motivation.
9.EDUCATIONAL IMPLICATION OF THE PRESENT STUDY
Students enjoyed learning arithmetic through CAI and it helped students as a supplementary material. Self learning material should be developed in mathematics where ever possible for all classes and should be used along with the conventional method to make learning an enjoyable and pleasant experience.
10.CONCLUSIONS
(Brown, 2003) (Kinney & Robertson, 2003) concluded that CAI offers students an opportunity to be actively engaged in the learning process, to receive instruction through a variety of multimedia, to choose the place and time to learn, to work at their own pace, and to receive immediate and accurate feedback. (Ramani & Patadia, 2012) in their study titled Comparative Analysis of Reaction of Students on Final Version of Computer Assisted Instruction for Teaching Arithmetic with Different
Modes, (Ramani & Patadia, 2012) in their study titled the effectiveness of Computer Assisted Instruction in Teaching Arithmetics and (Ramani & Patadia, 2013) in their study titled Reaction of Students on Developed Computer Assisted Instruction For Teaching Arithmetic have studied the effectiveness of using CAI in teaching and learning mathematics and found that CAI is one of the effective methods to teach and learn mathematics. In the present study from the findings and from observations of the investigators it was found that students enjoyed learning mathematics through CAI. So it can be concluded that CAI is one of the effective ways to teach and learn mathematics with arousing interest among students.
ACKNOWLEDGMENT
We are thankful to the authorities of the schools who gave permission to conduct our experiment. We sincerely show our gratitude to all the students of the selected schools who cooperated with us to complete our experiment successfully. We also thank our experts who gave valid suggestions for our tool.
REFERENCES
[1] Adhikari, R. (1992). Development of Computer Aided Instruction Material on cell and cell reproduction for class IX. In D. R. Goel(2000), Educational Media in India. New Delhi: Bharatiya Kala Prakashan, India.
[2] Barot, H. (2005). To study the effectiveness of CAI in Sanskrit for std. VIII students. Vadodara: CASE.The Maharaja Sayajirao University of Baroda, India: An Unpublished M.Ed. Dissertation.
[3] Brown, K. L. (2003). From teacher-centered to learner-centered curriculum : Improving learning in diverse classrooms. Education , 124(1), 49-54.
[4] Chel, M. (1990). Diagnosis and remediation of under achievement in compulsary Maths of Madynamic examination in West Bengal. In NCERT(1992), Fifth Survey of Research in Education. New Delhi: NCERT, India.
[5] Jain, S., & Burad, G. (1988). Low Results in Mathematics at Secondary Examination in Rajasthan. Independent Study . Udaipur, India: State Institute of Educational Research and training.
[6] Jeyamani, P. (1991). Effectiveness of simulation modes of teaching through CAI. In NCERT(1992), Fifth Survey of Research in Education. New Delhi: NCERT, India.
[7] Khirwadkar, A. (1998). Development of Computer software for learning chemistry at standard XI. Vadodara: CASE, The M.S.University of Baroda, India: An unpublished Ph.D, Thesis. [8] Kinney, D., & Robertson, D. E. (2003). Technology makes possible
new models for delivering developmental mathematics instruction.
[9] Kirkman, T. (1996). ANOVA Analysis of Variance between groups.
Retrieved 10 9, 2012, from Statistics in Use: http://www.physics.csbsju.edu/stats
[10] NCERT. (1971). Education and National Development. Report of the Education Commision 1964-66. New Delhi: NCERT.
[11] project. (2000, October 29). Computer Assisted Language Learning. Retrieved 7 21, 2012, from Chapter 2: Computer Assisted Instruction
and Learning:
http://www.computing.dcu.ie/~mward/mthesis/chapter2.pdf
[12] Ramani, P., & Patadia, H. (2012). Comparative Analysis of Reaction of Students on Final Version of Computer Assisted Instruction for Teaching Arithmetic with Different Modes. IOSR Journal of Humanities and Social Science (JHSS) , 5(3), 52-91.
[13] Ramani, P., & Patadia, H. (2013). Reaction of Students on Developed Computer Assisted Instruction For Teaching Arithmetic. Scientific and Academic Publication , Vol.3, No.1.
[14] Ramani, P., & Patadia, H. (2012). The effectiveness of Computer Assisted Instruction in Teaching Arithmetics. International Journal of Scientific and Research Publications , 2(11), 52-91.
[15] Rose Antony Stella, V. (1992). Effectiveness of Computer Assisted Instruction with Special reference to underachievers. In NCERT(1992)., Fifth Survey of Research in Education. New Delhi: NCERT, India.
[16] Singh, R. (1992). To Study the Effectiveness of Teaching Mathematics through Computer Assisted Instruction and Conventional Method of Cognitive and Non Cognitive Variables. In NCERT.(1992), Fifth Survey of Research in Education. New Delhi: NCERT, India.
[17] Spradlin, Dye, K., & Ackerman, B. (2010). The Effectiveness of Computer- Assisted Instruction in Developmental Mathematics.
Retrieved 11 10, 2012, from Faculty Publications and Presentations. Paper 195.: http://digitalcommons.liberty.edu/educ_fac_pubs/195 [18] Vansia. (2011). Effectiveness of Computer with Peer Interaction for
Math's learning in urban area. Retrieved 7 13, 2012, from International Referred Research Journal, September, 2011, ISSN- 097-3486:Rajbil 2001/30097, Vol-II Issue 24: http://www.ssmrae.com/admin/images/f76c407be2bb7e5c6eef3071f8c 9abd5.pdf
[19] Zyoud, M. (1999). Development of Computer Assisted English Language Teaching of VIII Standard Students. Vadodara: CASE. The Maharaja Sayajirao University of Baroda, India: An unpublished Ph.D. Thesis.
AUTHORS
First Author – Prof. Dr. Harsha Patadia, PhD Education, MS
University of Baroda and harshapatadia@gmail.com, harshacase@yahoo.co.uk.
Second Author – Ms. Pramila Ramani, Submitted Thesis in
Education, M.Sc., M.Ed , Special Diploma in Advanced Computer Applications’, UGC NET Education, Navrachana University, Bhaily, Vasna, Vadodara, India. and
pramila.maths@gmail.com.
Correspondence Author – Ms. Pramila Ramani,