0095-1137/11/$12.00 doi:10.1128/JCM.05213-11
Copyright © 2011, American Society for Microbiology. All Rights Reserved.
tuf
Gene Sequence Analysis Has Greater Discriminatory Power
than 16S rRNA Sequence Analysis in Identification of Clinical
Isolates of Coagulase-Negative Staphylococci
䌤
Sang Mee Hwang,
1Myoung Shin Kim,
2Kyoung Un Park,
1,2*
Junghan Song,
1,2and Eui-Chong Kim
1Department of Laboratory Medicine, Seoul National University College of Medicine, Seoul,1and Department of Laboratory Medicine, Seoul National University Bundang Hospital, Seongnam,2South Korea
Received 22 July 2011/Returned for modification 21 August 2011/Accepted 3 October 2011
We compared and analyzed 16S rRNA andtufgene sequences for 97 clinical isolates of coagulase-negative staphylococci (CNS) by use of the GenBank, MicroSeq, EzTaxon, and BIBI databases. Discordant results for definitive identification were observed and differed according to the different databases and target genes. Although higher percentages of sequence identity were obtained with GenBank and MicroSeq for 16S rRNA analysis, the BIBI and EzTaxon databases produced less ambiguous results. Greater discriminatory power and fewer multiple probable identifications were observed withtufgene analysis than with 16S rRNA analysis. The most pertinent results fortufgene analysis were obtained with the GenBank database when the cutoff values for the percentage of identity were adjusted to be greater than or equal to 98.0%, with >0.8% separation between species. Analysis of thetufgene proved to be more discriminative for certain CNS species; further, this method exhibited better distinction in the identification of CNS clinical isolates.
Coagulase-negative staphylococci (CNS) are normal inhab-itants of human skin and mucous membranes and have been regarded previously as culture contaminants (31). However, CNS have emerged as significant pathogens (26), especially in immunocompromised patients (3), in premature neonates in intensive-care units (8, 16), and in patients who have under-gone complex medical procedures involving the implantation of prosthetic or cardiac devices or indwelling catheters (25, 26).
One of the frequently isolated CNS species, Staphylococcus
epidermidis, is the most commonly isolated etiological agent of nosocomial infections (21).
Because of the increase in the clinical significance of CNS, there is a need for a more accurate and sensitive method to identify CNS species in clinical samples. Many automated identification systems are commercially available, such as the
Vitek 2 (bioMe´rieux, Marcy l’Etoile, France), BD Phoenix
(Becton Dickinson Diagnostic Systems, Sparks, MD), and MicroScan (Dade Behring, West Sacramento, CA) systems. These systems allow for more rapid and more accurate iden-tification than does manual morphological ideniden-tification or biochemical tests. However, the accuracy of these tests can be compromised because of the variable expression of phenotypic characteristics and the limited nature of the databases; these limitations can result in ambiguous findings and the inability to identify uncommon isolates (4, 15, 17). In addition, identifica-tion of CNS to the species level may change the diagnosis and therapeutic plans, since uncommon isolates are being consid-ered as causative agents, and unusual antibacterial resistance
patterns appear (1, 13). Therefore, genotypic methods of iden-tifying CNS species are emerging as diagnostic tools for CNS infections.
Sequence analysis of the 16S rRNA, a highly conserved region present in all bacteria, has been implemented in clinical laboratories to identify CNS species (10, 22). Although this method is widely used and accurate, the high degree of simi-larity between closely related species limits its usefulness for identifying several CNS species (27). Alternative target genes,
such asrpoB,tuf,dnaJ, andsodA, are being assessed for their
abilities to distinguish between highly similar species (12, 14,
15, 24, 27, 28). The tuf gene, which encodes the elongation
factor Tu, is an essential constituent of the bacterial genome and is involved in peptide chain formation. Due to its essential
nature, it is preferred for diagnostic purposes (19). tuf gene
analysis has been shown to be a reliable and reproducible method of identifying CNS; further, it has exhibited better resolution for distinguishing between certain CNS species than 16S rRNA analysis (15, 22).
In addition to the selection of a target gene for bacterial species identification, interpretation of the sequence analysis results utilizing different databases is also important. However, the postsequencing process of interpreting genotypic results has not been emphasized in many studies (4, 22). Bioinfor-matic tools for bacterial identification are continually being developed and renovated to meet the needs for processing ever-increasing amounts of data. Currently, multiple databases or tools exist for bacterial identification. The most commonly used open database worldwide is GenBank (5), which incor-porates DNA sequences from all available public sources, making it comprehensive and easily accessible, and its se-quences are considered the primary data for other databases. Other databases incorporate other information along with that from GenBank and can be regarded as secondary databases. * Corresponding author. Mailing address: Department of
Labora-tory Medicine, Seoul National University Bundang Hospital, 166 Gu-miro, Bundanggu, Seongnamsi, Gyeonggido 463-707, South Korea. Phone: 82-31-787-7692. Fax: 82-31-787-4015. E-mail: m91w95pf@snu .ac.kr.
䌤Published ahead of print on 12 October 2011.
4142
on May 16, 2020 by guest
http://jcm.asm.org/
One of the secondary databases, BIBI, combines the two well-known tools of BLAST (30) and CLUSTALW (18) and utilizes phylogenetic data that are important for bacterial identifica-tion (11). EzTaxon, another Web-based tool, contains 16S rRNA sequences for prokaryotic type strains; it is constructed to enable the identification of isolates on the basis of pairwise nucleotide similarity values and phylogenetic inference meth-ods (9). Additionally, MicroSeq 500 (Applied Biosystems Inc., Foster City, CA) is a commercially available software program for 16S rRNA sequence analysis (32).
We compared the genotypic results from 16S rRNA se-quencing analyzed with GenBank, MicroSeq, EzTaxon, and BIBI for clinical isolates identified as CNS by phenotypic sys-tems (Vitek 2, MicroScan); further, the genotypic results from
tuf gene analyses using GenBank and BIBI were also
com-pared. Few articles exist regarding guidelines for the interpre-tation of DNA target sequences for bacterial identification. This is problematic, because the results given by databases are often inconclusive. The finding of multiple probable results or a rare species may not have been reviewed by others, because many databases are open to the public and are not validated thoroughly. The Clinical and Laboratory Standards Institute (CLSI) molecular method 18-A (MM18-A) is so far the most commonly referenced material for bacterial DNA identifica-tion (22). CLSI MM18-A focuses on the interpretaidentifica-tion of bac-terial 16S rRNA sequence data, including data for staphylo-cocci, related Gram-positive staphylo-cocci, and fungi. However, few
guidelines exist for other DNA targets, such as thetufgene, for
bacterial identification. Therefore, we evaluated the
appropri-ateness of the CLSI guidelines fortufgene analysis and aimed
to determine the optimal criteria for CNS species identification
bytufgene analysis. Moreover, we compared the results of 16S
rRNA and tuf gene analyses using different databases and
assessed whether tuf gene analysis can be used reliably in
clinical laboratories to identify CNS species.
MATERIALS AND METHODS
Bacterial isolates.A total of 97 clinical isolates that were identified as CNS by either one of the two phenotypic systems used were included in this study. The phenotypic systems used were the MicroScan Pos Combo panel type 1A (Dade Behring, West Sacramento, CA) and Vitek 2 Gram-positive (GP) identification
(ID) cards (bioMe´rieux, Marcy l’Etoile, France). The identification procedures
were performed according to the manufacturers’ recommendations. Identifica-tions with less than a 90% identity score by phenotypic systems were considered insufficient for a result, but those isolates were included for the analysis. To exclude blood culture contaminants, only blood culture isolates that grew in at least two of three blood cultures were included. For additional or repeated tests,
the isolates were suspended in skim milk and were stored at⫺70°C.
Extraction of genomic DNA.After overnight growth on blood agar plates at 37°C, genomic DNA was extracted from pure cultures by a Chelex matrix (Bio-Rad Laboratories, Hercules, CA) according to the manufacturer’s instructions.
16S rRNA andtufgene sequencing.PCR amplifications were conducted in a
total volume of 25 l containing 2.5 mM deoxynucleoside triphosphates
(dNTPs), 10 pmol of each PCR primer, 0.6 UTaqpolymerase, 2.5l of 10⫻
PCR buffer with 15 mM MgCl2(Takara Bio, Inc., Shiga, Japan), and 2.5l of the
template. In-house primers were designed using LightCycler Probe Design soft-ware (version 2.0) (Roche, Penzberg, Germany); published studies were used as
a reference (7, 10, 15). 16S rRNA was amplified with primers MSQ-F (5⬘-TGA
AGAGTTTGATCATGGCTCAG-3⬘) and MSQ-R (5⬘-ACCGCGGCTGCTGG
CAC-3⬘), and thetufgene was amplified with primers TUF-F (5⬘-GCCAGTTG
AGGACGTATTCT-3⬘) and TUF-R (5⬘
-CCATTTCAGTACCTTCTGGTAA-3⬘). The PCR conditions for 16S rRNA were as follows: an initial denaturation
period of 10 min at 95°C, followed by 35 cycles of 30 s of annealing at 60°C and 45 s of elongation at 72°C, with a final 10-min extension at 72°C. The PCR
conditions fortufwere as follows: 15 min of initial denaturation at 95°C, followed
by 35 cycles of 30 s at 95°C, 30 s at 56°C, and 45 s at 72°C, with a final 10-min extension at 72°C. Gel electrophoresis was used to detect positive PCR signals
and to confirm amplicon lengths of 527 bp for 16S rRNA and 412 bp for thetuf
gene. Prior to sequencing, the PCR products were purified using the ExoSAP-IT reagent (USB Corporation, Cleveland, OH) according to the manufacturer’s instructions. Forward and reverse sequencing reactions were conducted for each of the amplified products. The sequencing reaction mixture for 16S rRNA
con-sisted of 10l of MicroSeq 500 sequencing mix (containing 1.6 pmol of MSQ-F
or MSQ-R) primers, 2.9l of molecular-grade water, and 1l of the purified
PCR product. For thetufgene, sequencing reactions were performed using
BigDye Terminator, version 3.1, reagents (Applied Biosystems Inc., Foster City,
CA). Briefly, the sequencing reaction mixture consisted of 1l of BigDye Ready
Reaction mix, 3.5l of BigDye sequencing buffer (5⫻) (Applied Biosystems
Inc.), 1.6l of a 1-pmol primer, 2.9l of molecular-grade water, and 1l of the
purified PCR product; the final reaction volume was 10l. The thermal cycling
conditions were as follows: 25 cycles of 10 s at 96°C, 5 s at 50°C, and 4 min at 60°C. The sequencing products were purified using ethanol–sodium acetate. Sequencing reactions were performed on an ABI Prism 3130xl genetic analyzer (Applied Biosystems Inc.) according to the standard automated sequencer pro-tocols.
Sequence analysis.GenBank, MicroSeq 500, version 2.0, EzTaxon (http: //www.eztaxon.org) (9), and BIBI (http://umr5558-sud-str1.univ-lyon1.fr/lebibi /lebibiexecX.cgi) (11) were accessed most recently on January 2011 for analysis. In compliance with the CLSI guidelines for the interpretation of 16S rRNA
sequence analysis with GenBank and MicroSeq, a query sequence withⱖ99.0%
identity for species identification and⬎0.8% separation between different
spe-cies was considered acceptable. In cases where multiple spespe-cies with⬍0.8%
separation and withⱖ99.0% identity were identified, all of the IDs were
con-sidered probable IDs. Because BIBI does not report results with identity scores, the ID with the greatest number of sequences labeled “ID in cluster” in response to the query sequence was considered the most probable ID; the ID with the greatest number of sequences labeled “type strain in clusters” was considered the next most probable ID, followed by the ID with the greatest number of sequences labeled “type strain outside clusters.”
Fortufgene analysis, GenBank and BIBI were used. Because no interpretative
criteria exist for species identification usingtufgene analysis with GenBank, we
evaluated the results with the current CLSI guidelines for 16S rRNA
interpre-tation and arbitrarily setⱖ98.0% identity with⬎0.8% separation as the rule for
acceptable ID results for reporting at the species level. The same rule that was
applied for 16S rRNA analysis with BIBI was used fortufgene analysis with
BIBI.
The “definitive ID” was defined as the ID most frequently obtained by the eight different methods (two phenotypic and six genotypic methods); a minimum of four results in concordance were required for a definitive ID.
Statistical analysis.One-way analysis of variance (ANOVA) was used for comparisons of differences in percentages of identity between the first and second probable IDs by different methods. Kappa correlation statistics for the concordance of the results from different methods were analyzed. IBM SPSS Statistics, version 19 (SPSS Inc., Chicago, IL), was used for statistical evaluation.
AllPvalues are two sided, and aPvalue of⬍0.05 was considered statistically
significant.
RESULTS
Identification of coagulase-negative staphylococci. The identification results for the 97 clinical isolates obtained using
four databases for 16S rRNA sequencing, two databases fortuf
gene sequencing, and two automated phenotypic identification systems are shown in Tables 1 to 4. In general, at least five different methods were in agreement for species identification. In the sole exceptional case, only four of the identification
results were in concordance; this isolate was verified as
Staph-ylococcus pettenkoferi(29), which was regarded as the definitive
ID. In summary, the clinical specimens were identified asS.
epidermidis(n⫽37),Staphylococcus hominis(n⫽22), Staph-ylococcus capitis(n⫽10),Staphylococcus haemolyticus(n⫽7), Staphylococcus lugdunensis(n⫽6),Staphylococcus caprae(n⫽ 5),Staphylococcus cohnii(n⫽3),Staphylococcus warneri(n⫽
on May 16, 2020 by guest
http://jcm.asm.org/
3),Staphylococcus simulans(n⫽2),Staphylococcus
saprophyti-cus(n⫽1), andS. pettenkoferi(n⫽1). For 16S rRNA analysis,
identifications that were discordant with the definitive ID oc-curred at a frequency of 2.1% for GenBank, 1.0% for Micro-Seq, 10.3% for EzTaxon, and 15.5% for BIBI. On the other
hand,tuf gene analysis with GenBank showed 2.1%
discrep-ancy;tufgene analysis with BIBI did not yield any discrepant
results. The phenotypic ID systems Vitek 2 and MicroScan showed 8.8% and 19.5% discrepancy with the definitive ID, respectively. The discordant results by different methods are listed in Table 5.
Briefly, by 16S rRNA analysis with GenBank, twoS. caprae
isolates were misidentified; with MicroSeq, oneS. pettenkoferi
isolate was misidentified. By use of EzTaxon for 16S rRNA
analysis, 10S. capitis isolates were identified asS. caprae; by
use of BIBI, 1S. epidermidis, 1S. haemolyticus, 2S. capitis, and
11S. hominisisolates were misidentified. When GenBank was
used fortufgene analysis, oneS. epidermidisand oneS.
petten-koferiisolate showed mismatches with the definitive ID; with BIBI, no discrepant results were observed.
Because multiple species were considered probable IDs
when there was⬍0.8% identity difference between the IDs, we
evaluated the species that were considered probable IDs (Ta-ble 5). 16S rRNA analysis with GenBank yielded multiple answers for 40.2% of the specimens, showing low
discrimina-tory power between S. capitis, S. caprae, and S. epidermidis;
betweenS. hominis,S. warneri,S. hyicus, andS. haemolyticus;
and betweenS. warneriandS. hyicus.16S rRNA analysis with
MicroSeq provided multiple IDs for 15.5% of the specimens
and was unable to differentiate betweenS. capitis, S. caprae,
andS. epidermidisand betweenS. saprophyticusandS. xylosus. 16S rRNA analysis with EzTaxon showed ambiguous results
for 7.2% of the specimens; further, all fiveS. capraeisolates
were given multiple IDs, includingS. caprae,S. capitis,S.
sac-charolyticus, and S. epidermidis. S. hominiswas identified as
eitherS. hominisorS. haemolyticus, andS. saprophyticuswas
identified as eitherS. saprophyticusorS. xylosus, by 16S rRNA
analysis with EzTaxon. 16S rRNA analysis with BIBI revealed multiple probable IDS for 15.5% of the clinical isolates. The
results were inconclusive, withS. capitisidentified asS. capitis
orS. capraeandS. pettenkoferi identified asS. pettenkoferior Staphylococcus pseudolugdunensis. The numbers of sequences labeled “type strain within clusters” and “type strain outside of clusters” were the same for the two species by BIBI. In
con-trast,tuf gene analysis with GenBank was not able to
differ-entiate betweenS. warneriandS. pasteuri. No ambiguous
re-sults were obtained by use oftufgene analysis with BIBI.
The correlation of each method with the definitive ID was evaluated by multirater kappa statistics, and the kappa coeffi-cient was 0.9735 for 16S rRNA analysis by GenBank, 0.9868 for 16S rRNA analysis by MicroSeq, 0.8684 for 16S rRNA analysis by EzTaxon, 0.8081 for 16S rRNA analysis by BIBI,
0.9736 for tuf analysis by GenBank, 1.00 for tuf analysis by
BIBI, 0.8560 for the Vitek 2 system, and 0.7613 for the
MicroScan system. The kappa coefficient withtufanalysis was
higher than those for 16S rRNA analysis and automated iden-tification systems.
Discriminatory power. The genotypic results generated by
16S rRNA analysis with MicroSeq and EzTaxon and by tuf
gene analysis with GenBank expressed identification scores as
TABLE
1.
Identification
of
37
Staphylococcus
epidermidis
clinical
isolates
by
genotypic
a
and
phenotypic
methods
16S
rRNA
analysis
(GenBank)
16S
rRNA
analysis
(MicroSeq)
16S
rRNA
analysis
(EzTaxon)
16S
rRNA
analysis
(BIBI)
tuf
gene
analysis
(GenBank)
tuf
gene
analysis
(BIBI)
Vitek
2
MicroScan
Definitive
ID
No.
of
isolates
S.
epidermidis
S.
epidermidis
S.
epidermidis
S.
epidermidis
S.
epidermidis
(100.0
关
12
兴
,
99.7
关
8
兴
,
99.4
关
6
兴
,
99.1
关
3
兴
,
98.8
关
1
兴
)
S.
epidermidis
S.
epidermidis
S.
epidermidis
S.
epidermidis
30
S.
epidermidis
S.
epidermidis
S.
epidermidis
S.
epidermidis
S.
epidermidis
(100.0
关
1
兴
,
99.7
关
1
兴
,
99.4
关
1
兴
)
S.
epidermidis
S.
hominis
S.
epidermidis
S.
epidermidis
3
S.
epidermidis
S.
epidermidis
S.
epidermidis
S.
epidermidis
S.
epidermidis
(99.1)
S.
epidermidis
S.
epidermidis
S.
aureus
S.
epidermidis
1
S.
epidermidis
S.
epidermidis
S.
epidermidis
S.
epidermidis
S.
hominis
S.
epidermidis
S.
epidermidis
S.
epidermidis
S.
epidermidis
1
S.
epidermidis/S.
capitis/
S.
caprae
(99.9)
S.
epidermidis
S.
epidermidis
S.
epidermidis
S.
epidermidis
S.
epidermidis
S.
epidermidis
S.
epidermidis
S.
epidermidis
1
S.
epidermidis
S.
epidermidis
S.
epidermidis
S.
caprae/ S.
capitis
S.
epidermidis
S.
epidermidis
S.
epidermidis
S.
epidermidis
S.
epidermidis
1
aWhere
the
percentage
of
identity
for
16S
rRNA
analysis
with
GenBank,
MicroSeq,
or
EzTaxon
or
for
tuf
analysis
with
GenBank
is
not
100%,
the
percentage
of
identity
is
given
in
parentheses,
and
the
number
of
isolates
with
that
percentage
of
identity
(if
more
than
1)
is
given
in
brackets.
on May 16, 2020 by guest
http://jcm.asm.org/
TABLE 2. Identification of 10 Staphylococcus capitis and 5 Staphylococcus caprae clinical isolates by genotypic a and phenotypic methods 16S rRNA analysis (GenBank) 16S rRNA analysis (MicroSeq) 16S rRNA analysis (EzTaxon) 16S rRNA analysis (BIBI) tuf gene analysis (GenBank) tuf gene analysis (BIBI) Vitek 2 MicroScan Definitive ID No. of isolates S. capitis/S. caprae/ S. epidermidis (99.8
关
3
兴
,
99.6
关
1
兴
) S. capitis/S. caprae/ S. epidermidis (99.9
关
4
兴
) S. caprae S. capitis/S. caprae S. capitis (100.0
关
3
兴
,
99.4
关
1
兴
) S. capitis S. capitis S. capitis S. capitis 4 S. capitis S. capitis/S. caprae/ S. epidermidis (99.9
关
2
兴
) S. caprae S. capitis/S. caprae S. capitis (99.1
关
2
兴
) S. capitis S. capitis S. capitis S. capitis 2 S. caprae/S. epidermidis/ S. capitis S. capitis S. caprae S. capitis/S. caprae S. capitis S. capitis S. capitis S. capitis S. capitis 1 S. capitis/S. caprae/ S. epidermidis (99.8) S. capitis/S. caprae/ S. epidermidis (99.9) S. caprae S. epidermidis S. capitis (99.1) S. capitis S. capitis S. capitis S. capitis 1 S. capitis/S. caprae/ S. epidermidis (99.8) S. capitis/S. caprae/ S. epidermidis (99.9) S. caprae S. capitis/S. caprae S. capitis (99.7) S. capitis S. capitis S. epidermidis S. capitis 1 S. caprae/S. epidermidis/ S. capitis (99.8) S. capitis/S. caprae/ S. epidermidis (99.9) S. caprae S. haemolyticus S. capitis (99.4) S. capitis S. capitis S. capitis S. capitis 1 S. arlettae/S. capitis/ S. caprae (99.8) S. capitis/S. caprae/ S. epidermidis (99.9) S. caprae/S. saccharolyticus/ S. epidermidis (99.8) S. capitis/S. caprae S. caprae (99.3) S. caprae S. caprae S. capitis S. caprae 1 S. arlettae/S. capitis/ S. epidermidis (99.6) S. capitis/S. caprae/ S. epidermidis (99.9) S. caprae/S. capitis/ S. saccharolyticus/S. epidermidis (99.8) S. capitis/S. caprae S. caprae (99.4) S. caprae S. simulans S. haemolyticus S. caprae 1 S. arlettae/S. capitis / S. caprae (99.8) S. capitis / S. caprae/ S. epidermidis (99.9) S. caprae/S. capitis / S. saccharolyticus/ S. epidermidis (99.8) S. capitis/S. caprae S. caprae (99.6) S. caprae S. caprae S. warneri S. caprae 1 S. arlettae/S. capitis/ S. epidermidis (99.5) S. capitis/S. caprae/ S. epidermidis (99.9) S. caprae/S. capitis/S. saccharolyticus/ S. epidermidis (99.8) S. capitis/S. caprae S. caprae S. caprae S. caprae S. epidermidis S. caprae 1 S. arlettae/S. capitis/ S. caprae (99.6) S. capitis/S. caprae/ S. epidermidis (99.9) S. capitis/S. caprae/ S. epidermidis (99.8) S. capitis/S. caprae S. caprae S. caprae S. caprae S. aureus S. caprae 1 a Where the percentage of identity for 16S rRNA analysis with GenBank, MicroSeq, or EzTaxon or for tuf analysis with GenBank is not 100%, the percentage of identity is given in parentheses, and the number of isolates with that percentage of identity (if more than 1) is given in brackets.
on May 16, 2020 by guest
http://jcm.asm.org/
[image:4.585.146.430.70.723.2]TABLE 3. Identification of 7 Staphylococcus haemolyticus and 22 Staphylococcus hominis clinical isolates by genotypic a and phenotypic methods 16S rRNA analysis (GenBank) 16S rRNA analysis (MicroSeq) 16S rRNA analysis (EzTaxon) 16S rRNA analysis (BIBI) tuf gene analysis (GenBank) tuf gene analysis (BIBI) Vitek 2 MicroScan Definitive ID No. of isolates S. auricularis/ S. haemolyticus/ S. warneri S. haemolyticus S. haemolyticus S. haemolyticus S. haemolyticus (99.7
关
1
兴
,
99.6
关
1
兴
,
99.1
关
1
兴
) S. haemolyticus S. haemolyticus S. haemolyticus S. haemolyticus 4 S. auricularis / S. haemolyticus/ S. warneri S. haemolyticus S. haemolyticus (99.8) S. capitis/S. caprae S. haemolyticus S. haemolyticus S. haemolyticus S. haemolyticus S. haemolyticus 1 S. auricularis/ S. haemolyticus/ S. warneri S. haemolyticus S. haemolyticus (99.7) S. haemolyticus S. haemolyticus S. haemolyticus S. epidermidis S. epidermidis S. haemolyticus 1 S. auricularis/ S. haemolyticus/ S. warneri S. haemolyticus S. haemolyticus (99.7) S. haemolyticus S. haemolyticus S. haemolyticus S. haemolyticus S. simulans S. haemolyticus 1 S. hominis/S. warneri/ S. hyicus (100.0
关
7
兴
,
99.8
关
2
兴
)
S.
hominis
(100.0
关
3
兴
,
99.9
关
1
兴
,
99.8
关
5
兴
)
S.
hominis
(100.0
关
3
兴
,
99.8
关
6
兴
) S. hominis S. hominis (100.0
关
2
兴
,
99.7
关
2
兴
,
99.6
关
1
兴
,
99.4
关
1
兴
,
99.3
关
1
兴
,
98.6
关
1
兴
,
98.3
关
1
兴
) S. hominis S. hominis S. hominis S. hominis 9 S. hominis S .hominis (99.9
关
1
兴
,
99.8
关
1
兴
,
99.7
关
4
兴
)
S.
hominis
(99.8
关
6
兴
) S. xylosus S. hominis (99.4
关
1
兴
,
99.1
关
2
兴
,
98.9
关
1
兴
,
98.8
关
1
兴
,
98.0
关
1
兴
) S. hominis S. hominis S. aureus S. hominis 6 S. hominis/S. warneri/ S. hyicus (100.0
关
2
兴
,
99.8
关
1
兴
)
S.
hominis
(99.8
关
3
兴
)
S.
hominis
(100.0
关
1
兴
,
99.8
关
2
兴
) S. xylosus S. hominis (100.0
关
2
兴
,
99.1
关
1
兴
) S. hominis S. hominis S. hominis S. hominis 3 S. hominis/S. warneri/ S. hyicus (99.8) S. hominis S. hominis S. hominis S. hominis S. hominis NA b S. hominis S. hominis 1 S. hominis/S. warneri/ S. hyicus S. hominis (99.8) S. hominis (99.8) S. xylosus S. hominis (99.1) S. hominis Kocuria variant S. hominis S. hominis 1 S. hominis/S. warneri/ S. hyicus S. hominis (99.7) S.
hominis/S. haemolyticus (99.8)
S. xylosus S. hominis S. hominis S. hominis S. hominis S. hominis 1 S. hominis/S. warneri/ S. hyicus S. hominis (99.7) S. hominis (99.8) S. hominis S. hominis (99.1) S. hominis S. hominis S. epidermidis S. hominis 1 aWhere the percentage of identity for 16S rRNA analysis with GenBank, MicroSeq, or EzTaxon or for tuf analysis with GenBank is not 100%, the percentage of identity is given in parentheses, and the number of isolates with that percentage of identity (if more than 1) is given in brackets. bNA, not available.
on May 16, 2020 by guest
http://jcm.asm.org/
the percentage of sequence identity to the type culture collec-tion or verified strains. Therefore, the results from these three methods were compared for their discriminatory power and for determination of the optimal sequence identity cutoff value for
the identification of CNS species bytufgene analysis.
Exclud-ing the results with 100% identity, MicroSeq and EzTaxon showed average identities of 99.85% and 99.80%, respectively,
with the reference sequence; for tuf gene analysis with
GenBank, 99.29% identity with the reference sequence was ob-served. The percentage of sequence identity was significantly higher for 16S rRNA analysis using MicroSeq or EzTaxon than
fortufgene analysis with GenBank (P⬍0.001). When identity
differences between the first and the second most probable ID results were compared, MicroSeq had a 1.57% difference;
EzTaxon, a 1.31% difference; andtufgene analysis, a 2.82%
difference. The average difference in the percentage of identity between the first and the second most probable IDs was
sig-nificantly higher for tuf gene analysis with GenBank than
for16S rRNA analysis with MicroSeq or EzTaxon (P⬍0.001).
Interpretative criteria for tuf gene analysis of coagulase-negative staphylococci.Currently, there are no guidelines for
the interpretation of data generated by tufgene analysis for
bacterial identification. Therefore, we applied the CLSI
MM18-A guidelines to the results fortufgene analysis.
Over-all, 88.7% of the specimens could be identified withⱖ99.0%
species identity and with⬎0.8% separation between species.
Additionally, 9.3% of the specimens were identified with
ⱖ97.0% sequence identity for genus identification. Results
that could be reported only to the genus level according to the
CLSI guidelines (ⱖ97.0% identity) were identified correctly
with respect to the definitive ID once we adjusted the criteria
for species identification toⱖ98.0% identity with⬎0.8%
sep-aration between species. A total of 98.0% of the specimens could be identified correctly to the species level.
DISCUSSION
Many laboratories use the 16S rRNA region as a target for identification because it is widely used and is supported with a large amount of data within public databases; further, guide-lines for data interpretation exist. However, because 16S rRNA analysis has low discriminatory power for the
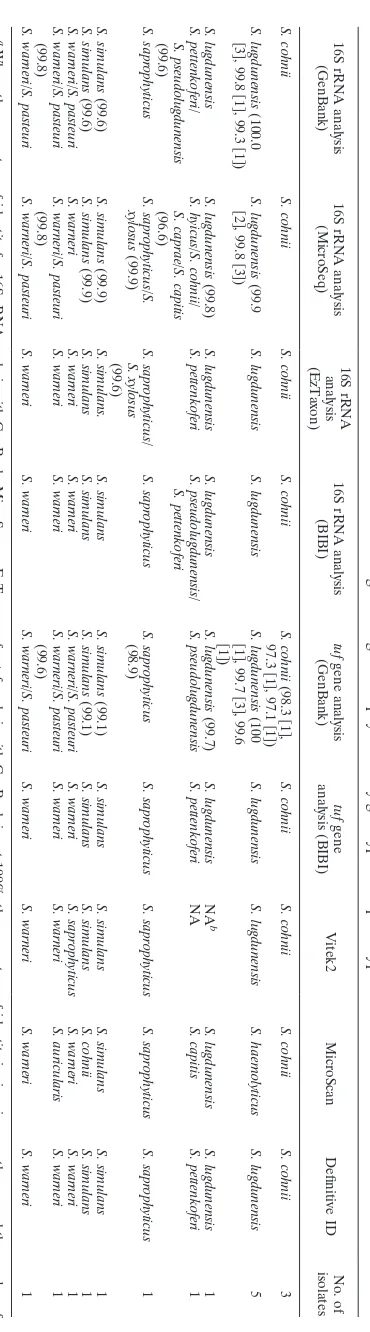
identifi-TABLE 4. Identification of 16 other coagulase-negative staphylococci by genotypic a and phenotypic methods 16S rRNA analysis (GenBank) 16S rRNA analysis (MicroSeq) 16S rRNA analysis (EzTaxon) 16S rRNA analysis (BIBI) tuf gene analysis (GenBank) tuf gene analysis (BIBI) Vitek2 MicroScan Definitive ID No. of isolates S. cohnii S. cohnii S. cohnii S. cohnii S. cohnii (98.3
关
1
兴
,
97.3
关
1
兴
,
97.1
关
1
兴
) S. cohnii S. cohnii S. cohnii S. cohnii 3 S. lugdunensis (100.0
关
3
兴
,
99.8
关
1
兴
,
99.3
关
1
兴
)
S.
lugdunensis
(99.9
关
2
兴
,
99.8
关
3
兴
) S. lugdunensis S. lugdunensis S. lugdunensis (100
关
1
兴
,
99.7
关
3
兴
,
99.6
关
1
兴
[image:6.585.75.260.56.722.2]) S. lugdunensis S. lugdunensis S. haemolyticus S. lugdunensis 5 S. lugdunensis S. lugdunensis (99.8) S. lugdunensis S. lugdunensis S. lugdunensis (99.7) S. lugdunensis NA b S. lugdunensis S. lugdunensis 1 S. pettenkoferi/ S. pseudolugdunensis (99.6) S. hyicus/S. cohnii/ S. caprae/S. capitis (96.6) S. pettenkoferi S. pseudolugdunensis/ S. pettenkoferi S. pseudolugdunensis S. pettenkoferi NA S. capitis S. pettenkoferi 1 S. saprophyticus S. saprophyticus/S. xylosus (99.9) S. saprophyticus/ S. xylosus (99.6) S. saprophyticus S. saprophyticus (98.9) S. saprophyticus S. saprophyticus S. saprophyticus S. saprophyticus 1 S. simulans (99.6) S. simulans (99.9) S. simulans. S. simulans S. simulans (99.1) S. simulans S. simulans S. simulans S. simulans 1 S. simulans (99.6) S. simulans (99.9) S. simulans S. simulans S. simulans (99.1) S. simulans S. simulans S. cohnii S. simulans 1 S. warneri/S. pasteuri S. warneri S. warneri S. warneri S. warneri/S. pasteuri S. warneri S. saprophyticus S. warneri S. warneri 1 S. warneri/S. pasteuri (99.8) S. warneri/S. pasteuri (99.8) S. warneri S. warneri S. warneri/S. pasteuri (99.6) S. warneri S. warneri S. auricularis S. warneri 1 S. warneri/S. pasteuri S. warneri/S. pasteuri S. warneri S. warneri S. warneri/S. pasteuri S. warneri S. warneri S. warneri S. warneri 1 a Where the percentage of identity for 16S rRNA analysis with GenBank, MicroSeq, or EzTaxon or for tuf analysis with GenBank is not 100%, the percentage of identity is given in parentheses, and the number of isolates with that percentage of identity (if more than 1) is given in brackets. b NA, not available.
TABLE 5. Discordant results by different methods
Method
No. (%) of isolates with:
Total no. of isolates A single ID
in concordance
with the definitive ID
Multiple IDs, one of which is in agreement with the definite ID
A discordant ID
16S rRNA analysis
GenBank 56 (57.7) 39 (40.2) 2 (2.1) 97
MicroSeq 81 (83.5) 15 (15.5) 1 (1.0) 97
EzTaxon 80 (82.5) 7 (7.2) 10 (10.3) 97
BIBI 67 (69.1) 15 (15.5) 15 (15.5) 97
tufgene analysis
GenBank 92 (94.8) 3 (3.1) 2 (2.1) 97
BIBI 97 (100.0) 0 (0.0) 0 (0.0) 97
Vitek 2 83 (91.2) 0 (0.0) 8 (8.8) 91
MicroScan 70 (80.5) 0 (0.0) 17 (19.5) 87
on May 16, 2020 by guest
http://jcm.asm.org/
[image:6.585.299.540.79.242.2]cation of certain CNS species (4, 12, 20), other target genes,
such as thetufgene, have been studied for CNS identification
and exhibit good resolution (2, 6, 14). In the genomic era, postsequencing analyses have become an important part of molecular diagnostics. However, information regarding the in-terpretation of genotypic results with different databases is limited. Here, for the first time, we compared 16S rRNA
se-quencing results using four different databases,tufgene
anal-ysis using two different databases, and two phenotypic identi-fication systems.
The results of our study showed thattufgene analysis
gen-erally exhibited better discriminatory power for CNS species identification than 16S rRNA analysis. Further, the use of multiple databases is important, because the results differ de-pending on the database used. Although disparities existed for the various databases used, there were fewer discordant results
withtufgene analysis than with 16S rRNA analysis, and the
kappa coefficients fortufgene analysis were higher than those
for 16S rRNA analysis; these results support the
appropriate-ness oftufgene analysis as another method for species
iden-tification (2, 6). In addition, there were markedly fewer cases
of multiple probable IDs withtufgene analysis; the differences
in the percentage of sequence identity between the first and the second probable IDs were greater. This finding was also made in other studies, and it was suggested through phyloge-netic studies and assessment with different databases that the
tufgene had more intraspecies variability than 16S rRNA (15,
23). Therefore, further confirmation with other methods or
targets would be required less often withtufgene analysis than
with 16S rRNA gene analysis. Because it is particularly impor-tant to provide an accurate and clearly defined result for a requested test in clinical laboratories, the discriminatory power of identification tests is very important.
16S rRNA sequence analysis with all four different databases
showed low discriminatory power forS. capitisandS. caprae,
suggesting the use of an alternative target, as recommended in
the CLSI MM18-A document.tufgene analysis was capable of
distinguishing between these two species.S. warneriis reported
to share approximately 98.7% sequence identity withS.
pas-teuri(22), andtufandrpoBgene analyses are generally known to provide better resolution between these two species (6).
However, sequence analysis with GenBank reported bothS.
pasteuriandS. warnerias probable IDs regardless of the target
(16S rRNA or the tuf gene). Using 16S rRNA analysis,
EzTaxon reportedS. warnericorrectly, which could be due to the
fact that the database is based on different algorithms and data sources, curated from the primary database GenBank.
Al-thoughS. saprophyticus and S. xylosus are known to exhibit
approximately 100% identity in their 16S rRNA sequences (22), the sequence analysis results differed depending on the database; the secondary databases, MicroSeq and EzTaxon, could not distinguish between these species, but GenBank did. These results emphasize the need to utilize multiple databases, both primary and secondary databases, for the interpretation of sequencing analysis data for any DNA target.
Although, with 97 clinical specimens, our study included many CNS species, other species that may be encountered in
clinical laboratories, such asStaphylococcus intermedius,
Staph-ylococcus schleiferi, andStaphylococcus pseudintermedius, were not included and should be examined in a future study. In
addition, we chose the ID that appeared most frequently as the definitive ID; however, this may not be the correct species ID. Further analysis with type strains is required to support and confirm the definitive IDs of this study. This study used partial
sequencing for both 16S rRNA and tuf gene analysis and
provided reliable results, excluding one case (S.
petten-koferi), suggesting that partial sequencing of the two genes is sufficient for clinical use. In addition, a minimal modifica-tion of the CLSI MM18-A guidelines for species
identifica-tion criteria ofⱖ98.0% identity with⬎0.8% separation
be-tween species yielded reliable results fortufgene analysis.
From this study, it appears that the tuf gene is a useful
alternative target for CNS species identification that exhibits higher discriminatory power than 16S rRNA. Although no
guidelines exist fortufgene analysis, minimally modified CLSI
MM18-A criteria can be used to obtain reliable results with low ambiguity and high sensitivity. Integrating results from differ-ent databases for postsequencing analysis is important for ac-curate diagnosis.
REFERENCES
1.Ahlstrand, E., K. Svensson, L. Persson, U. Tidefelt, and B. So¨derquist.5 April 2011. Glycopeptide resistance in coagulase-negative staphylococci iso-lated in blood cultures from patients with hematological malignancies during three decades. Eur. J. Clin. Microbiol. Infect. Dis. doi:10.1007/s10096-011-1228-8.
2.Alexopoulou, K., et al.2006. Comparison of two commercial methods with
PCR restriction fragment length polymorphism of thetufgene in the
iden-tification of coagulase-negative staphylococci. Lett. Appl. Microbiol.43:450–
454.
3.Bearman, G., and R. Wenzel.2005. Bacteremias: a leading cause of death.
Arch. Med. Res.36:646–659.
4.Becker, K., et al.2004. Development and evaluation of a quality-controlled ribosomal sequence database for 16S ribosomal DNA-based identification of
Staphylococcusspecies. J. Clin. Microbiol.42:4988–4995.
5.Benson, D. A., I. Karsch-Mizrachi, D. J. Lipman, J. Ostell, and E. W. Sayers.
2011. GenBank. Nucleic Acids Res.39:D32–D37.
6.Bergeron, M., et al.2011. Species identification of staphylococci by
amplifi-cation and sequencing of thetufgene compared to thegapgene and by
matrix-assisted laser desorption ionization time-of-flight mass spectrometry.
Eur. J. Clin. Microbiol. Infect. Dis.30:343–354.
7.Capurro, A., et al. 2009. Comparison of a commercialized phenotyping
system, antimicrobial susceptibility testing, and tuf gene sequence-based
genotyping for species-level identification of coagulase-negative
staphylo-cocci isolated from cases of bovine mastitis. Vet. Microbiol.134:327–333.
8.Cheung, G., and M. Otto.2010. Understanding the significance of Staphy-lococcus epidermidisbacteremia in babies and children. Curr. Opin. Infect.
Dis.23:208–216.
9.Chun, J., et al.2007. EzTaxon: a web-based tool for the identification of prokaryotes based on 16S ribosomal RNA gene sequences. Int. J. Syst. Evol.
Microbiol.57:2259–2261.
10.Clarridge, J., III.2004. Impact of 16S rRNA gene sequence analysis for identification of bacteria on clinical microbiology and infectious diseases.
Clin. Microbiol. Rev.17:840–862.
11.Devulder, G., G. Perriere, F. Baty, and J. Flandrois.2003. BIBI, a
bioinfor-matics bacterial identification tool. J. Clin. Microbiol.41:1785–1787.
12.Drancourt, M., and D. Raoult.2002.rpoBgene sequence-based
identifica-tion ofStaphylococcusspecies. J. Clin. Microbiol.40:1333–1338.
13.Garza-Gonza´lez, E., et al.19 August 2011. Microbiological and molecular
characterization of human clinical isolates ofStaphylococcus cohnii,
Staphy-lococcus hominis, andStaphylococcus sciuri. Scand. J. Infect. Dis. doi: 10.3109/00365548.2011.598873.
14.Ghebremedhin, B., F. Layer, W. Konig, and B. Konig.2008. Genetic
classi-fication and distinguishing ofStaphylococcusspecies based on different
par-tialgap, 16S rRNA,hsp60,rpoB,sodA, andtufgene sequences. J. Clin.
Microbiol.46:1019–1025.
15.Heikens, E., A. Fleer, A. Paauw, A. Florijn, and A. Fluit.2005. Comparison of genotypic and phenotypic methods for species-level identification of
clin-ical isolates of coagulase-negative staphylococci. J. Clin. Microbiol.43:2286–
2290.
16.Isaacs, D.2003. A ten year, multicentre study of coagulase negative staph-ylococcal infections in Australasian neonatal units. Arch. Dis. Child. Fetal
Neonatal Ed.88:F89–F93.
17.Kim, M., et al.2008. Comparison of the MicroScan, VITEK 2, and Crystal
on May 16, 2020 by guest
http://jcm.asm.org/
GP with 16S rRNA sequencing and MicroSeq 500 v2. 0 analysis for
coagu-lase-negative staphylococci. BMC Microbiol.8:233.
18.Larkin, M., et al.2007. Clustal W and Clustal X version 2.0. Bioinformatics
23:2947–2948.
19.Martineau, F., et al.2001. Development of a PCR assay for identification of
staphylococci at genus and species levels. J. Clin. Microbiol.39:2541–2547.
20.Mellmann, A., et al. 2006. Sequencing and staphylococci identification.
Emerg. Infect. Dis.12:333–336.
21.Otto, M.2009.Staphylococcus epidermidis—the ‘accidental’ pathogen. Nat.
Rev. Microbiol.7:555–567.
22.Petti, C., et al.2008. Interpretative criteria for identification of bacteria and fungi by DNA target sequencing; approved guideline. CLSI document MM-18A. Clinical and Laboratory Standards Institute, Wayne, PA.
23.Petti, C., et al.2008. Genotypic diversity of coagulase-negative
staphylo-cocci causing endocarditis: a global perspective. J. Clin. Microbiol.46:
1780–1784.
24.Poyart, C., G. Quesne, C. Boumaila, and P. Trieu-Cuot.2001. Rapid and accurate species-level identification of coagulase-negative staphylococci by
using thesodAgene as a target. J. Clin. Microbiol.39:4296–4301.
25.Rogers, K., P. Fey, and M. Rupp.2009. Coagulase-negative staphylococcal
infections. Infect. Dis. Clin. North Am.23:73–98.
26.Rupp, M., and G. Archer.1994. Coagulase-negative staphylococci:
patho-gens associated with medical progress. Clin. Infect. Dis.19:231–243.
27.Shah, M., et al.2007.dnaJgene sequence-based assay for species
identifi-cation and phylogenetic grouping in the genusStaphylococcus. Int. J. Syst.
Evol. Microbiol.57:25–30.
28.Sivadon, V., et al.2005. Use of genotypic identification bysodAsequencing in a prospective study to examine the distribution of coagulase-negative
Staphylococcus species among strains recovered during septic orthopedic
surgery and evaluate their significance. J. Clin. Microbiol.43:2952–2954.
29.Song, S., et al.2009. Human bloodstream infection caused byStaphylococcus pettenkoferi. J. Med. Microbiol.58:270–272.
30.Tatusova, T., and T. Madden.1999. BLAST 2 Sequences, a new tool for
comparing protein and nucleotide sequences. FEMS Microbiol. Lett.174:
247–250.
31.Weinstein, M., et al.1997. The clinical significance of positive blood cultures in the 1990s: a prospective comprehensive evaluation of the microbiology, epidemiology, and outcome of bacteremia and fungemia in adults. Clin.
Infect. Dis.24:584–602.
32.Woo, P., et al.2003. Usefulness of the MicroSeq 500 16S ribosomal DNA-based bacterial identification system for identification of clinically significant bacterial isolates with ambiguous biochemical profiles. J. Clin. Microbiol.
41:1996–2001.