R E S E A R C H
Open Access
Early disability in
ambulatory
patients with
multiple sclerosis: optical coherence
tomography versus visual evoked
potentials, a comparative study
Mohamed N. Thabit
1*, Mahmoud Mohamed Farouk
2, Martha Awni
1and Al-Amir Bassiouny Mohamed
1Abstract
Background:Multiple sclerosis (MS) is a common cause of neurological disabilities in adults and commonly affects the visual pathway. The objective of this study is to assess and compare the sensitivity of visual evoked potentials (VEP) and optical coherence tomography (OCT) as measures of early disability inambulatorypatients with MS.
Methods:Forty-four patients with MS with Expanded Disability Status Scale (EDSS) of≤4.5 (ambulatory patients) and 14 healthy controls participated in this study. Patients were classified into 3 groups according to EDSS. Patients with EDSS of 0–1.5 formed the“No disability,”patients with EDSS of 2–3 formed the“Minimal to mild disability,” and finally patients with EDSS of 3.5–4.5 formed the“Moderate to significant disability”groups. N75/P100
amplitude, P100 latency, retinal nerve fiber layer (RNFL) thickness, and ganglion cell layer complex (GCLC) thickness were measured.
Results:Patients showed significantly lower N75/P100 amplitude, higher P100 latency, lower RNFL, and GCLC thicknesses compared to controls. However, there were non-significant changes in P100 latency, N75/P100 amplitude, and GCLC thickness among the 3 groups for both patients with and without history of optic neuritis (ON). On contrary, RNFL thickness was significantly different between the three groups for both patients with and without history of ON. Factorial ANOVA revealed non-significant disability × History of ON interaction.
Conclusion:Compared to VEP parameters, RNFL thickness was a sensitive correlate with the various degrees of early disability in fully ambulatory patients with MS whatever the history of ON.
Keywords:Multiple sclerosis, Axonal loss, Optical coherence tomography, Retinal nerve fiber layer, Ganglion cell layer, VEP
Introduction
Multiple sclerosis (MS) is a common neurological disease affecting about 2.5 million patients worldwide. MS is char-acterized by demyelination and axonal degeneration in the central nervous system and is the commonest cause of non-traumatic neurological disability in young adults as more than one million people suffer from physical
disabilities caused by MS [1–4]. In an Egyptian study, the prevalence of MS in Egypt was found to be 14.1/100,000 and about 2.5 million worldwide [5,6].
Approximately, 25% of patients with MS suffer from optic neuritis (ON) as an initial manifestation of the dis-ease. Moreover, ON occurs in about 50% of patients during the course of the disease and in about 99% of pa-tients with MS in post-mortem examination irrespective to the clinical history of ON [7]. ON is an acute inflam-matory process of the optic nerve that leads to retro-grade axonal degeneration in the peripapillary retinal
© The Author(s). 2020Open AccessThis article is licensed under a Creative Commons Attribution 4.0 International License, which permits use, sharing, adaptation, distribution and reproduction in any medium or format, as long as you give appropriate credit to the original author(s) and the source, provide a link to the Creative Commons licence, and indicate if changes were made. The images or other third party material in this article are included in the article's Creative Commons licence, unless indicated otherwise in a credit line to the material. If material is not included in the article's Creative Commons licence and your intended use is not permitted by statutory regulation or exceeds the permitted use, you will need to obtain permission directly from the copyright holder. To view a copy of this licence, visithttp://creativecommons.org/licenses/by/4.0/.
* Correspondence:[email protected]
1Department of Neurology, Sohag University Hospital, Sohag University, Madinat Nasser, Sohag 82524, Egypt
nerve fiber layer (pRNFL) and the whole ganglion cell layer complex (GCLC), which included the complex of ganglion cells plus the inner plexiform plus the RNFL layers, leading to persistent visual dysfunction [8, 9]. Re-cent autopsy studies of patients with MS have shown retinal pathology irrespective of the disease duration. Moreover, the retina is formed of many layers of unmy-elinated nerve fibers that may serve as a good model for studying axonal pathology of patients with MS and other neurodegenerative disorders and hence might be related to the disability in those patients [7,9,10].
Before the advent of MRI, evoked potentials in general and especially visual evoked potentials (VEP) were used to document clinically manifest and silent lesions in MS and were part of routine diagnosis. Moreover, VEP may give information about the functional assessment of myelin, axons, and synapses of the visual pathway, especially its prechiasmatic portion, and it was a valuable tool for moni-toring MS progression and prognosis [11, 12]. The N75/ P100 amplitude reflects the number of functioning axons reaching the visual cortex and is reduced due to transient conduction block during acute ON and/or permanent axonal loss in the optic nerve. VEP latency is unique in which it reflects the integrity of myelin and is potentially useful in measuring the extent of demyelination/remyeli-nation in the visual pathway [8,13].
Optical coherence tomography (OCT) is a 3D imaging technique that generates cross-sectional images of the retina, which can be used to quantify axonal and neur-onal atrophy [14]. In 1999, Parisi et al. reported signifi-cant reduction in pRNFL thickness in OCT of patients with MS. Since then, many studies using OCT found re-duction in pRNFL thickness in patients with MS with and without previous ON [15]. OCT measurements of GCLC and pRNFL have been proposed as biomarkers of axonal damage in MS regardless the history of ON [10, 16]. Axonal damage is associated with both physical and cognitive disabilities of patients with MS [4]. Some stud-ies suggested that OCT measurements may be more ac-curate than MRI parameters to determine progression in patients with neuromyelitis optica [17]. The pRNFL thickness was found to predict disability in patients with MS [4,7]. Other studies found that GCLC thickness also can be considered a marker of axonal damage and dis-ability in patients with MS [4,7,10].
Methods
Aim of the work
The aims of our study are to compare the measurements of both VEP and OCT in ambulatory patients with MS who are not significantly disabled and healthy controls and to compare the results of VEP and OCT in patients with minor levels of disability trying to detect which of
both techniques is more sensitive and more correlated withminor disability.
Subjects
Forty-four patients with relapsing-remitting MS (14 males and 30 females; mean age ± SD = 33.3 ± 8.7) and 14 healthy controls (6 males and 8 females; mean age ± SD = 34.1 ± 10.7) participated in this cross-sectional study. There were no statistically significant differences between patients and controls regarding age and sex. Pa-tients with MS were diagnosed according to the criteria of McDonalds 2017 [18] and were recruited from the neurology and ophthalmology clinics of Sohag University Hospital during the period from July 2017 to November 2018. Healthy volunteers served as controls and were re-cruited from the staffs and workers of our hospital, friends, and some family members of patients. Patients with neurological deficit caused by any other conditions rather than MS (MS mimics) including patients with col-lagen vascular, diabetes mellitus, or degenerative disor-ders, and patients who suffered current or recent attacks (< 3 months before participation in the study) which is enough time for retrograde retinal axonal degeneration according to many human (retinal axonal degeneration is maximal at the second month of ON) and animal (max-imal from day 11 and end at day 33 from onset of ON) studies [19–21] of ON or those who suffers high myopia > 5 D and eyes with other ocular diseases that can affect the results of the test variables mentioned below were also ex-cluded from this study. Control participants with history of eye or neurologic disease (other than corrected, non-pathologic refractive error) were excluded from the study. All study participants signed an informed written consent and the study protocol was approved by the local ethics committee of Sohag University Hospital.
Expanded Disability Status Scale (EDSS) was used for measuring disability in patients with MS. Fullambulatory
Visual evoked potential
VEP were recorded from occipital scalp according to the standard protocol of the International Society for Clin-ical Electrophysiology of VEP [23] using Neuropack MEB-2300; Nihon-Kohden, Tokyo, Japan. Monocular visual stimulation was performed using a pattern-reversal checkerboard screen. Latencies of N75 and P100 and N75/P100 amplitudes were determined for all re-cordings. The mean P100 latencies and N75/P100 ampli-tudes of the right and the left eyes of each study participant were calculated.
Optical coherence tomography
All subjects underwent complete routine ophthalmic examination including best corrected visual acuity, intra-ocular pressure, slit lamb examination of the anterior segment, and fundus examination. Any case with signs of a disease which may affect the OCT findings were ex-cluded from the study (i.e., glaucoma, optic atrophy, or optic disc edema).
The OCT examination of the optic disc and macula was performed by the RTVue instrument (Model RTVue premier, Fremont, California, USA) to measure the pRNFL thickness and the GCLC, which is a composite of the inner plexiform layer, ganglion cell layer, and nerve fiber layer.
Two images were acquired separately, one centered on the optic nerve head and the other centered on the fovea to measure the pRNFL thickness and GCLC respectively. The pattern-based GCLC parameters were calculated by the RTVue software and included the global loss volume (GLV) and the focal loss volume (FLV). The GCLC was measured in an area of 7.0 mm by 7.0 mm that is cen-tered at 1.0 mm temporal to fovea. The GLV represents the number of pixels that demonstrate a loss of GCLC relative to the normative data divided by the total num-ber of pixels in the scanned area to determine the per-centage of global GCLC loss in the entire map.
The FLV represents the thickness value at each pixel within the scanned area to generate a “pattern map” to determine percentage of focal GCLC loss in the entire map. The RNFL thickness was divided into 8 sectors at 0°, 45°, 90°, 135°, 180°, 225°, 270°, and 315°measured within an area of diameter 3.45 mm around optic disc.
Statistical analysis
Demographic data were presented as mean ± SD if nor-mally distributed, median (range) if not nornor-mally distrib-uted, and percentage for categorical data. Data for the various parameters of VEP and OCT were presented as mean ± SEM. The Kolmogorov-Smirnov test of normal-ity was used for numerical data. The statistical package SPSS for Windows (Version 16) was used for statistical analysis. Independent sample T test and ANOVA were used to determine the significant differences between groups for the numerical data. Chi-squared test and Kruskal-Wallis tests were used for categorical data and non-normally distributed numerical data. P value of < 0.05 was considered statistically significant.
Results
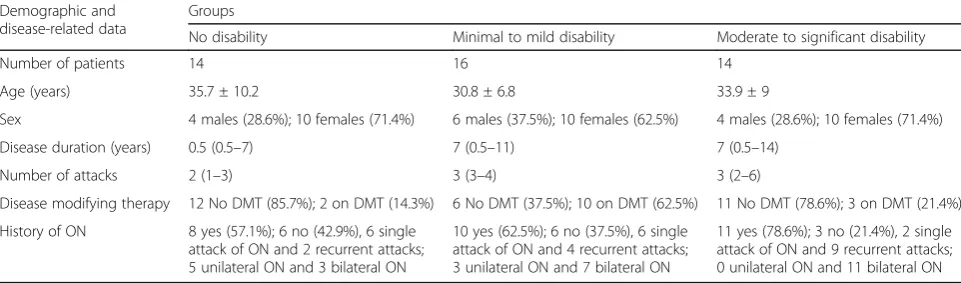
The demographic characters and other MS-related data including the data relevant to history of ON are pre-sented in Table1 for each of the 3 groups under study. Patients with MS with no disability showed statistically significant lower disease duration and number of attacks compared to patients with mild up to significant disabil-ity (F = 5.49, P = 0.008; and F = 9.158, P = 0.001) re-spectively. Post hoc testing with Bonferroni correction revealed only significant difference between the group with “No Disability” and the groups “Minimal to mild disability” and “Moderate to significant disability” for both disease duration and number of attacks respectively (P= 0.017,P= 0.021; andP= 0.01,P= 0.001). The dis-tribution of DMT was not the same across the groups of disability as Kruskal-Wallis testing showed significant difference between the three groups (P= 0.011).
Table 1Demographic and disease variables of patients with MS
Demographic and disease-related data
Groups
No disability Minimal to mild disability Moderate to significant disability
Number of patients 14 16 14
Age (years) 35.7 ± 10.2 30.8 ± 6.8 33.9 ± 9
Sex 4 males (28.6%); 10 females (71.4%) 6 males (37.5%); 10 females (62.5%) 4 males (28.6%); 10 females (71.4%)
Disease duration (years) 0.5 (0.5–7) 7 (0.5–11) 7 (0.5–14)
Number of attacks 2 (1–3) 3 (3–4) 3 (2–6)
Disease modifying therapy 12 No DMT (85.7%); 2 on DMT (14.3%) 6 No DMT (37.5%); 10 on DMT (62.5%) 11 No DMT (78.6%); 3 on DMT (21.4%)
History of ON 8 yes (57.1%); 6 no (42.9%), 6 single attack of ON and 2 recurrent attacks; 5 unilateral ON and 3 bilateral ON
10 yes (62.5%); 6 no (37.5%), 6 single attack of ON and 4 recurrent attacks; 3 unilateral ON and 7 bilateral ON
11 yes (78.6%); 3 no (21.4%), 2 single attack of ON and 9 recurrent attacks; 0 unilateral ON and 11 bilateral ON
There were statistically significant differences between patients and controls in all the data of both VEP and OCT measurements (Table 2). Further comparing the control group and the patients with MS without disabil-ity “No disability,” independent sample T test revealed significant differences in most of the parameters of VEP and OCT (T= 5.101, P< 0.001;T= 3.388,P= 0.001;T
= 3.281,P= 0.002;T= 3.649,P= 0.001;T = 4.257,P < 0.001; andT = 1.842,P= 0.075) for P100 Latency, N75/ P100 amplitude, pRNFL thickness, GCLC thickness, GLV, and FLV respectively.
One-way ANOVA taking the P100 latency, N75/P100 amplitude, pRNFL thickness, and GCLC thickness as within subject factors and disability with its three levels
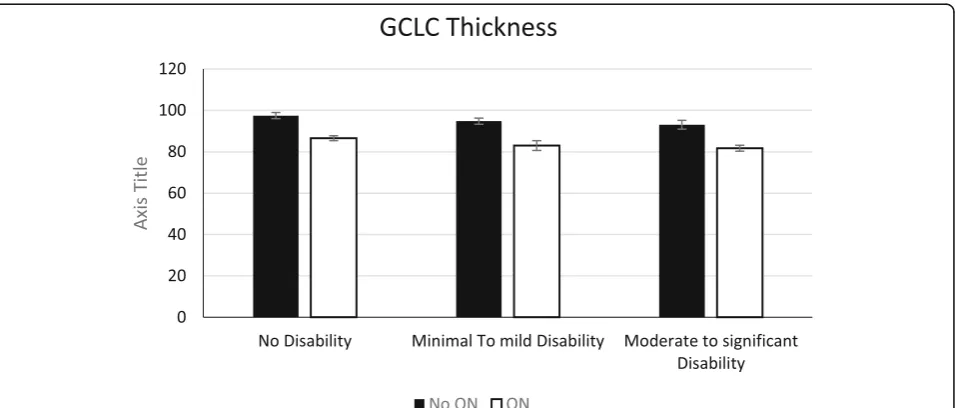
“No disability,” “Minimal to mild disability,” and “ Mod-erate to significant disability” as between subject factor with comparing the patients according to the history of ON revealed non-significant differences in P100 latency, N75/P100 amplitude, and GCLC thickness for both pa-tients without and papa-tients with history of ON (F = 1.871,P = 0.173;F= 1.034,P = 0.369; andF= 1.505,P
= 0.24; for patients without history of ON andF= 1.523,
P = 0.227; F = 0.673, P = 0.515; and F = 2.666, P = 0.079; for patients with history of ON, respectively). However, pRNFL thickness was significantly different between the three groups for both patients without and patients with history of ON (F= 6.892,P= 0.004, andF
= 4.308,P= 0.018, respectively) (Figs.1,2,3, and4). Factorial ANOVA taking the pRNFL thickness as the within subject dependent variable and both disability and history of ON as fixed between subjects’variables revealed non-significant disability × History of ON interaction (F= 2.364,P= 0.1) meaning that pRNFL thickness was a sensi-tive correlate with the degree of disability in fully
ambulatory patients with MS whether they suffered ON or not. Moreover, factorial ANOVA taking the pRNFL thickness as the within subject-dependent variable and both subject (cases vs controls) and site (temporal vs nasal pRNFL thicknesses) as fixed between subject variables re-vealed significant effect of subject (F= 32.394,P< 0.001) and also significant effect of site (F= 5.456, P = 0.021); however, there was non-significant subject × site inter-action (F= 2.561,P= 0.112) meaning that the reduction of the pRNFL thickness in patients with MS was not dependent on its site whether nasal of temporal part of the retina.
Discussion
The results of our study supports the utility of OCT as a safe, widely available, inexpensive, non-invasive tool of measurement of the degree of thinning of the pRNFL thickness for assessment of axonal neurodegenerative changes in patients with MS.
MS is an immune-mediated not only demyelinating, but also a neurodegenerative neurological disorder with axonal damage. Previous studies supported that both in-flammatory and neurodegenerative mechanisms co-exist in patients with MS and results in non-reversible axonal damage causing the permanent disability in those patients [24–26]. The retina is an accessible good tool for studying neurodegenerative mechanisms in many diseases because retinal axons lack myelin sheaths, and changes in its struc-ture reflects only axonal damage. The pRNFL is made up of the unmyelinated axons of the retinal ganglion cells traveling to lateral geniculate body [7,9,10,14].
This study demonstrated that both VEP and OCT were sensitive measurements of axonal damage not only in patients with MS compared to healthy controls, but also in patients with MS who are still “ambulatory.” Moreover, we found that both VEP and OCT parameters were significantly different between patients and healthy controls even if there is no neurological disability as we found significant differences in both VEP and OCT pa-rameters between ambulatorypatients with “No disabil-ity” group and healthy controls. However, testing the differences in both P100 latency, N75/P100 amplitude, and the GCLC thickness regarding the various grades of disability in ambulatory patients with MS revealed no significant differences among the three groups meaning that those parameters although sensitive but not strictly correlated with the degree of early disability. On con-trary, pRNFL thickness not only was significantly differ-ent among the three groups of disability, but also was not dependent on whether the patient suffered ON or not. This means that the pRNFL thickness can be taken as a significant correlate with the level of early disability in ambulatory patients with MS in the early stages of the disease.
Table 2VEP and OCT measurements for patients with MS and healthy controls
Variable Subject Mean ± SEM Tvalue Pvalue P100 latency Case 132.3 ± 2.2 9.673 < 0.001
Control 107.7 ± 1.8
N75/P100 amplitude Case 7.8 ± 0.48 21.448 < 0.001
Control 13.7 ± 0.56
RNFL thickness Case 99.5 ± 1.3 5.061 < 0.001
Control 112.8 ± 2
GCLC thickness Case 87.6 ± 0.9 4.888 < 0.001
Control 95.8 ± 1
GLV Case 10.6 ± 0.7 7.165 < 0.001
Control 5.1 ± 0.39
FLV Case 2.7 ± 0.3 4.444 < 0.001
Control 1.3 ± 0.1
Changes in VEP and OCT parameters in patients with MS were not related to the clinical history of previous ON. The pRNFL thickness was significantly different be-tween the three groups with different degree of disability whether there is history of ON or not. The affection of OCT parameters (GCLC and pRNFL) was evident in our study as well as many other studies [27,28].
To determine whether the affection of the pRNFL affec-tion is related to the disease itself or related to recent pre-vious attack of ON is an important point. We excluded patients with MS who have recent history (within 3 months) of ON who may suffer retinal injury of a dispro-portionate degree of the global brain rather than the local retinal neurodegeneration [29] to exclude the damage
precipitated by ON as a manifestation of MS rather than disability of MS. As we reported that it is affected inde-pendently from the history of ON, so it can be a patho-logical sign of the disease itself. Klistorner et al. reported that the pRNFL and the optic radiation were affected in MS patients without history of ON; these results agree with our study [30]. Furthermore, those findings of our study and other studies regarding the affection of the OCT parameters in patients with MS without clear history of ON can be explained by either unknown subclinical at-tacks of ON, the retrograde axonal and retinal ganglion cell degeneration due to MS lesions within the brain that may result in pRNFL loss, or by other mechanisms leading to neurodegeneration in patients with MS [31,32].
Fig. 1Mean P100 latency in the 3 patient groups with history of optic neuritis (ON) and without history of optic neuritis (No ON)
The degree of affection of the pRNFL thickness was cor-related with the degree of disability in fully ambulatory
patients. Gelfand et al. reported the same affection in more advanced disease stage and they also concluded that the thinning of pRNFL was more in patients with history of ON which was not evident in our data in fully ambula-torypatients [33]. However, the correlation of neurological disability in patients with MS measured by the EDSS and the pRNFL thickness is still a debatable issue as some au-thors found a significant relation between both parameters [34–38] and others denied this relation [39,40]. Interest-ingly, some authors explained this discrepancy by the
inclusion of patients with various levels of disability ran-ging from mild to severe bedridden or wheelchaired pa-tients [36, 41], and that was the reason of inclusion of
ambulatorypatients with MS in our study.
The results of this study points to the degree of pRNFL loss as a correlated factor with the degree of dis-ability in a fully ambulatory patients with MS whether they suffered from ON or not. But this degree of loss was not dependent on the site whether nasal or tem-poral. On the other hand, Birkeldh et al. reported that the temporal pRNFL thickness is more associated with the degree of disability in MS using the EDSS scoring
Fig. 3Mean retinal nerve fiber layer (RNFL) thickness in the 3 patient groups with history of optic neuritis (ON) and without history of optic neuritis (No ON)
system, and the degree of association was higher for the temporal pRNFL than the average pRNFL calculated by regression coefficient. We could not find the exact cause of difference between the results of our study and these data, but it may be related to the small sample size in our study and/or the racial difference which is always taken in consideration in all OCT machines and studies [42]. The GCLC as one of the parameters of OCT and represents the ganglion cells with its dendrites and axons was significantly affected in all ambulatory pa-tients of MS in our study when compared to controls. The same results were reported by previous studies [42].
The GCLC did not show significant differences ac-cording to the degree of disability. Pietroboni et al. re-ported that the ganglion cells affection occurs early in the course of MS before the pRNFL thinning suggesting that the damage occurs in the cell body then spread to the axon. However, we found that both GCLC and pRNFL thicknesses were affected in early non-disabled patients with MS [43]. Coric et al. reported that the GCLC as well as the pRNFL thickness is correlated with the degree of cognitive impairment in patients with MS without previous history of ON; we did not tested OCT parameters in relation to cognitive functions as it was tested before [44]. They suggested that OCT is a helpful tool in assessment of the degree of degeneration of the central nervous system in MS patients. ON has its own effect on the OCT parameters with masking effect on the degree of thinning caused by the MS itself [44]. The GCLC thickness was considered by Saidha et al. as a useful parameter in monitoring of progressive MS. They found that the ganglion cell layer thickness and the gray matter as well as whole brain atrophy are correlated in progressive MS. Our study added that the GCLC thick-ness can be considered also as a monitoring tool in early stages of MS in fullambulatorypatients [45].
As regard VEP, the P100 latency reflects the conduct-ivity of the optic nerve axons which is directly related to the integrity of the myelin sheaths of the nerve; however, the N75/P100 amplitude reflects the functional integrity of the axons itself especially if associated with reduction of the area under the curve [8, 13]. The P100 latency was prolonged in patients with MS who suffered previ-ous episodes of ON and usually persist for many years [46]. In our study, we found that both P100 latency and N75/P100 amplitude were significantly affected not only in all included patients with MS, but also in non-disabled patients. The results of our study were similar to many previous ones [15, 47–49]. Although both pa-rameters were sensitive in non-disabled patients with MS, it was not strictly correlated with the degree of early disability.
Permanent disability in patients with MS is considered to be a direct result of axonal damage and brain volume
measured by many tools used for quantification of dis-ability including EDSS [25, 37]. Moreover, direct correl-ation between pRNFL thickness and disease durcorrel-ation and functional impairment in EDSS were found in other studies [49,50] and was in agreement with our results.
Conclusions
Both OCT and VEP examinations of patients with MS are fast, safe, non-invasive, and relatively inexpensive tools for assessment of the degree of axonal loss and hence the disability in non-disabled ambulatory patients. Moreover, the pRNFL thickness was a sensitive measure that is significantly sensitive to varying degrees of dis-ability even in ambulatory patients in early stages of MS and may be a useful future objective measurement tool taken as a biomarker of disease progression and of the response to immunomodulatory therapy of MS.
Limitations of the study
The limitations of our study include the small sample size of each patient group. Moreover, this study included patients with relapsing-remitting rather than progressive MS subtypes which may impact the interpretation and the generalization of the results of our study to the vari-ous patients with MS. However, this could be explained by the special sample of early ambulatory patients who did not yet suffered the aggressive levels of disability found in progressive MS subtypes either primary or sec-ondary. Future studies of larger homogeneous samples of patients including the various subtypes of MS are still needed for further assessments of axonal damage of MS by easy, non-invasive, widely available, and inexpensive objective tools.
Acknowledgments
We would like to thank all who helped us in this work especially our colleagues including Dr Mohamed Tarek, Dr Ahmad El-shanhory for their help and support in this research.
Prior presentation
Part of this work was presented as poster presentation in the World Congress of Neurology, Dubai, 2019, UAE.
Authors’contributions
MF analyzed and interpreted the optical coherence tomography related data of the patients and controls. MT, MA, and AB analyzed and interpreted visual-evoked potentials and demographic data of the patients and controls. All authors participated in writing the manuscript, and all authors read and approved the final manuscript.
Funding
This research received no specific grant from any funding agency in public, commercial, or non-profit sectors.
Availability of data and materials
Ethics approval and consent to participate
All study participants signed an informed written consent, and the study protocol was approved by the local ethics committee of Sohag University Hospital.
Consent for publication
This manuscript does not contain any individual person’s data in any form, including individual details, images, or videos.
Competing interests
None of the authors has any financial conflict of interest relating to this manuscript.
Author details
1Department of Neurology, Sohag University Hospital, Sohag University, Madinat Nasser, Sohag 82524, Egypt.2Department of Ophthalmology, Sohag Faculty of Medicine, Sohag University, Sohag, Egypt.
Received: 11 May 2020 Accepted: 22 June 2020
References
1. Browne P, Chandraratna D, Angood C, Tremlett H, Baker C, Taylor BV, et al. Atlas of multiple sclerosis 2013: a growing global problem with widespread inequity. Neurology. 2014;83(11):1022–4.
2. Hunter SF. Overview and diagnosis of multiple sclerosis. Am J Manag Care. 2016;22(6 Suppl):s141–50.
3. Massey JC, Sutton IJ, Ma DDF, Moore JJ. Regenerating immunotolerance in multiple sclerosis with autologous hematopoietic stem cell transplant. Front Immunol. 2018;9:410.
4. Satue M, Obis J, Rodrigo MJ, Otin S, Fuertes MI, Vilades E, et al. Optical coherence tomography as a biomarker for diagnosis, progression, and prognosis of neurodegenerative diseases. J Ophthalmol. 2016;2016:8503859. 5. El-Tallawy HN, Farghaly WM, Badry R, Metwally NA, Shehata GA, Rageh TA,
et al. Prevalence of multiple sclerosis in Al Quseir city, Red Sea Governorate, Egypt. Neuropsychiatr Dis Treat. 2016;12:155–8.
6. Collaborators GBDMS. Global, regional, and national burden of multiple sclerosis 1990-2016: a systematic analysis for the Global Burden of Disease Study 2016. Lancet Neurol. 2019;18(3):269–85.
7. Lambe J, Murphy OC, Saidha S. Can optical coherence tomography be used to guide treatment decisions in adult or pediatric multiple sclerosis? Curr Treat Options Neurol. 2018;20(4):9.
8. Narayanan D, Cheng H, Tang RA, Frishman LJ. Longitudinal evaluation of visual function in multiple sclerosis. Optom Vis Sci. 2015;92(10):976–85. 9. Manogaran P, Vavasour IM, Lange AP, Zhao Y, McMullen K, Rauscher A, et al.
Quantifying visual pathway axonal and myelin loss in multiple sclerosis and neuromyelitis optica. Neuroimage Clin. 2016;11:743–50.
10. Gordon-Lipkin E, Calabresi PA. Optical coherence tomography: a quantitative tool to measure neurodegeneration and facilitate testing of novel treatments for tissue protection in multiple sclerosis. J Neuroimmunol. 2017;304:93–6.
11. Hardmeier M, Leocani L, Fuhr P. A new role for evoked potentials in MS? Repurposing evoked potentials as biomarkers for clinical trials in MS. Mult Scler. 2017;23(10):1309–19.
12. Kiiski HS, Ni Riada S, Lalor EC, Goncalves NR, Nolan H, Whelan R, et al. Delayed P100-like latencies in multiple sclerosis: a preliminary investigation using visual evoked spread spectrum analysis. PLoS One. 2016;11(1): e0146084.
13. Janaky M, Janossy A, Horvath G, Benedek G, Braunitzer G. VEP and PERG in patients with multiple sclerosis, with and without a history of optic neuritis. Doc Ophthalmol. 2017;134(3):185–93.
14. Manogaran P, Hanson JV, Olbert ED, Egger C, Wicki C, Gerth-Kahlert C, et al. Optical coherence tomography and magnetic resonance imaging in multiple sclerosis and neuromyelitis optica spectrum disorder. Int J Mol Sci. 2016;17(11).
15. Parisi V, Manni G, Spadaro M, Colacino G, Restuccia R, Marchi S, et al. Correlation between morphological and functional retinal impairment in multiple sclerosis patients. Invest Ophthalmol Vis Sci. 1999;40(11):2520–7. 16. Alonso R, Gonzalez-Moron D, Garcea O. Optical coherence tomography as a
biomarker of neurodegeneration in multiple sclerosis: a review. Mult Scler Relat Disord. 2018;22:77–82.
17. Martinez-Lapiscina EH, Sepulveda M, Torres-Torres R, Alba-Arbalat S, Llufriu S, Blanco Y, et al. Usefulness of optical coherence tomography to distinguish optic neuritis associated with AQP4 or MOG in neuromyelitis optica spectrum disorders. Ther Adv Neurol Disord. 2016;9(5):436–40. 18. Thompson AJ, Banwell BL, Barkhof F, Carroll WM, Coetzee T, Comi G, et al.
Diagnosis of multiple sclerosis: 2017 revisions of the McDonald criteria. Lancet Neurol. 2018;17(2):162–73.
19. Henderson AP, Trip SA, Schlottmann PG, Altmann DR, Garway-Heath DF, Plant GT, et al. An investigation of the retinal nerve fibre layer in progressive multiple sclerosis using optical coherence tomography. Brain. 2008;131(Pt 1):277–87.
20. Gabilondo I, Sepulveda M, Ortiz-Perez S, Fraga-Pumar E, Martinez-Lapiscina EH, Llufriu S, et al. Retrograde retinal damage after acute optic tract lesion in MS. J Neurol Neurosurg Psychiatry. 2013;84(7):824–6.
21. Manogaran P, Samardzija M, Schad AN, Wicki CA, Walker-Egger C, Rudin M, et al. Retinal pathology in experimental optic neuritis is characterized by retrograde degeneration and gliosis. Acta Neuropathol Commun. 2019;7(1): 116.
22. Kurtzke JF. Rating neurologic impairment in multiple sclerosis: an expanded disability status scale (EDSS). Neurology. 1983;33(11):1444–52.
23. Odom JV, Bach M, Brigell M, Holder GE, McCulloch DL, Mizota A, et al. ISCEV standard for clinical visual evoked potentials: (2016 update). Doc
Ophthalmol. 2016;133(1):1–9.
24. Frohman E, Costello F, Zivadinov R, Stuve O, Conger A, Winslow H, et al. Optical coherence tomography in multiple sclerosis. Lancet Neurol. 2006; 5(10):853–63.
25. Kalkers NF, Bergers E, Castelijns JA, van Walderveen MA, Bot JC, Ader HJ, et al. Optimizing the association between disability and biological markers in MS. Neurology. 2001;57(7):1253–8.
26. Trapp BD, Peterson J, Ransohoff RM, Rudick R, Mork S, Bo L. Axonal transection in the lesions of multiple sclerosis. N Engl J Med. 1998;338(5): 278–85.
27. Graham EC, You Y, Yiannikas C, Garrick R, Parratt J, Barnett MH, et al. Progressive loss of retinal ganglion cells and axons in nonoptic neuritis eyes in multiple sclerosis: a longitudinal optical coherence tomography study. Invest Ophthalmol Vis Sci. 2016;57(4):2311–7.
28. Balk LJ, Cruz-Herranz A, Albrecht P, Arnow S, Gelfand JM, Tewarie P, et al. Timing of retinal neuronal and axonal loss in MS: a longitudinal OCT study. J Neurol. 2016;263(7):1323–31.
29. Costello F, Coupland S, Hodge W, Lorello GR, Koroluk J, Pan YI, et al. Quantifying axonal loss after optic neuritis with optical coherence tomography. Ann Neurol. 2006;59(6):963–9.
30. Klistorner A, Sriram P, Vootakuru N, Wang C, Barnett MH, Garrick R, et al. Axonal loss of retinal neurons in multiple sclerosis associated with optic radiation lesions. Neurology. 2014;82(24):2165–72.
31. Imitola J, Chitnis T, Khoury SJ. Insights into the molecular pathogenesis of progression in multiple sclerosis: potential implications for future therapies. Arch Neurol. 2006;63(1):25–33.
32. Noval S, Contreras I, Munoz S, Oreja-Guevara C, Manzano B, Rebolleda G. Optical coherence tomography in multiple sclerosis and neuromyelitis optica: an update. Mult Scler Int. 2011;2011:472790.
33. Gelfand JM, Goodin DS, Boscardin WJ, Nolan R, Cuneo A, Green AJ. Retinal axonal loss begins early in the course of multiple sclerosis and is similar between progressive phenotypes. PLoS One. 2012;7(5):e36847.
34. Rath EZ, Rehany U, Linn S, Rumelt S. Correlation between optic disc atrophy and aetiology: anterior ischaemic optic neuropathy vs optic neuritis. Eye (Lond). 2003;17(9):1019–24.
35. Siger M, Dziegielewski K, Jasek L, Bieniek M, Nicpan A, Nawrocki J, et al. Optical coherence tomography in multiple sclerosis: thickness of the retinal nerve fiber layer as a potential measure of axonal loss and brain atrophy. J Neurol. 2008;255(10):1555–60.
36. Costello F, Hodge W, Pan YI, Eggenberger E, Freedman MS. Using retinal architecture to help characterize multiple sclerosis patients. Can J Ophthalmol. 2010;45(5):520–6.
37. Sepulcre J, Murie-Fernandez M, Salinas-Alaman A, Garcia-Layana A, Bejarano B, Villoslada P. Diagnostic accuracy of retinal abnormalities in predicting disease activity in MS. Neurology. 2007;68(18):1488–94.
39. Naismith RT, Tutlam NT, Xu J, Klawiter EC, Shepherd J, Trinkaus K, et al. Optical coherence tomography differs in neuromyelitis optica compared with multiple sclerosis. Neurology. 2009;72(12):1077–82.
40. Pueyo V, Ara JR, Almarcegui C, Martin J, Guerri N, Garcia E, et al. Sub-clinical atrophy of the retinal nerve fibre layer in multiple sclerosis. Acta Ophthalmol. 2010;88(7):748–52.
41. Siepman TA, Bettink-Remeijer MW, Hintzen RQ. Retinal nerve fiber layer thickness in subgroups of multiple sclerosis, measured by optical coherence tomography and scanning laser polarimetry. J Neurol. 2010;257(10):1654–60. 42. Birkeldh U, Manouchehrinia A, Hietala MA, Hillert J, Olsson T, Piehl F, et al.
The temporal retinal nerve fiber layer thickness is the most important optical coherence tomography estimate in multiple sclerosis. Front Neurol. 2017;8:675.
43. Pietroboni AM, Dell'Arti L, Caprioli M, Scarioni M, Carandini T, Arighi A, et al. The loss of macular ganglion cells begins from the early stages of disease and correlates with brain atrophy in multiple sclerosis patients. Mult Scler. 2019;25(1):31–8.
44. Coric D, Balk LJ, Verrijp M, Eijlers A, Schoonheim MM, Killestein J, et al. Cognitive impairment in patients with multiple sclerosis is associated with atrophy of the inner retinal layers. Mult Scler. 2018;24(2):158–66. 45. Saidha S, Al-Louzi O, Ratchford JN, Bhargava P, Oh J, Newsome SD, et al.
Optical coherence tomography reflects brain atrophy in multiple sclerosis: a four-year study. Ann Neurol. 2015;78(5):801–13.
46. Halliday AM. Visual evoked potentials in demyelinating disease. Adv Neurol. 1981;31:201–15.
47. Weinstock-Guttman B, Baier M, Stockton R, Weinstock A, Justinger T, Munschauer F, et al. Pattern reversal visual evoked potentials as a measure of visual pathway pathology in multiple sclerosis. Mult Scler. 2003;9(5):529– 34.
48. Trip SA, Schlottmann PG, Jones SJ, Altmann DR, Garway-Heath DF, Thompson AJ, et al. Retinal nerve fiber layer axonal loss and visual dysfunction in optic neuritis. Ann Neurol. 2005;58(3):383–91.
49. Pueyo V, Martin J, Fernandez J, Almarcegui C, Ara J, Egea C, et al. Axonal loss in the retinal nerve fiber layer in patients with multiple sclerosis. Mult Scler. 2008;14(5):609–14.
50. Fisher JB, Jacobs DA, Markowitz CE, Galetta SL, Volpe NJ, Nano-Schiavi ML, et al. Relation of visual function to retinal nerve fiber layer thickness in multiple sclerosis. Ophthalmology. 2006;113(2):324–32.
Publisher’s Note