R E V I E W
Open Access
A systematic review of the evidence for Canada
’
s
Physical Activity Guidelines for Adults
Darren ER Warburton
1,2*, Sarah Charlesworth
1,2, Adam Ivey
1,2, Lindsay Nettlefold
1,2, Shannon SD Bredin
3Abstract
This systematic review examines critically the scientific basis for
Canada
’
s Physical Activity Guide for Healthy Active
Living
for adults. Particular reference is given to the dose-response relationship between physical activity and
pre-mature all-cause mortality and seven chronic diseases (cardiovascular disease, stroke, hypertension, colon cancer,
breast cancer, type 2 diabetes (diabetes mellitus) and osteoporosis). The strength of the relationship between
phy-sical activity and specific health outcomes is evaluated critically. Literature was obtained through searching
electro-nic databases (e.g., MEDLINE, EMBASE), cross-referencing, and through the authors
’
knowledge of the area. For
inclusion in our systematic review articles must have at least 3 levels of physical activity and the concomitant risk
for each chronic disease. The quality of included studies was appraised using a modified Downs and Black tool.
Through this search we identified a total of 254 articles that met the eligibility criteria related to premature
all-cause mortality (N = 70), cardiovascular disease (N = 49), stroke (N = 25), hypertension (N = 12), colon cancer (N =
33), breast cancer (N = 43), type 2 diabetes (N = 20), and osteoporosis (N = 2). Overall, the current literature
sup-ports clearly the dose-response relationship between physical activity and the seven chronic conditions identified.
Moreover, higher levels of physical activity reduce the risk for premature all-cause mortality. The current Canadian
guidelines appear to be appropriate to reduce the risk for the seven chronic conditions identified above and
all-cause mortality.
Introduction
There is considerable literature supporting the
impor-tance of habitual physical activity in the primary and
secondary prevention of varied chronic conditions
[1-16]. Routine physical activity is thought to be of
ben-efit for over 25 chronic conditions [17]. Seven chronic
diseases in particular have been associated with a
physi-cally inactive lifestyle including coronary artery disease,
stroke, hypertension, colon cancer, breast cancer, type 2
diabetes (diabetes mellitus) and osteoporosis [18-20].
Canada has played a leading role in the development
of physical activity guidelines for individuals across the
lifespan. This includes the development (in 1998) of
“
Canada
’
s Physical Activity Guide to Healthy Active
Liv-ing
”
for adults between the ages of 20 and 55 yr [21],
which was followed by
“
Canada
’
s Physical Activity
Guide to Healthy Active Living for Older Adults
”
[22],
and
“
Canada
’
s Physical Activity Guide to Healthy Active
Living for Children and Youth
”
[23]. The adult
guidelines (which are now approximately 10 years old)
state generally that 20-55 yr adults should accumulate
60 min of daily physical activity or 30 min of moderate
to vigorous exercise on at least 4 days a week [18,19].
We reported recently that Canada
’
s adult guidelines
were consistent with other international guidelines and
were supported by a compelling body of literature
[18,19]. We revealed strong evidence that routine
physi-cal activity was effective in the primary prevention of
car-diovascular disease, stroke, hypertension, breast cancer,
colon cancer, type 2 diabetes and osteoporosis.
More-over, physical activity appears to play an important role
in the prevention of obesity and obesity-related
co-mor-bidities. However, implicit in the adult guidelines is the
belief that there is a dose-response relationship between
physical activity and the associated health benefits.
More-over, a central belief in these guidelines and most
inter-national physical activity guidelines is that the
dose-response relationship is curvilinear with the greatest
health benefits seen in physically inactive individuals who
become
“
more physically active.
”
In fact, a consistent
pat-tern (shown in Figure 1) has been hypothesized, wherein
* Correspondence: [email protected]1Cardiovascular Physiology and Rehabilitation Laboratory, University of British Columbia, Vancouver, Canada
there are marked changes in health status with relatively
minor increments in physical activity/fitness in
indivi-duals that are the least active/fit. Generally, the health
benefits have been thought to level off at the upper end
of the physical activity/fitness continuum (Figure 1).
However, recent work (such as that provided by Gledhill
and Jamnik in the Canadian Physical Activity and
Life-style Approach) has speculated that there are likely
mul-tiple dose-response curves for various endpoints [24].
The primary purpose of this systematic review was to
examine critically the current literature to determine
whether or not a dose-response relationship exists
between habitual physical activity and chronic disease.
In particular, we sought to determine whether the key
messaging
“
Every little bit counts, but more is even
bet-ter - everyone can do it!
”
of the adult physical activity
guidelines is supported by a strong body of evidence.
Due to the breadth of literature, we have chosen to
focus on the relationship between physical activity and
all-cause mortality, and the seven chronic conditions
that are thought to be reduced greatly with habitual
physical activity (i.e., cardiovascular disease (excluding
stroke), stroke, hypertension, colon cancer, breast
can-cer, type 2 diabetes and osteoporosis) (see Table 1).
Owing to the nature of the physical activity guidelines,
the emphasis of this paper was on primary prevention,
despite the clear evidence that routine physical activity
is also an effective secondary preventative strategy
against many chronic conditions [16,18,19]. Accordingly,
our primary objectives were to examine the evidence for
a dose-response relationship between: 1) physical
activ-ity and all-cause mortalactiv-ity, and 2) physical activactiv-ity and
incidence of the following chronic conditions
(cardiovas-cular disease (except stroke), stroke, hypertension, type
2 diabetes, colon cancer, breast cancer, and osteoporosis.
Methods
Criteria for considering studies for this review
Our research team utilized a rigorous, systematic, and
evidence-based approach to examine critically the levels
of evidence on physical activity and the risk for
prema-ture mortality and chronic disease. Any studies that
evaluated the relationship between at least
three
differ-ent levels of physical activity and mortality or incidence
of chronic disease were eligible for inclusion. Therefore,
excluded studies included those that examined only the
most active versus least active populations (e.g.,
seden-tary/inactive vs. physically active). Any form of physical
activity/exercise measurement (e.g., self-report,
ped-ometer, accelerped-ometer, maximal aerobic power (VO
2max)) was eligible for inclusion. The key outcomes were
mortality and incidence of chronic disease. Only
pub-lished, English language studies examining adults (e.g.,
19-65 yr) were included. Participants must have
pre-viously been healthy (asymptomatic) adults without
established chronic disease. There was no restriction
according to study design.
To examine the relative risk reductions associated
with physical activity, we calculated the mean and
med-ian risk reductions across studies focusing on the
high-est level versus the lowhigh-est level of physical activity/
fitness. For each study we also determined whether or
not a dose-response relationship was present (i.e.,
reflecting a progressive decrease in the risk with
increas-ing physical activity/fitness levels).
Search strategy
Literature searches were conducted in the following
electronic bibliographical databases:
•
MEDLINE (1950-March 2008, OVID Interface);
•
EMBASE (1980- March 2008, OVID Interface),
•
CINAHL (1982- March 2008, OVID Interface);
Inactive/Unfit Active/FitLow
Relative Risk of Chronic Disease
High
Figure 1Theoretical relationship between the risk for chronic disease and physical activity/fitness.
Table 1 Relative risks (RR) and population attributable
risks (PAR%) for physical inactivity in Canada, Australia,
and the USA.
Canada Australia USA Disease RR PAR% RR PAR% RR PAR%
CHD 1.45 19.4 1.5 18 2.0 22
Stroke 1.60 24.3 2.0 16 na Na
Hypertension 1.30 13.8 na na 1.5 12
Colon Cancer 1.41 18.0 1.5 19 2.0 22
Breast Cancer 1.31 14.2 1.1 9 1.2 5
Type 2 Diabetes 1.50 21.1 1.3 13 1.5 12
Osteoporosis 1.59 24.0 1.4* 18* 2.0 18*
•
PsycINFO (1840- March 2008, Scholars Portal
Interface);
•
Cochrane Library (-March 2008),
•
SPORTDiscus (-March 2008).
The Medical Subject Headings (MeSH) were kept
broad. See tables 2, 3, 4, 5, 6, 7, 8 and 9 for the
com-plete search strategy and keywords used. The electronic
search strategies were created and carried out by
researchers experienced with systematic reviews of the
literature (DW and LN). The citations and applicable
electronic versions of the article (where available) were
downloaded to an online research management system
(RefWorks, Bethesda, Maryland, USA).
Screening
Two reviewers (LN and SC) screened independently the
title and abstract of the citations to identify potential
articles for inclusion. Duplicate citations were removed.
The reviewers were not blinded to the authors or
jour-nals. Biographies of key studies and reviews in the field
were also cross-referenced for further articles. For those
articles that appeared relevant, the full text was
obtained and data was extracted using a common
tem-plate. In cases of disagreement, discussion with a third
reviewer (DW) was used to achieve consensus. Full
(100%) consensus was achieved. All studies that were
excluded during the citation and full-article screening
processes were recorded along with the reasons for
exclusion.
Table 2 Results of the MEDLINE literature search
regarding all-cause mortality.
# Searches (28 Feb 2008) Results
1 exp Physical Fitness/ 15236
2 Motor Activity/ 49721
3 exp Physical Endurance/ 15383
4 exp Exercise/ 57742
5 exp Exertion/ 88903
6 exp Sports/ 71887
7 exp exercise therapy/ 17231
8 exp exercise tolerance/ 4192
9 exp health behaviour/ 59409
10 leisure time physical activity.mp 996 11 occupational physical activity.mp 190
12 exp Pliability/ 2279
13 exp Muscle Strength/ 5717
14 musc$ power.mp 965
15 exp Back/ 12821
16 1 or 2 or 3 or 4 or 5 or 6 or 7 or 8 or 9 or 10 or 11 or 12 or 13 or 14 or 15
291635
17 dose-response.mp 321066
18 intensity.mp 142881
19 volume.mp 298471
20 exp Energy Metabolism/ 206808
21 exp oxygen consumption/ 83352
22 exp time factors/ 763712
23 17 or 18 or 19 or 20 or 21 or 22 1651633
24 16 and 23 67698
25 exp Mortality/ 190058
26 all cause mortality.mp 4618
27 25 or 26 192720
28 24 and 27 421
29 limit 28 to (english and humans and“all adult (19 plus years)”)
279
Table 3 Results of the MEDLINE literature search
regarding cardiovascular disease.
Search #
Searches (3 Mar 2008) Results
1 exp Physical Fitness/ 15244
2 Motor Activity/ 49751
3 exp Physical Endurance/ 15408
4 exp Exercise/ 57806
5 exp Exertion/ 88967
6 exp Sports/ 71931
7 exp exercise therapy/ 17243
8 exp exercise tolerance/ 4205
9 exp health behaviour/ 59467
10 leisure time physical activity.mp 998 11 occupational physical activity.mp 191
12 exp Pliability/ 2289
13 exp Muscle Strength/ 5731
14 musc$ power.mp 965
15 exp Back/ 12822
16 1 or 2 or 3 or 4 or 5 or 6 or 7 or 8 or 9 or 10 or 11 or 12 or 13 or 14 or 15
291817
17 dose-response.mp 321198
18 intensity.mp 142955
19 volume.mp 298620
20 exp Energy Metabolism/ 206886
21 exp oxygen consumption/ 83387
22 exp time factors/ 764091
23 17 or 18 or 19 or 20 or 21 or 22 1652372
24 16 and 23 67760
25 exp Cardiovascular Diseases/ 1411730
26 exp Heart diseases/ 675083
27 exp Myocardial infarction/ 116070
28 exp Death, Sudden Cardiac/ 6772
29 exp Coronary Artery Disease/ 18137
30 exp Coronary Disease/ 144236
31 exp Vascular Diseases 1018275
32 25 or 26 or 27 or 28 or 29 or 30 or 31 1411730
33 24 and 32 9603
34 limit 33 to (english language and humans and“all adult (19 plus years)”)
Data Extraction
Two reviewers (LN and SC) completed standardized
data extraction forms, which were verified by two other
reviewers (DW and SB). We extracted information
regarding the study design, the country where the study
was conducted, the participant characteristics, the
sam-ple size, the objectives of the study, the methodologies
employed, the major outcomes (i.e., mortality, incidence
of chronic disease, physical activity levels/classifications),
and the comments and conclusions made based on the
findings of the study. The reviewers were not blinded to
the journal or the author names when extracting
infor-mation from the articles.
Level of Evidence
The approach used to establish the level and grade of
evidence was consistent with that used during creation
of the
“
Canadian clinical practice guidelines on the
management and prevention of obesity in adults and
children
”
[25]. The level of evidence provides
informa-tion regarding the strength of the evidence in favour of
physical activity/exercise in the primary prevention of
premature mortality and the seven chronic diseases of
primary interest. This evaluation process is based on a
pre-defined and objective criteria (see Table 10).
The grade for each article provides information
regarding whether physical activity is effective in the
pri-mary prevention of the varied conditions evaluated
(Table 10). Where applicable this grade informs the
reader about the potential risk of the physical activity. A
study that receives the highest grading would indicate
Table 4 Results of the MEDLINE literature search
regarding stroke.
Search #
Searches (29 Feb 2008) Results
1 exp Physical Fitness/ 15241
2 Motor Activity/ 49744
3 exp Physical Endurance/ 15387
4 exp Exercise/ 57764
5 exp Exertion/ 88921
6 exp Sports/ 71907
7 exp exercise therapy/ 17237
8 exp exercise tolerance/ 4196
9 exp health behaviour/ 59430
10 leisure time physical activity.mp 996 11 occupational physical activity.mp 190
12 exp Pliability/ 2288
13 exp Muscle Strength/ 5720
14 musc$ power.mp 965
15 exp Back/ 12821
16 1 or 2 or 3 or 4 or 5 or 6 or 7 or 8 or 9 or 10 or 11 or 12 or 13 or 14 or 15
291718
17 dose-response.mp 321133
18 intensity.mp 142919
19 volume.mp 298526
20 exp Energy Metabolism/ 206837
21 exp oxygen consumption/ 83359
22 exp time factors/ 763871
23 17 or 18 or 19 or 20 or 21 or 22 1651958
24 16 and 23 67720
25 exp Stroke/ 45243
26 exp Cerebrovascular Disorders/ 196243
27 exp Brain Ischemia/ 58943
28 exp Brain Infarction/ or exp Cerebral Infarction 21357 29 exp Infarction, Middle Cerebral Artery/ or exp
Intracranial Aneurysm/ or exp Subarachnoid
46725
30 Hemorrhage/ or exp Cerebral Hemorrhage/exp Ischemic Attack, Transient/
14753
31 25 or 26 or 27 or 28 or 29 or 30 196243
32 24 and 31 692
33 limit 32 to (english language and humans and“all adult (19 plus years)”)
291
Table 5 Results of the MEDLINE literature search
regarding hypertension.
Search #
Searches (3 Mar 2008) Results
1 exp Physical Fitness/ 15244
2 Motor Activity/ 49751
3 exp Physical Endurance/ 15408
4 exp Exercise/ 57806
5 exp Exertion/ 88967
6 exp Sports/ 71931
7 exp exercise therapy/ 17243
8 exp exercise tolerance/ 4205
9 exp health behaviour/ 59467
10 leisure time physical activity.mp 998 11 occupational physical activity.mp 191
12 exp Pliability/ 2289
13 exp Muscle Strength/ 5731
14 musc$ power.mp 965
15 exp Back/ 12822
16 1 or 2 or 3 or 4 or 5 or 6 or 7 or 8 or 9 or 10 or 11 or 12 or 13 or 14 or 15
291817
17 dose-response.mp 3211987
18 intensity.mp 142955
19 volume.mp 298620
20 exp Energy Metabolism/ 206886
21 exp oxygen consumption/ 83387
22 exp time factors/ 764091
23 17 or 18 or 19 or 20 or 21 or 22 1652372
24 exp Hypertension/ 168466
25 exp Blood Pressure/ 205571
26 exp Blood Pressure Determination/ or exp Blood Pressure Monitoring, Ambulatory/ or exp Blood
18244
27 Pressure Monitors/24 or 25 or 26 336025
28 16 and 23 and 27 5647
29 limit 28 to (english language and humans and“all adult (19 plus years)”)
that the benefits clearly outweigh the risks and receive a
strong recommendation.
Quality Assessment
The quality of each study was also established using the
procedures of Gorber et al. [26]. Owing to the fact that
only observational study designs were included in our
systematic review, we used the Downs and Black [27]
scale to assess the quality of non-randomized
investiga-tions. Similar to the work of Prince et al. [28] we chose
to include the most relevant components of the scoring
tool. Therefore, a modified version of the Downs and
Black checklist was used with the final checklist
consist-ing of 15 items with a maximum score of 15 points.
Higher
points
reflected
a
superior
quality
of
investigation.
Results
Physical Inactivity and All-Cause Mortality
A total of 2040 citations were identified during the
elec-tronic database search (Figure 2). Of these citations, 288
were identified in MEDLINE, 222 in EMBASE, 496 in
Cochrane, and 1034 in the
CINAHL/SportDiscus/Psy-chInfo search. A total of 167 duplicates were found,
leaving a total of 1873 unique citations. A total of 1696
articles were excluded after scanning, leaving a total of
177 articles for full review. From these articles 130 were
excluded after full review leaving 47 articles for
inclu-sion in the systematic review. An additional 23 articles
were added to the review based on the authors
’
knowl-edge of the area. The reasons for exclusion included
review articles (n = 26), commentary (n = 10), did not
report 3 levels of physical activity (n = 24), no objective
measure of physical activity (n = 2), report (n = 15), not
a formal study (n = 11), not related to all-cause
mortal-ity (n = 27), the participants were too young (n = 1),
not able to retrieve articles (n = 7), and other (n = 7).
Therefore, a total of 70 articles were included in the
Table 6 Results of the MEDLINE literature search
regarding colon cancer.
Search #
Searches (3 Mar 2008) Results
1 exp Physical Fitness/ 15244
2 Motor Activity/ 49751
3 exp Physical Endurance/ 15408
4 exp Exercise/ 57806
5 exp Exertion/ 88967
6 exp Sports/ 71931
7 exp exercise therapy/ 17243
8 exp exercise tolerance/ 4205
9 exp health behaviour/ 59467
10 leisure time physical activity.mp 998 11 occupational physical activity.mp 191
12 exp Pliability/ 2289
13 exp Muscle Strength/ 5731
14 musc$ power.mp 965
15 exp Back/ 12822
16 1 or 2 or 3 or 4 or 5 or 6 or 7 or 8 or 9 or 10 or 11 or 12 or 13 or 14 or 15
291817
17 dose-response.mp 321198
18 intensity.mp 142955
19 volume.mp 298620
20 exp Energy Metabolism/ 206886
21 exp oxygen consumption/ 83387
22 exp time factors/ 764091
23 17 or 18 or 19 or 20 or 21 or 22 1652372
24 exp Colonic Neoplams/ 51780
25 exp Rectal Neoplasms/ 28011
26 exp Colorectal Neoplasms/ 99982
27 exp Colorectal Neoplasms/, Hereditary Nonpolyposis/ or exp Intestinal Neoplasms.
117563
28 24 or 25 or 26 or 27 117563
29 16 and 23 and 28 108
30 limit 29 to (53nglish language and humans and“all adult (19 plus years)”)
77
Table 7 Results of the MEDLINE literature search
regarding breast cancer.
Search #
Searches (28 Feb 2008) Results
1 exp Physical Fitness/ 15236
2 Motor Activity/ 49721
3 exp Physical Endurance/ 15383
4 exp Exercise/ 57742
5 exp Exertion/ 88903
6 exp Sports/ 71887
7 exp exercise therapy/ 17231
8 exp exercise tolerance/ 4192
9 exp health behaviour/ 59409
10 leisure time physical activity.mp 996 11 occupational physical activity.mp 190
12 exp Pliability/ 2279
13 exp Muscle Strength/ 5717
14 musc$ power.mp 965
15 exp Back/ 12821
16 1 or 2 or 3 or 4 or 5 or 6 or 7 or 8 or 9 or 10 or 11 or 12 or 13 or 14 or 15
291635
17 dose-response.mp 321066
18 intensity.mp 142881
19 volume.mp 298471
20 exp Energy Metabolism/ 206808
21 exp oxygen consumption/ 83352
22 exp time factors/ 763712
23 17 or 18 or 19 or 20 or 21 or 22 1651633
24 exp Breast Neoplasms/ 149817
25 16 and 23 and 24 296
26 limit 25 to (54 nglish language and humans and“all adult (19 plus years)”
systematic review of the literature regarding the
rela-tionship between physical activity and premature
mortality.
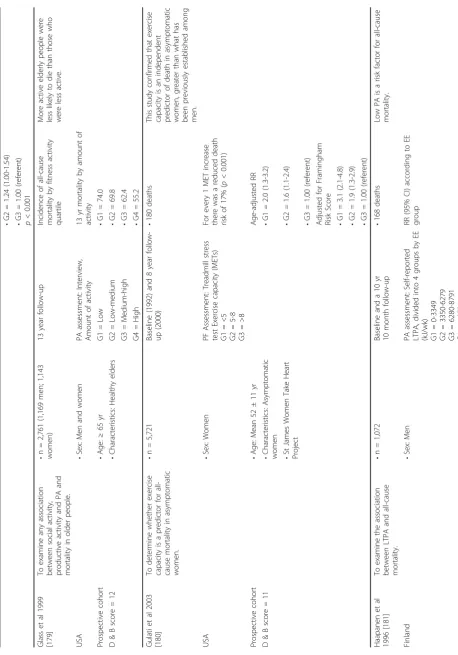
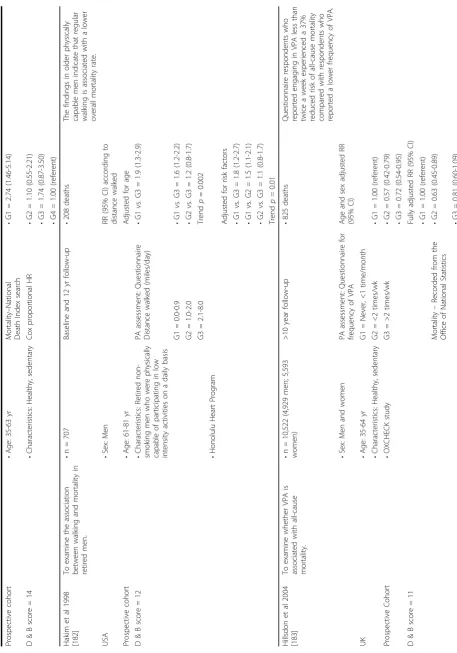
The majority of the studies included in our systematic
review were prospective cohort investigations (Table
11). These studies involved a total of 1,525,377
partici-pants; averaging 21,791 participants per study (range
302-252,925). There were a total of 111,125 reported
cases of premature all-cause mortality (ranging per
study from 43-10,952). The total length of study
follow-up for the prospective cohort studies averaged 11.1 yr
(ranging from 0.5-28 yr). The articles were published
over a 22 yr period ranging from 1985 to 2007. These
studies involved large samples of men and women from
regions throughout the world.
We observed a mean 31% lower risk for all-cause
mortal-ity in the most active individuals. The median risk
reduc-tion was 32%. It is important to highlight that many of
these studies included women, with sub-analyses that
revealed similar risk reductions between sexes. Our
find-ings are consistent with previous reports [15,16,29-31]. The
majority (90%) of the studies supported the health benefits
of physical activity demonstrating a significant risk
reduc-tion in physically active individuals.
The level of evidence
would be considered to be a Level 2A based on the presence
of overwhelming evidence from observational trials
. The
studies examined were generally of a good quality with a
mean (and median) score of 12 out of 15 (range 10-14).
Table 8 Results of the MEDLINE literature search
regarding type 2 diabetes.
Search #
Searches (29 Feb 2008) Results
1 exp Physical Fitness/ 15241
2 Motor Activity/ 49744
3 exp Physical Endurance/ 15387
4 exp Exercise/ 57764
5 exp Exertion/ 88921
6 exp Sports/ 71907
7 exp exercise therapy/ 17237
8 exp exercise tolerance/ 4196
9 exp health behaviour/ 59430
10 leisure time physical activity.mp 996 11 occupational physical activity.mp 190
12 exp Pliability/ 2288
13 exp Muscle Strength/ 5720
14 musc$ power.mp 965
15 exp Back/ 12821
16 1 or 2 or 3 or 4 or 5 or 6 or 7 or 8 or 9 or 10 or 11 or 12 or 13 or 14 or 15
291718
17 dose-response.mp 321133
18 intensity.mp 142919
19 volume.mp 298526
20 exp Energy Metabolism/ 206837
21 exp oxygen consumption/ 83359
22 exp time factors/ 763871
23 17 or 18 or 19 or 20 or 21 or 22 1651958
24 16 and 23 67720
25 exp Blood Glucose/or exp Diabetes Mellitus, Type 2/ 132583
26 exp Hyperglycemia/ 16214
27 exp Glucose Intolerance/ or exp Glucose Tolerance Test/
24986
28 exp Hyperinsulinism/ 30490
29 25 or 26 or 27 or 28 165157
30 29 and 24 3006
31 Limit 30 to (english language and humans and“all adult (19 plus years)”)
1985
Table 9 Results of the MEDLINE literature search
regarding osteoporosis.
Search #
Searches (29 feb 2008) Results
1 exp Physical Fitness/ 15241
2 Motor Activity/ 49744
3 exp Physical Endurance/ 15387
4 exp Exercise/ 57764
5 exp Exertion/ 88921
6 exp Sports/ 71907
7 exp exercise therapy/ 17237
8 exp exercise tolerance/ 4196
9 exp health behaviour/ 59430
10 leisure time physical activity.mp 996 11 occupational physical activity.mp 190
12 exp Pliability/ 2288
13 exp Muscle Strength/ 5720
14 musc$ power.mp 965
15 exp Back/ 12821
16 1 or 2 or 3 or 4 or 5 or 6 or 7 or 8 or 9 or 10 or 11 or 12 or 13 or 14 or 15
291718
17 dose-response.mp 321133
18 intensity.mp 142919
19 volume.mp 298526
20 exp Energy Metabolism/ 206837
21 exp oxygen consumption/ 83359
22 exp time factors/ 763871
23 17 or 18 or 19 or 20 or 21 or 22 1651958 24 exp Osteoporosis, Postmenopausal/ or exp
Osteoporosis/
31532
25 exp Fractures, Bone/ or exp Bone Density/ 125269 26 exp Bone Diseases/ or exp Bone Diseases,
Metabolic/
308084
27 exp“Bone and bones"/ 369634
28 exp Tensile Strength/ 12050
29 exp Compressive Strength 2838
30 24 or 25 or 26 or 27 or 28 or 29 642158
31 16 and 23 and 30 2138
32 limit 31 to (english language and humans and“all adult (19 plus years)”)
A clear dose-response relationship was also observed
with marked reductions in the risk for all-cause
mortal-ity occurring with relatively small increments in physical
activity (Figure 3). To examine more closely the
tem-poral relationship between physical activity and all-cause
mortality we calculated the (unadjusted) relative risks
associated with incremental levels of physical
activity/fit-ness using the reported cases of all-cause mortality and
the number of participants (per group) in each
investi-gation. In some instances, we were required to calculate
the number of participants based on the reported
inci-dence rates and person years, or based on data obtained
directly from the authors (2 investigations). We were
not able to obtain this information in 18 investigations,
and as such this analysis was restricted to the remaining
52 investigations. There was considerable variability in
the methods of classifying the physical activity/fitness
levels of the participants. Accordingly, Figure 3
illus-trates the mean relative risk reduction according to
three separate study types including those that
subdi-vided participants into tertiles, quartiles and quintiles,
respectively. This figure demonstrates clearly the
dose-response relationship between physical activity and
all-cause mortality. Collectively, the literature is consistent
indicating that the current Canadian guidelines
(approximately 4.2 MJ/wk, 1000 kcal/wk) are associated
with a 20-30% lower risk for premature all-cause
mor-tality, with greater health benefits with high volumes
and/or intensities of activity. In our analyses it was
apparent that the greatest differences in risk occurred
between the lowest adjacent activity/fitness categories,
suggesting that sedentary individuals can markedly
reduce their risk for all-cause mortality with relatively
minor increments in physical activity. This is consistent
with the current messaging of Canada
’
s physical activity
guidelines.
The strength of the relationship between physical
fit-ness and premature mortality has been well-established
[6,32,33]. In our analyses there were greater risk
reduc-tions in studies that took objective measures of physical
fitness. We observed an average risk reduction of
approximately 45%, which was consistent between men
and women. A risk reduction of greater than 50% was
not uncommon in these studies. For instance, Myers
et al. (2004) reported that being fit or physically active
was associated with greater than 50% lower mortality
risk in men. They also noted that a 4.2 MJ/wk (1000
kcal/wk) increase in physical activity, or a 1 metabolic
equivalent (MET) higher physical fitness level was
asso-ciated with a mortality benefit of around 20%. It is also
important to highlight that longitudinal studies
evaluat-ing changes in physical activity or fitness have revealed a
lower premature mortality risk [16,34-41]. As we
pre-viously reported, routine physical activity or elevated
physical fitness also appears to reduce the risk for
pre-mature mortality in individuals with risk factors for
chronic disease [42,43].
Implications
Since the seminal work of Morris and colleagues (in the
1950s [44,45]) and the early work of Paffenbarger (in
the 1970s [46,47]) there has been considerable research
(especially epidemiological evidence) documenting the
health benefits of engaging in routine physical activity
and/or being physically fit [17,48]. Both physical activity
Table 10 The levels and grade of evidence scaling criteria applied to the articles.
Level of Evidence Criteria
Level 1 Randomized control trials without important limitations
Level 2 •Randomized control trials with important limitations
•Observational studies (non-randomized clinical trials or cohort studies) with overwhelming evidence Level 3 Other observational studies (prospective cohort studies, case-control studies, case series)
Level 4 Inadequate or no data in population of interest Anecdotal evidence or clinical experience
Grade of Evidence Criteria
Grade A Strong recommendation (action can apply to most individuals in most circumstances) •Benefits clearly outweigh risks (or vice-versa)
•Evidence is at Level 1, 2, or 3
Grade B Weak recommendation (action may differ depending on individual’s characteristics or other circumstances) •Unclear if benefits outweigh risks
•Evidence is at Level 1, 2, or 3
Grade C Consensus recommendation (alternative actions may be equally reasonable) •Unclear if benefits outweigh risks
(a behaviour) and physical fitness (an attained state)
appear to be related to health status in a
dose-depen-dent fashion, with physical fitness demonstrating the
strongest relationship [18,19]. Numerous reports
indi-cate that physical inactivity and/or low physical fitness
are associated with an increased risk for chronic disease
and premature all-cause and disease-specific mortality
[2,43,49-51]. Some of the most compelling research
includes the relationship between physical activity/
fitness and all-cause mortality. As demonstrated below
and in Table 11 and Figure 1, this literature is extensive.
The assessment of the relationship between all-cause
mortality is complicated by the inclusion of deaths
related to suicides, homicide, and accidents [18,19,52].
Nonetheless, the available evidence is incontrovertible;
individuals who are habitually physically active and/or
physically fit are at a markedly reduced risk for
prema-ture all-cause mortality [15,16,18,19]. In Canada,
physi-cal inactivity is a major cause of premature mortality
from diseases of the cardiovascular system (33.3%),
can-cers (29.1%), and type 2 diabetes (3.5%) [53]. Globally,
physical inactivity has been linked with 2 million
prema-ture deaths per year, including 22% of cases of coronary
heart disease, and 10-16% of cases of breast cancer,
colon cancer, rectal cancer and type 2 diabetes [54]. As
such, the promotion of the health benefits of physical
activity is of paramount importance for the effective
prevention of chronic disease and premature mortality
on a national and international scale.
In summary, there is a clear dose-response
relation-ship between physical activity and premature all-cause
mortality. Physically active individuals have an
approxi-mate risk reduction of 31% in comparison to physically
inactive individuals. When objective measures of aerobic
fitness are taken the risk reductions are even greater
approximating 45%.
Recommendation #1
For a reduced risk for premature mortality, it is
recommended that individuals should participate in
30 min or more of moderate to vigorous exercise on
most days of the week. Greater health benefits appear
to occur with higher volumes and/or intensities of
activity. [Level 2, Grade A]
Primary Prevention of Cardiovascular Disease
In our systematic search of the literature, a total of 9408
citations were identified during the electronic database
search (Figure 4). Of these citations, 5973 were
identi-fied in MEDLINE, 2561 in EMBASE, 193 in Cochrane,
and 681 in the CINAHL/SportDiscus/PsychInfo search.
A total of 923 duplicates were found, leaving a total of
8485 unique citations. A total of 8138 articles were
excluded after scanning, leaving a total of 347 articles
for full review. An additional 20 articles were added
through cross-referencing. From these articles 319 were
excluded after full review leaving 33 articles for
inclu-sion in the systematic review. The reasons for excluinclu-sion
included non-experimental studies (n = 45), only effect
on cardiovascular disease risk factors (n = 115), did not
report 3 levels of physical activity (n = 12), subjects less
than 18 yr of age (n = 4), reviews, summaries,
disserta-tions, thesis, and abstracts (n = 30), clinical population
(n = 14), not on cardiovascular disease or did not fit
Figure 2 Results of the Literature Search for All-CauseTable
11
Studies
examining
the
relationship
between
physical
activity
and
all-cause
mortality.
Publica
tion
C
ountry
Stu
dy
Desig
n
Q
uality
Score
Objec
tive
Popula
tion
Method
s
Outcome
C
omme
nts
and
Co
nclusions
Blair
et
al
198
9
[7]
To
stud
y
physic
al
fitness
(PF)
and
risk
of
all-cause
m
ortality
in
men
and
wome
n.
•
n
=
13,344
(10,224
men
;
3,1
20
women
)
Basel
ine
and
8
year
follow-up
•
283
deaths
Low
level
s
o
f
P
F
increase
the
risk
for
premat
ure
mortalit
y.
•
Sex:
Men
and
wome
n
Adjusted
risk
ratio
(RR
),
95%
confidenc
e
interval
(CI)
USA
•
Age:
20->
60
years
(yr
)
PF
asses
sment:
Ma
ximal
treadm
ill
exerc
ise
tes
t.
Pros
pective
cohort
•
Characteristi
cs:
Parti
cipants
were
given
a
p
reventat
ive
Medicine
examination
includ
ing
ma
ximal
treadm
ill
exerc
ise
tes
t
Fitne
ss
catego
rized
into
quinti
les:
Men
D
&
B
score
=
12
Q1
=
least
fit
•
Q1
=
3.44
(2.05
-5.77)
Q2
•
Q2
=
1.37
(0.76
-2.50)
Q3
•
Q3
=
1.46
(0.81
-2.63)
Q4
•
Q4
=
1.17
(0.63
-2.17)
Q5
=
most
fit
•
Q5
=
1.00
(refere
nt)
Women
•
Q1
=
4.65
(2.22
-9.75)
•
Q2
=
2.42
(1.09
-5.37)
•
Q3
=
1.43
(0.60
-3.44)
•
Q4
=
0.76
(0.27
-2.11)
•
Q5
=
1.00
(refere
nt)
Mye
rs
et
al
2004
[32]
To
d
etermine
th
e
effects
of
PF
and
physic
al
activity
(PA)
on
all-cause
mortalit
y.
•
n
=
6,213
Basel
ine
and
mean
5.5
±
2.0
year
follow
-Up
•
1,256
deaths
Being
fit
or
acti
ve
is
associat
ed
w
ith
>50%
reduc
tions
in
mortalit
y
risk
.
•
Sex:
Men
USA
•
Age:
Mean
59.0
±
11.2
yr
PF
Lev
el
haz
ard
ratio
(HR)
(95%
CI)
•
Characteristi
cs:
Men
referred
for
exercise
testing
PF
asses
sment:
Treadm
ill
test
to
measure
VO
2
pea
k
•
G1
=
1.0
0
(referent)
PF
predic
ted
mort
ality
more
stro
ngly
than
PA.
Pros
pective
cohort
•
G2
=
0.5
9
(0.52-0.6
8)
•
G3
=
0.4
6
(0.39-0.5
5)
•
G4
=
0.2
8
(0.23-0.3
4)
Increasing
PA
(by
1000
kca
l/wk
or
1
MET
)
co
nfers
a
morta
lity
benefit
of
20%
.
D
&
B
score
=
12
PA
as
sessment:
Self
repor
ted
PA
divide
d
into
4
group
s
PA
Level
HR
(95%
C
I)
G1
=
Lowe
st
level
•
G1
=
1.0
0
Table
11:
Studies
examining
the
relationship
between
physical
activity
and
all-cause
mortality.
(Continued)
G2
•
G2
=
0.6
3
(0.36-1.1
0)
G3
•
G3
=
0.4
2
(0.23-0.7
8)
G4
=
Highest
level
•
G4
=
0.3
8
(0.19-0.7
3)
Blair
et
al
199
5
[36]
To
ev
aluate
th
e
relationship
betw
een
cha
nges
in
PF
and
risk
of
mort
ality
in
men
.
•
n
=
9,777
4.9
year
mean
follow
-up
•
223
deaths
Men
who
ma
intained
or
increased
ad
equate
PF
had
a
reduced
risk
for
all-cause
morta
lity
than
individuals
w
ho
were
cons
istently
unfit.
•
Sex:
Men
•
Age:
20-8
2
yr
RR
(95%
CI)
USA
•
Characteristi
cs:
Parti
cipants
were
given
a
p
reventat
ive
medicine
examination
includ
ing
ma
ximal
treadm
ill
exerc
ise
tes
t
PF
asses
sment:
Ma
ximal
exercise
test
at
ba
seline
and
follo
w-up
•
G1
=
1.0
0
(referent)
Pros
pective
cohort
•
G2
=
0.5
6
(0.41-0.7
5)
•
G3
=
0.5
2
(0.38-0.7
0)
•
G4
=
0.3
3
(0.23-0.4
7)
D
&
B
score
=
13
Gro
ups
based
on
cha
nges
in
PF
G1
=
unfit
to
unfit
G2
=
unfit
to
fit
G3
=
fit
to
unfit
G4
=
fit
to
fit
Bijnen
et
al
1999
[37]
To
exa
mine
the
asso
ciation
of
PA
at
baseline
and
5
years
•
n
=
472
198
5
and
1990
•
118
deaths
Rec
ent
levels
of
PA
were
more
impo
rtant
for
m
ortality
risk
than
PA
5
years
previo
usly.
•
Sex:
Men
•
Age:
>65
yr
PA
as
sessment:
Quest
ionnaire,
divide
d
into
tertiles:
Lowe
st
Middl
e
Highest
Multivariate
adjust
ed
RR
(95%
CI)
Net
herlands
previo
usly
with
all-cause
morta
lity
risk
in
a
cohort
of
elde
rly
Du
tch
men.
•
Characteristi
cs:
Mo
stly
independently
living
elde
rs
(~95%
)
PA
in
198
5:
Lowe
st
tertile
=
1.00
(refere
nt)
Middl
e
tertile
Ret
rospective
co
hort
•
Zutph
en
Elde
rly
Study
•
Total
activity
=
1.2
5
(0.79
-1.99)
Bec
oming
or
remainin
g
sedent
ary
increased
th
e
mortality
risk
.
D
&
B
score
=
12
•
Walking
=
0.97
(0.60
-1.57)
•
Bike
=
0.97
(0.59
-1.57)
•
Gardening
=
0.66
(0.39
-1.10)
•
Other
=
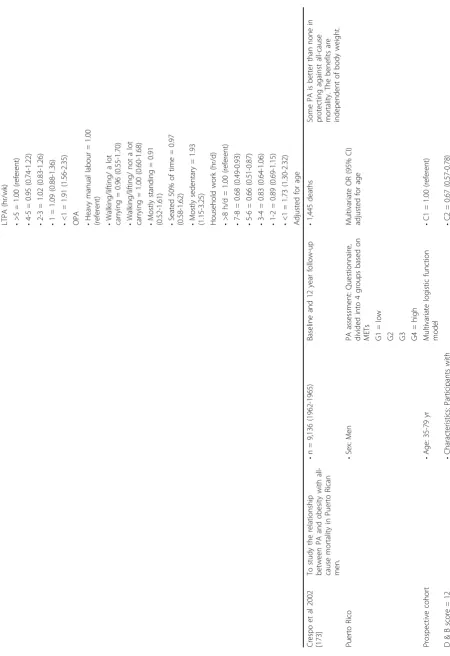
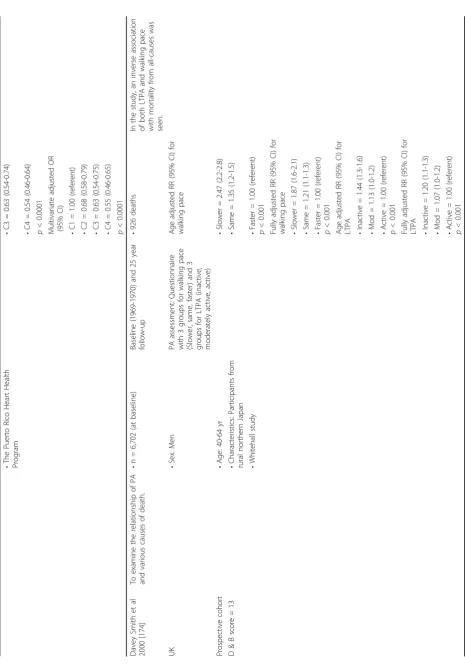
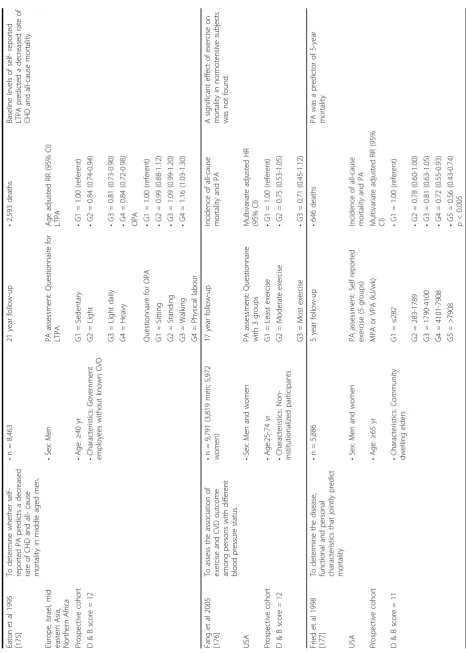
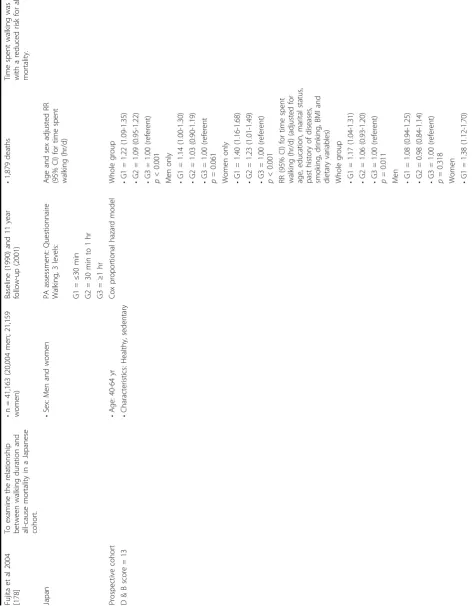
1.0
8
(0.66-1.7
8)
•
Heavy
activity
=
0.73
(0.45
-1.17)
•
Non
heavy
acti
vity
=
0.89
(0.57
Table
11:
Studies
examining
the
relationship
between
physical
activity
and
all-cause
mortality.
(Continued)
Highest
tertile
•
Total
activity
=
1.2
5
(0.73
-2.12)
•
Walking
=
0.94
(0.58
-1.55) •Bike
=
1.07
(0.61
-1.88)
•
Gardening
=
0.77
(0.42-1.39) •Other
=
1.2
4
(0.74-2.0
7)
•
Heavy
activity
=
0.76
(0.44
-1.32)
•
Non
heavy
acti
vity
=
0.94
(0.58
-1.53)
PA
in
199
0:
Lowest
tertile
=
1.00
(referent) Middle
tertile
•
Total
activity
=
0.5
6
(0.35
-0.89)
•
Walking
=
0.82
(0.51
-1.32) •Bike
=
0.49
(0.29
-0.82)
•
Gardening
=
1.67
(1.00-2.79) •Other
=
0.9
3
(0.53-1.6
5)
•
Heavy
activity
=
1.19
(0.73
-1.92)
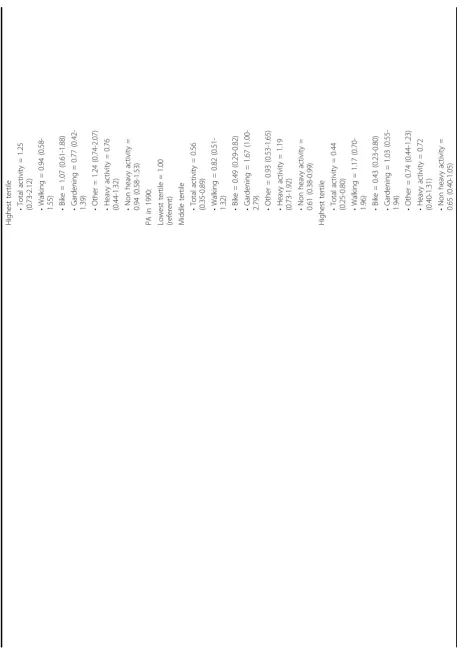
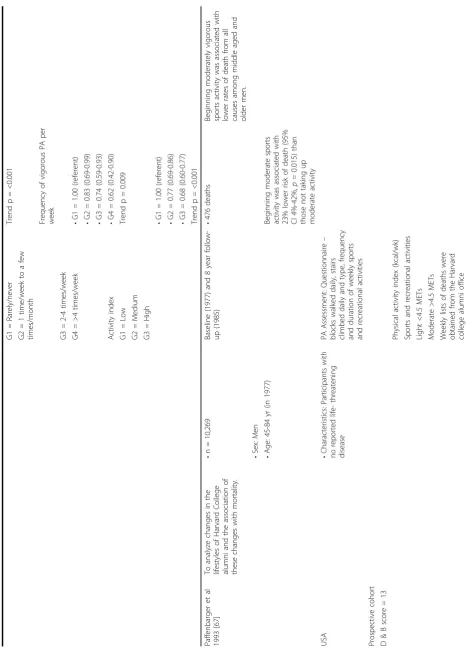
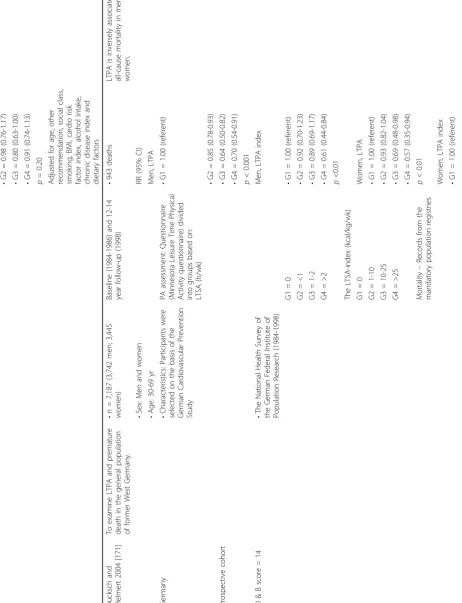
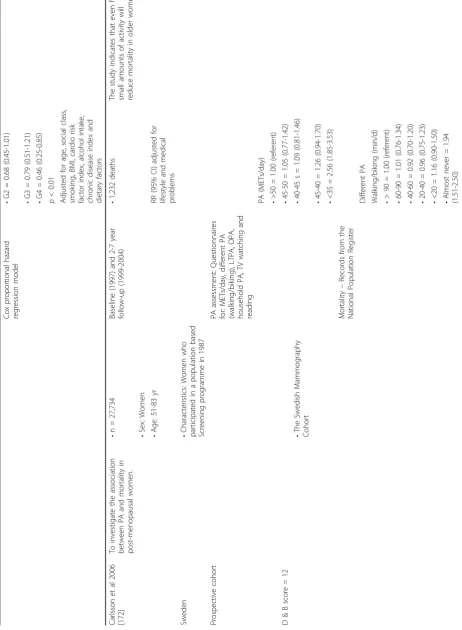
•
Non
heavy
acti
vity
=
0.61
(0.38
-0.99)
Highest
tertile
•
Total
activity
=
0.4
4
(0.25
-0.80)
•
Walking
=
1.17
(0.70
-1.96) •Bike
=
0.43
(0.23
-0.80)
•
Gardening
=
1.03
(0.55-1.94) •Other
=
0.7
4
(0.44-1.2
3)
•
Heavy
activity
=
0.72
(0.40
-1.31)
•
Non
heavy
acti
vity
=
0.65
(0.40
Table
11:
Studies
examining
the
relationship
between
physical
activity
and
all-cause
mortality.
(Continued)
Gregg
et
al
200
3
[39]
To
exa
mine
the
relat
ionship
of
change
s
in
PA
and
mortalit
y
among
older
wome
n.
•
n
=
9,518
Basel
ine
(1986
-1988)
and
medi
an
10.6
year
follo
w-up
(1992
-1994)
•
2,218
deaths
Increasing
and
maintain
ing
PA
level
s
could
lengthe
n
life
for
old
er
w
omen
b
ut
appea
rs
to
provide
less
ben
efit
for
wome
n
ag
ed
at
least
75
years
and
thos
e
with
poor
he
alth
stat
us.
•
Sex:
Women
PA
A
ssessmen
t:
Quest
ionnaire,
divide
d
into
quinti
les
of
PA
(kcal/
wk)
•
Age:
≥
65
yr
Multivariate
adjust
ed
HRR
USA
•
Characteristi
cs:
Whi
te
comm
unity
dwellin
g
participan
ts
from
4
US
research
cent
res
(95%
CI):
Quintile
s
of
total
Q1=
<16
3
PA
Pros
pective
cohort
Q2
=
163-503
•
Q1
=
1.00
(refere
nt)
Q3
=
504-104
5
•
Q2
=
0.73
(0.64
-0.82)
Q4
=
1046-19
06
•
Q3
=
0.77
(0.68
-0.87)
D
&
B
score
=
13
Q5
=
≥
190
7
•
Q4
=
0.62
(0.54
-0.71)
•
Q5
=
0.68
(0.59
-0.78)
Walking
HRR
(95%
CI)
•
Q1
=
1.00
(refere
nt)
Quint
iles
of
w
alking(kcal/wk)
•
Q2
=
0.91
(0.81
-1.02)
Q1
=
<70
•
Q3
=
0.78
(0.68
-0.88)
Q2
=
70-186
•
Q4
=
0.71
(0.63
-0.82)
Q3
=
187-419
•
Q5
=
0.71
(0.62
-0.82)
Q4
=
420-897
Q5
=
898
Multivariate
adjust
ed
HRR
(95%
CI)
Change
in
acti
vity
level
:
Sedentar
y
at
ba
seline
•
Staying
sede
ntary
=
1.00
(refere
nt)
•
Became
acti
ve
=
0.52
(0.40
-0.69)
Mod
/
hig
h
acti
ve
at
baseline
•
Became
sede
ntary
=
0.92
(0.77
-1.09)
•
Stayed
active
=
0.6
8
(0.56
-0.82)
Wa
nnameth
ee
et
al
199
8
[40]
To
stud
y
the
relat
ionship
betw
een
he
art
rate,
PA
and
all-cause
mortalit
y.
•
n
=
5,934
Basel
ine
(1978
-1980)
and
12-1
4
year
follow-up
•
219
deaths
Main
taining
or
tak
ing
up
light
or
mod
erate
PA
reduc
es
mortality
in
old
er
Table
11:
Studies
examining
the
relationship
between
physical
activity
and
all-cause
mortality.
(Continued)
•
Sex:
Men
•
Age:
Mean
63
yr
Multivariate
adjust
ed
RR
(95%
CI),
UK
•
Characteristi
cs:
Healthy
,
sedent
ary
(4,311
were
co
nsidere
d
“
healthy
”
in
199
2)
PA
as
sessment:
Quest
ionnaire,
split
into
grou
ps
PA
Pros
pective
cohort
•
The
Brit
ish
Regi
onal
Hear
t
Stu
dy
•
G1
=
1.0
0
(referent)
•
G2
=
0.6
1
(0.43-0.8
6)
•
G3
=
0.5
0
(0.31-0.7
9)
D
&
B
score
=
12
PA
scor
e
•
G4
=
0.6
5
(0.45-0.9
4)
G1
=
Inacti
ve/occa
sional
Regular
walking
G2
=
Light
•
G1
=
1.0
0
(referent)
G3
=
Modera
te
•
G2
=
1.1
5
(0.73-1.7
9)
G4
=
Modera
tely
•
G3
=
1.0
6
(0.75-1.5
0)
vigo
rous/Vigorous
•
G4
=
0.9
7
(0.65-1.4
6)
Regu
lar
wa
lking
(min/d)
•
G5
=
0.6
2
(0.37-1.0
5)
G1
=
0
Recreati
onal
activity
G2
=
<20
•
G1
=
1.0
0
(referent)
G3
=
21-40
•
G2
=
0.9
5
(0.43-1.0
7)
G4
=
41-60
•
G3
=
0.6
8
(0.43-1.0
7)
G5
=
≥
60
•
G4
=
0.3
4
(0.35-1.0
0)
Rec
reational
acti
vity,
4
group
s
Sporting
acti
vity
G1
=
Inacti
ve/fairly
Inactive
•
G1
=
1.0
0
(referent)
G2
=
Averag
e
4
hr/
weeken
d
•
G2
=
0.5
0
(0.25-1.0
3)
G3
=
Fairly
acti
ve
>4
h/weeken
d
•
G3
=
0.8
8
(0.64-1.2
3)
G4
=
Very
active
Spor
ting
activity,
3
Gro
ups
G1
=
None
G2
=
Occasi
onal
G3
=
>1
time/mon
th
Paffen
barger
et
al
198
6
[63]
To
exa
mine
the
PA
and
lif
e-style
char
acteristics
o
f
Harvard
alumni
for
th
e
relationship
w
ith
all-cause
morta
lity.
•
n
=
16,936
12-1
6
year
follow-up
(19
62
to
197
8)
•
1,413
deaths
Th
e
findings
sugge
st
a
protec
tive
effec
t
o
f
exercise
against
all-cause
mort
ality.
•
Sex:
Men
Age
adjusted
RR
(95
%
CI):
•
Age:
35-7
4
USA
•
Characteristi
cs:
Harvard
alumni
Rec
ords
of
fres
hman
year
phy
sical
examin
ations
and
records
of
interc
ollegi
ate
spo
rt
Those
who
walked
Pros
pective
cohort
•
G1
=
1.0
0
Table
11:
Studies
examining
the
relationship
between
physical
activity
and
all-cause
mortality.
(Continued)
•
G2
=
0.8
5
•
G3
=
0.7
9
D
&
B
score
=
14
Trend
p
=
0.0009
PA
as
sessment:
Mailed
quest
ionnaires
survey
ing
pos
t
colle
ge
Physical
Acti
vity
Index
(95
%
CI):
PA
•
G1
=
1.0
0
(referent)
•
G2
=
0.7
8
•
G3
=
0.7
3
•
G4
=
0.6
3
Exerc
ise
repo
rted:
Wa
lking
(miles/
wk)
3
•
G5
=
0.6
2
grou
ps
•
G6
=
0.5
2
G1
=
<3
•
G7
=
0.4
6
G2
=
3-8
•
G8
=
0.6
2
G3
=
≥
9
Trend
p
=
<0.000
1
PA
ind
ex
(kcal/w
k)
3
grou
ps:
G1
=
<500
G2
=
500-999
G3
=
1000-14
99
G4
=
1500-19
99
G5
=
2000-24
99
G6
=
2500-29
99
G7
=
3000-34
99
G8
=
>3500
Cox
propor
tional
haza
rd
mod
els
Schn
ohr
et
al
2007
[64]
To
d
etermine
th
e
impact
of
wa
lking
d
uration
and
inten
sity
on
all-cause
mortalit
y.
•
n
=
7,308
(3,204
ma
le;
4,104
female)
Basel
ine
and
an
averag
e
of
12
year
•
1,391
deaths
Th
e
findings
indicat
e
that
the
relat
ive
intensi
ty
and
not
dura
tion
of
w
alking
is
the
most
impo
rtant
in
relat
ion
to
all-cause
morta
lity.
De
nmark
•
Sex:
Male
and
fem
ale
follow
-up
Multivariate
adjust
ed
HR
(95%
CI):
•
Age:
20-9
3
yr
PA
as
sessment:
Quest
ionnaire,
4
dura
tions
and
3
intensi
ties
Pros
pective
cohort
•
Characteristi
cs:
Parti
cipants
with
no
history
of
CHD,
stroke
or
cancer
and
who
had
no
dif
ficulty
in
walki
ng
Men
D
&
B
score
=
12
•
The
C
openhagen
City
Hea
rt
Study
•
G1
=
1.0
0
(referent)
•
G2
=
0.3
8
(0.25-0.5
Table
11:
Studies
examining
the
relationship
between
physical
activity
and
all-cause
mortality.
(Continued)
•
G3
=
0.3
8
(0.18-0.7
9)
Du
ration
(hours/day)
•
G4
=
0.6
9
(0.44-1.0
7)
1
=
<0.5
•
G5
=
0.3
7
(0.26-0.5
4)
2
=
0.5-1
•
G6
=
0.3
3
(0.18-0.6
1)
3
=
1-2
•
G7
=
0.7
8
(0.50-1.2
3)
4=>
2
•
G8
=
0.4
1
(0.29-0.5
9)
•
G9
=
0.3
3
(0.20-0.5
4)
Intensi
ty
•
G10
=
0.43
(0.22
-0.82)
Slow
intensi
ty
(SI)
•
G11
=
0.42
(0.29
-0.60)
Aver
age
intensi
ty
(AI)
•
G12
=
0.28
(0.16
-0.48)
Fast
intensi
ty
(F
I)
Women
12
grou
ps
•
G1
=
1.0
0
(referent)
G1
=
1
and
SI
•
G2
=
0.8
2
(0.52-1.2
9)
G2
=
1
and
AI
•
G3
=
0.7
8
(0.27-2.2
1)
G3
=
1
and
FI
•
G4
=
1.2
2
(0.82-1.8
1)
G4
=
2
and
SI
•
G5
=
0.7
4
(0.52-1.0
5)
G5
=
2
and
AI
•
G6
=
0.5
6
(0.33-0.9
6)
G6
=
2
and
FI
•
G7
=
0.9
4
(0.60-1.4
7)
G7
=
3
and
SI
•
G8
=
0.8
7
(0.61-1.2
3)
G8
=
3
and
AI
•
G9
=
0.4
8
(0.28-0.8
3)
G9
=
3
and
FI
•
G10
=
0.88
(0.40
-1.88)
G10
=
4
and
SI
•
G11
=
0.64
(0.44
-0.95)
G11
=
4
and
AI
•
G12
=
0.38
(0.21
-0.69)
G12
=
4
and
FI
Ku
shi
et
al
1997
[65]
To
ev
aluate
th
e
associatio
n
betw
een
PA
and
all-cause
morta
lity
in
pos
tmenopa
usal
wome
n.
•
n
=
40,417
7
year
follow-up
•
2,260
deaths
Th
e
results
demon
strate
a
graded
inve
rse
associat
ion
between
PA
and
all-cause
morta
lity
in
pos
tmenop
ausal
women
.
•
Sex:
Women
•
Age:
55-6
9
yr
PA
as
sessment:
Quest
ionnaire
for
freq
uency
of
moderate
and
vigo
rous
LTPA
Multivariate
adjust
ed
Frequen
cy
of
mod
erate
PA
per
week
RR
(95%
C
I):
USA
•
Characteristi
cs:
Postme
nopausal
Iowa
w
omen
Pros
pective
cohort
•
G1
=
1.00
(refere
nt)
•
G2
=
0.71
(0.63
-0.79)
D
&
B
score
=
13
Div
ided
b
y
freq
uency
/week
•
G3
=
0.63
(0.56
-0.71)
•
G4
=
0.59
(0.51
Table
11:
Studies
examining
the
relationship
between
physical
activity
and
all-cause
mortality.
(Continued)
G1
=
Rarely/n
ever
Trend
p
=
<0.001
G2
=
1
time/we
ek
to
a
few
time
s/month
Frequen
cy
of
vigo
rous
PA
per
week
G3
=
2-4
times/we
ek
G4
=
>4
times/we
ek
•
G1
=
1.00
(refere
nt)
•
G2
=
0.83
(0.69
-0.99)
•
G3
=
0.74
(0.59
-0.93)
Activ
ity
index
•
G4
=
0.62
(0.42
-0.90)
G1
=
Low
Trend
p
=
0.009
G2
=
Medium
G3
=
High
•
G1
=
1.00
(refere
nt)
•
G2
=
0.77
(0.69
-0.86)
•
G3
=
0.68
(0.60
-0.77)
Trend
p
=
<0.001
Paffen
barger
et
al
199
3
[67]
To
analy
ze
ch
anges
in
the
lifest
yles
of
Harvard
C
ollege
alumn
i
and
the
associat
ion
of
these
change
s
with
mort
ality.
•
n
=
10,269
Basel
ine
(1977
)
and
8
year
follo
w-up
(1985
)
•
476
deaths
Begi
nning
moderate
ly
vig
orous
spo
rts
activity
w
as
associat
ed
with
low
er
rates
of
death
fro
m
all
cause
s
among
middle
ag
ed
and
old
er
men.
•
Sex:
Men
•
Age:
45-8
4
yr
(in
197
7)
Beginnin
g
modera
te
spo
rts
activity
w
as
associat
ed
with
23%
low
er
risk
of
death
(95%
CI
4%-42%
,
p
=
0.015)
tha
n
those
not
taking
up
moderate
activ
ity
USA
•
Characteristi
cs:
Parti
cipants
with
no
reported
life-thr
eatening
disease
PA
A
ssessmen
t:
Quest
ionnaire
–
blo
cks
walked
daily,
stairs
climb
ed
d
aily
and
type,
frequen
cy
and
duration
of
w
eekly
spo
rts
and
recre
ational
activities
Pros
pective
cohort
D
&
B
score
=
13
Physi
cal
activity
index
(kcal/
wk)
Spor
ts
and
recre
ation
al
activities
Ligh
t
<4.5
METs
Mo
derate
>4.
5
METs
Weekly
lists
of
d
eaths
were
obta
ined
from
th
e
Harvard
colle
ge
alumni
offi
Table
11:
Studies
examining
the
relationship
between
physical
activity
and
all-cause
mortality.
(Continued)
Prop
ortional
haza
rd
mod
els
with
Poisso
n
regres
sion
met
hods
Kat
zmarzyk
and
Cr
aig
2002
[154]
To
q
uantify
the
relat
ionship
betw
een
musc
uloskeletal
fitness
and
all-cause
mortalit
y.
•
n
=
8,116
(3,933
ma
le;
4,183
female)
Basel
ine
(1981
)
and
•
238
deaths
So
me
compo
nents
of
musc
uloskeletal
fitn
ess
are
pr
edictive
o
f
mortalit
y.
13
year
follow-up
•
Sex:
Men
and
wome
n
RR
(95%
CI)
adjust
ed
for
age,
smoking
stat
us,
body
mass
and
VO
2max
Ca
nada
Musc
uloskeletal
fitness
(sit
ups,
push
ups,
g
rip
strength
,
sit
and
reach)
measures
divide
d
into
quar
tiles
•
Age:
20-6
9
yr
Q1
=
lowest
Sit
ups
Pros
pective
cohort
•
Characteristi
cs:
Parti
cipants
who
had
m
usculoskeletal
fitn
ess
measurement
s
taken
Q2
Men
Q3
•
Q1
=
2.72
(1.56-4.64)
Q4
=
highest
•
Q2
=
1.32
(0.73-2.41)
D
&
B
score
=
11
•
Q3
=
1.61
(0.90-2.87)
•
Q4
=
1.00
(refere
nt)
•
Canadian
Fitne
ss
Surv
ey
Cox
propor
tional
haza
rd
ratio
mod
el
Women •Q1
=
2.26
(1.15-4.43)
•
Q2
=
2.24
(1.07-4.67)
•
Q3
=
1.27
(0.59-2.72)
•
Q4
=
1.00
(refere
nt)
Push-ups Men •Q1
=
1.25
(0.77-2.05)
•
Q2