R E S E A R C H
Open Access
Impact of off-farm activities on technical
efficiency: evidence from maize producers
of eastern Ethiopia
Musa Hasen Ahmed
*and Kumilachew Alamerie Melesse
* Correspondence:musahasen@ gmail.com
School of Agricultural Economics and Agribusiness, College of Agriculture and Environmental Sciences, Haramaya University, P. O. Box 95, Dire Dawa, Ethiopia
Abstract
This article analyzes the impact of participation in off-farm activities on technical efficiency of maize production in eastern Ethiopia. We combined propensity score matching with a stochastic production frontier model that corrects sample selection bias resulting from unobserved factors that potentially affect both households’ decision to participate in off-farm activities and technical efficiency scores that most previous studies do not account for. The probit model results indicate that sex of the household head, literacy of the spouse, agricultural cooperative membership, family size, and access to market information had significant effect on farmers’participation in off-farm activities. In the meantime, it was found that farmers who participated in off-farm activities have a significant technical efficiency gain compared with their non-participant counterparts.
Keywords:Off-farm, Technical efficiency, Stochastic frontiers, PSM, Selection bias
Background
The vast majority of poor households living in the developing areas rely on agriculture for their food, income, and livelihood (Minten and Barrett2008; Dethier and Effenber-ger2012; Larsen and Lilleør2014). Hence, the growth and development of the agricul-ture sector is considered to be the main pathway out of poverty and food insecurity and to have a pro-poor economic development in those areas (Diao et al.2010; Kassie et al.2013; Collier and Dercon2014; Dawson et al.2016).
The agriculture sector is the mainstay of the Ethiopian economy as it accounts for nearly 45% of GDP and employs about 85% of labor forces (Dercon et al. 2012). Des-pite its strategic role for the country’s economy, the sector is dominated by subsistence and semi-subsistence farming system (Alemu et al.2006; Anley et al.2007; Francesconi and Heerink 2011; Teshome et al. 2016). Smallholders own on average less than 1 ha land per holder account for about 95% of land covered by crops on which they pro-duce about 90% of agricultural outputs in the country (CSA, 2014). Moreover, the ever-increasing population of the country is reducing the farm sizes rapidly (Bezu and Holden2014; Headey et al.2014). This population growth coupled with a legal restric-tion on agricultural land market hindered farm expansion that made farms smaller and hiring labor superfluous, which created a significant level of unemployment in the rural part of the country (Bezu and Holden2014). Hence, there has to be a mechanism
to support the livelihood of the agricultural communities and absorb the excess labor in the rural economy. As emphasized by Lanjouw and Lanjouw (2001), the main op-tions available for the unemployed rural community in this scenario are either migra-tion to urban areas or engagement in off-farm activities in rural areas. Actually, smallholder farmers in developing countries rarely rely on a full-time agricultural work; rather, they often maintain a portfolio of activities in which off-farm activities are an important contributions to their well-being (Barrett et al. 2001; Foster and Rosenzweig 2004; Smith et al.2005; Wouterse and Taylor2008; Lanjouw and Murgai 2009; Zezza et al.2009; Davis et al.2010; Haggblade et al.2010).
Empirical findings consistently show that incomes generated from off-farm activities ease the burden on agriculture as it enables households to have better incomes. Hence, they enhance food security as they manage food consumption fluctuations better than a household without such an activity (de Janvry and Sadoulet2001; Ruben2001; Barrett et al.2001; Babatunde and Qaim2010; Haggblade et al.2010; Owusu et al.2011; Bezu et al.2012; Hoang et al.2014; Mishra et al.2015). Especially when the agricultural pro-duction fails due to climate change, pest, deceases, or other shocks, off-farm employ-ment provides a risk manageemploy-ment tool to reduce the income variability and will fill the gap that will be created between farm income and household consumption El-Osta et al (2008). By engaging in off-farm employment, farmers also become self-insured (Ala-sia et al.2009) and they may invest in a risky but high-returning agricultural business.
Off-farm income can also enhance agricultural production by relaxing liquidity and credit constraints to purchase productivity enhancing agricultural technologies such as improved seed, fertilizer, machineries, and hiring labor (Ruben 2001; Lamb 2003; Matshe and Young 2004; Kilic et al.2009; Oseni and Winter2009; Anriquez and Dai-done 2010). This is particularly true in developing countries where farmers are facing credit constraints (Stampini and Davis2009).
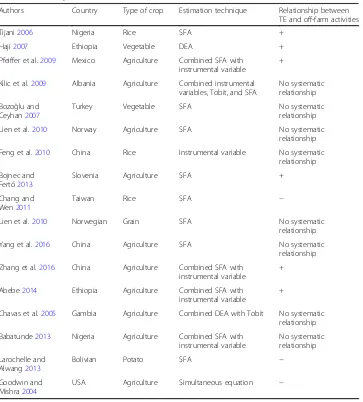
Though there are ample empirical evidences on the impact of off-farm income on adoption of productivity-enhancing agricultural inputs, its impact on farm efficiency is mixed. For example, Mochebelele and Winter-Nelson (2000), Tijani (2006), Haji (2007), Pfeiffer et al. (2009), Bojnec and Ferto (2013), and Babatunde (2013) found a positive significant impact of off-farm income on farm efficiency. There are also cases (such as Goodwin and Mishra (2004), Chang and Wen (2011), and Kilic et al. (2009)) in which participation in off-farm activities has an adverse effect on the agriculture. They argued that if the income from the off-farm activities is more attractive than the agriculture, farmers might give less attention for the agriculture and they might devote more family labor and time for off-farm activities. There are also studies (such as Cha-vas et al.2005, Bozoğlu and Ceyhan2007; Lien et al.2010, Feng et al.2010; Chang and Wen 2011) that found no significant association between the two variables. Table 1 summarizes some of the empirical works that examined the role of off-farm activities on technical efficiency.
2014). Other studies like Abebe (2014) relied on a single frontier equation for both those who participated in off-farm activities and non-participants without giving due attention for potential differences between the two groups.
Hence, unlike previous works, this paper aims to estimate the impact of participation in off-farm activities on TE of smallholder maize producers of eastern Ethiopia by com-bining propensity score matching with the Greene (2010) model to control for both ob-served and unobob-served heterogeneities.
Therefore, the results of this study adds to the existing literature (e.g., Abate et al. 2016; Barrett et al. 2001; Beyene 2008; Feng et al. 2010) through identifying the factors affecting the participation in off-farm activities. As the study evaluates the impact of participation in off-farm activities on the TE of maize producers, the study indicates the relationship between off-farm and on-farm activities and indi-cates whether there exists trade-off or complementarity between the two income-generating activities.
Table 1Summary of the studies which examined the relationship between off-farm income and technical efficiency
Authors Country Type of crop Estimation technique Relationship between TE and off-farm activities
Tijani2006 Nigeria Rice SFA +
Haji2007 Ethiopia Vegetable DEA +
Pfeiffer et al.2009 Mexico Agriculture Combined SFA with instrumental variable
+
Kilic et al.2009 Albania Agriculture Combined instrumental variables, Tobit, and SFA
No systematic relationship
Bozoğlu and Ceyhan2007
Turkey Vegetable SFA No systematic
relationship
Lien et al.2010 Norway Agriculture SFA No systematic
relationship
Feng et al.2010 China Rice Instrumental variable No systematic relationship
Bojnec and Fertő2013
Slovenia Agriculture SFA +
Chang and Wen2011
Taiwan Rice SFA −
Lien et al.2010 Norwegian Grain SFA No systematic
relationship
Yang et al.2016 China Agriculture SFA No systematic
relationship
Zhang et al.2016 China Agriculture Combined SFA with instrumental variable
+
Abebe2014 Ethiopia Agriculture Combined SFA with instrumental variable
+
Chavas et al.2005 Gambia Agriculture Combined DEA with Tobit No systematic relationship
Babatunde2013 Nigeria Agriculture Combined SFA with instrumental variable
No systematic relationship
Larochelle and Alwang2013
Bolivian Potato SFA −
Goodwin and Mishra2004
Methods
Econometric framework and estimation strategies Estimation of technical efficiency
Technical efficiency (TE) refers to the ability of a decision-making unit (DMU) to produce the maximum feasible output from a given bundle of inputs (Farrell 1957; Xiaogang et al.2005). Any deviation from this maximal output is considered as tech-nical inefficiency (Coelli et al. 2005). TE can be measured by using either parametric or non-parametric approaches (Simar and Wilson 2015). The main difference be-tween the two approaches is that the non-parametric approach assumes that the DMU has full control on the production process and all deviations from the frontier are associated with inefficiency. The parametric approach on the other hand distin-guishes inefficiency from deviations that are caused by factors beyond the control of the DMU. Given the intrinsic variability of agricultural production due to factors like climatic change, plant pathology, and insect and pests, the assumption that all deviations from the frontier are associated with inefficiency, as assumed in the non-parametric ap-proaches, is difficult to accept (Bauman et al.2016). Hence, this study has adopted a para-metric approach, specifically stochastic frontier analysis (SFA). Studies that utilized SFA to measure TE include Binam et al. 2004; Balcombe et al. 2007; Bozoğlu and Ceyhan 2007; Gedara et al. 2012; and Xu et al. 2015. The stochastic production frontier (SPF) function was independently proposed by Aigner et al. 1977 and Meeusen and Von den Broeck1977). This model can be expressed in the following form.
Yi¼ F Xð i;βÞexpðVi−UiÞ I¼1;2;3…n ð1Þ
where Yi is the observed maize production of the ith farmer,Xi is a vector of inputs used by the ith farmer,βis a vector of unknown parameters,Vi is the stochastic effect beyond the farmer’s control, measurement errors, and other statistical noises which are assumed to beNð0;σ2vÞand independent of theUiwhich is a non-negative random vari-able assumed to account for technical inefficiency in production. As SFA requires prior specification of functional form of the production function, a log-likelihood ratio (LR) test was conducted to choose between the Cobb-Douglas and translog functional forms using the following formula given by (Coelli1998).
LR¼−2ð lnLTL−ð lnLCBÞÞ ð2Þ
where lnLTL and lnLCB represent the log-likelihood function values obtained from the translog and the Cobb-Douglas production function, respectively. The LR1test result indicated that Cobb-Douglas production function is a more appropriate functional form for this study than the alternative translog production function. Several studies have utilized Cobb-Douglas production including Bozoğlu and Ceyhan2007; Pfeiffer et al.2009, and González-Flores et al.2014.
Impact evaluation and efficiency estimation
is equal to the probability of receiving treatment, considering both treated and non-treated groups based on a given set of predetermined covariates, using a binary choice model (Cameron and Trivedi2005). This step is followed by imposing the common sup-port region, which is the area within the minimum and maximum propensity scores of treated and comparison groups, respectively (Caliendo and Kopeinig2008). Several recent studies have applied PSM within the impact evaluation literature (e.g., Becerril and Abdulai2010; Mishra et al.2016; Abate et al.2016; Chagwiza et al.2016).
Nevertheless, PSM works only if selection is solely based on observable characteris-tics and potential outcomes are independent of treatment assignment. If unobservable characteristics affect the outcome variable, PSM is not the appropriate technique (Takahashi and Barrett2013; Khonje et al.2015). Hence, to handle biases from the un-observed characteristics, we used the model introduced by Greene (2010). According to this model, the sample selection and SPF models, along with their error structures, can be expressed as follows:
Sample selection:Fi¼1½α0ziþωi>0;ωiN½0;1
SPF: yi ¼β0xiþεi;εiN 0;σ2ε
yi;xi
ð Þobserved only whenFi¼1
ð4Þ
Error structure:εi¼vi−ui
ui¼ jσuUij ¼σuj jUi; where UiN½0;1
vi¼σvVi; where ViN½0;1
ωi;vi
ð Þ N2½0;1Þ; 1;ρσv;σ2v
whereFis a binary variable equal to one for participants on off-farm activities and zero for control, yis amount of maize produced, zis a vector of covariates included in the sample selection equation, and xis a vector of inputs in the production frontier;αand βare parameters to be estimated while εidenotes the characters in the error structure corresponding to the typical characterization of a stochastic frontier model and ρ cap-tures the presence or absence of selectivity bias.
Study areas and sampling technique
Results and discussions Descriptive statistics
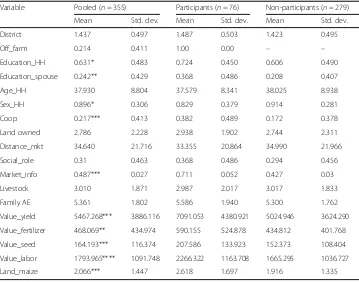
Before embarking to the econometrics results, it is important to give brief informa-tion regarding the sample respondents and variables used in the econometrics model. Accordingly, Table 2 presents descriptive statistics of the variables4 used for this study. As it is indicated in the table, 21% of the respondents have been participating in off-farm income-generating activities, which include selling firewood, renting assets, trading, and remittance. The mean age of the sample respondents is about 38 years. Nearly 90% of the sample households are headed by male. Concerning their educational status, 63.1% of the respondents and 24.2% of the spouses are literate. The mean family size of the respondents measured by adult equivalent (AE)5 is 5.36. As far as the asset ownership is concerned, on average, they have 2.79 quxi6 of land and 3.01 units of livestock measured by tropical livestock units (TLUs). The sample respondents, on average, travel about 35 min to reach the nearest market, and about 22% of respondents are members of agricultural cooperatives. The t test indicated that there is a statistical mean difference between off-farm participant and non-participant households in terms of educational status of the household head and the spouse, sex of the household head, and agricultural cooperative membership. Table 2 also indicated the input and output variables used to estimate the stochastic frontier production functions.
Table 2Descriptive statistics
Variable Pooled (n= 355) Participants (n= 76) Non-participants (n= 279)
Mean Std. dev. Mean Std. dev. Mean Std. dev.
District 1.437 0.497 1.487 0.503 1.423 0.495
Off_farm 0.214 0.411 1.00 0.00 – –
Education_HH 0.631* 0.483 0.724 0.450 0.606 0.490
Education_spouse 0.242** 0.429 0.368 0.486 0.208 0.407
Age_HH 37.930 8.804 37.579 8.341 38.025 8.938
Sex_HH 0.896* 0.306 0.829 0.379 0.914 0.281
Coop 0.217*** 0.413 0.382 0.489 0.172 0.378
Land owned 2.786 2.228 2.938 1.902 2.744 2.311
Distance_mkt 34.640 21.716 33.355 20.864 34.990 21.966
Social_role 0.31 0.463 0.368 0.486 0.294 0.456
Market_info 0.487*** 0.027 0.711 0.052 0.427 0.03
Livestock 3.010 1.871 2.987 2.017 3.017 1.833
Family AE 5.361 1.802 5.586 1.940 5.300 1.762
Value_yield 5467.268*** 3886.116 7091.053 4380.921 5024.946 3624.290
Value_fertilizer 468.069** 434.974 590.155 524.878 434.812 401.768
Value_seed 164.193*** 116.374 207.586 133.923 152.373 108.404
Value_labor 1793.965**** 1091.748 2266.322 1163.708 1665.295 1036.727
Land_maize 2.066*** 1.447 2.618 1.697 1.916 1.335
Econometrics results
Determinants of participation in off-farm activities
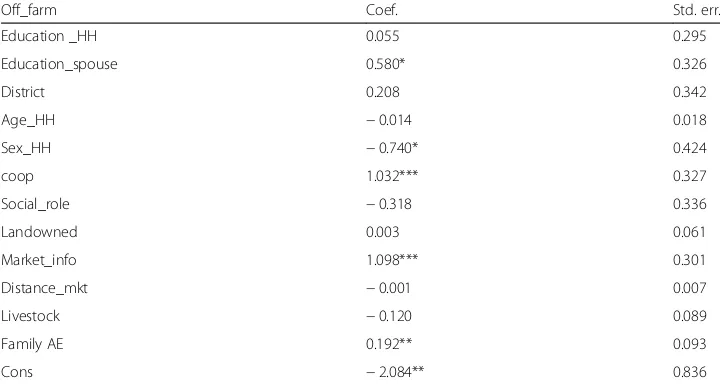
This sub-section presents the result of the probit regression model, which was used to estimate the propensity score for matching the off-farm participants with non-participants. The model sufficiently fitted the data at one significant level (LRχ2(12) = 42.34; Prob >χ2= 0.00). The result, presented in Table3, reveals that sex of the house-hold head, literacy of the spouse, agricultural cooperative membership, family size, and access to market information have significant effect on farmers’ participation in off-farm activities. Specifically, the result implies that being a female-headed household in-creases the probability of participation in off-farm activities.
Female-headed households are more likely to participate in off-farm activities than the male-headed counterparts because female-headed families engage in off-farm activ-ities to offset their relative lower farm income compared to male-headed ones. How-ever, this is against the result found by Beyene (2008).
Literacy of the spouse influences the participation in off-farm activities positively. Educated people have lower incentive to obtain income from own farming because educated people often have access to higher paying off-farm jobs (Lanjouw2001; Satriawan and Swinton2007) compared to uneducated ones. Therefore, the educated spouse would engage in higher earning off-farm activities so as to improve the livelihood of their family.
Agricultural cooperative membership has a positive influence on farmers’ participa-tion in off-farm activities. When a farmer becomes a cooperative member, he/she can get relatively more information from his/her fellows about the available off-farm works compared to non-members. Hence, his/her participation in off-farm activities would be more likely than the non-members.
Family size measured in terms of adult equivalent is an indicator of labor availability, and it has a positive influence to participate in off-farm activities. This is consistent with the results by Tassew et al. (2000) in such a way that large family size increases the households’ participation in off-farm works since a larger family size requires
Table 3Result of the Probit model of factors determining participation in off-farm activities
Off_farm Coef. Std. err.
Education _HH 0.055 0.295
Education_spouse 0.580* 0.326
District 0.208 0.342
Age_HH −0.014 0.018
Sex_HH −0.740* 0.424
coop 1.032*** 0.327
Social_role −0.318 0.336
Landowned 0.003 0.061
Market_info 1.098*** 0.301
Distance_mkt −0.001 0.007
Livestock −0.120 0.089
Family AE 0.192** 0.093
Cons −2.084** 0.836
relatively higher marginal income. This means that participation in off-farm activities can maintain the burden of large family size. Thus, households with large family size would have abundant labor and send some of the family members to off-farm activities. Access to market information has a positive influence on farmers’ participation in off-farm activities. Access to information about the availability of high-earning off-farm activities would give an opportunity to participate in those activities.
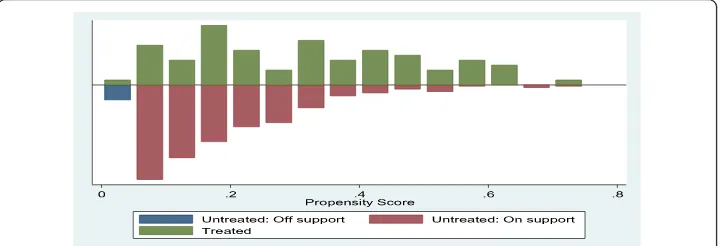
After estimating the probit model, we predicted the propensity scores and the com-mon support region. The values of propensity scores of both treatment and comparison groups are found between 0.04806759 and 0.71167307. This leads to the total matched sample size of 344 respondents of whom 76 are participants and 268 are non-participants. Figure 1 shows the density estimates of the distribution of propensity scores for each group, along with the areas with and without common support.
Estimation of the SPF and measuring technical efficiency
Once the matched samples are constructed, the next step is to determine if the conven-tional SPF should be run for the whole sample or if separate frontiers are necessary for participant and non-participant farmers. To determine this, we conducted a LR test based on following specification:
LR¼−2ð lnLP−ð lnLdþ lnLCÞÞ ð5Þ
where lnLP, lnLd, and lnLC represent the log-likelihood function values obtained from the pooled model, the participant, and the non-participant subsamples, respectively. Hence, we first estimated a SPF with pooled data by including a binary variable,Off_farm, as a regressor, which indicates whether the household participates or not in off-farm activ-ities, and two separate SPF models, one for households participating in off-farm activities and the other for non- participants. The pooled SPF models indicated that there is no sig-nificant difference between the two groups of farmers in their TE score as the variable
Off_farmare insignificant under both matched and unmatched SPF. However, this result is rejected by the LR test, which favors separate frontiers indicating the two groups have different production function. Then, to correct for the possible bias from observable heterogeneities, we re-estimated the above three frontiers (pooled, participants, and non-participants) using the matched data set.7 However, results of LR test again supported separate frontiers for each groups. Finally, to correct for the possible bias from unobserv-ables, two separate SPF models are re-estimated using Greene’s (2010) selection
correction framework. The results of the SPF models are presented in Table4for the un-matched samples and in Table5for the matched samples.
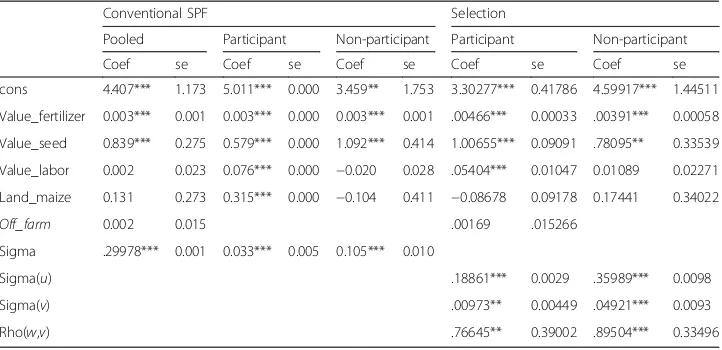
The estimated value of sigma are significant at less than 1% probability level for all frontier functions indicating the conventional average production function is not an ad-equate representation of the data. The coefficients of rho, which indicate the presence of selection bias, are also significant in all selection frontiers except for the non-participants in the case of the unmatched data. This result suggests the presence of selection bias, thus lending support to the use of a sample selection framework to esti-mate separate SPFs for the beneficiaries and control groups.
As it is presented in the tables, the signs of all significant variables are positive as we expected. However, different input-output responses are found between these two groups of farmers. The result indicates that expenditure on inorganic fertilizer and seed are significant in all frontiers, while labor is found to be insignificant for non-participant respondents, which indicate that the amount of labor has no impact in Table 4Conventional and selection SPF based on unmatched observation
Conventional SPF Selection
Pooled Participant Non-participant Participant Non-participant
Coef se Coef se Coef se Coef se Coef se
Cons 5.568*** 0.756 5.011*** 0.000 5.615*** 0.917 5.92418*** 0.4524 4.96669*** 0.667
Value_fertilizer 0.003*** 0.001 0.003*** 0.000 0.003*** 0.001 .00267*** 0.0003 .00406*** 0.001
Value_seed 0.558*** 0.173 0.579*** 0.000 0.572*** 0.212 .40810*** 0.0964 .72837*** 0.152
Value_labor 0.012 0.023 0.076*** 0.000 −0.003 0.030 .05214*** 0.0098 −0.00711 0.029
Land_maize 0.410** 0.174 0.315*** 0.000 0.415* 0.212 .49672*** 0.1002 .25527* 0.152 Off_farm −0.002 0.015
Sigma 0.091*** 0.007 0.033*** 0.005 0.106*** 0.010
Sigma(u) .21502*** 0.0033 .42371*** 0.014
Sigma(v) .01373** 0.0059 .04182*** 0.012
Rho(w,v) .96882*** 0.0905 −0.40401 1.579
*Significance at 10% level **Significance at 5% level ***Significance at 1% level
Table 5Conventional and selection SPF based on matched observations
Conventional SPF Selection
Pooled Participant Non-participant Participant Non-participant
Coef se Coef se Coef se Coef se Coef se
cons 4.407*** 1.173 5.011*** 0.000 3.459** 1.753 3.30277*** 0.41786 4.59917*** 1.44511
Value_fertilizer 0.003*** 0.001 0.003*** 0.000 0.003*** 0.001 .00466*** 0.00033 .00391*** 0.00058
Value_seed 0.839*** 0.275 0.579*** 0.000 1.092*** 0.414 1.00655*** 0.09091 .78095** 0.33539
Value_labor 0.002 0.023 0.076*** 0.000 −0.020 0.028 .05404*** 0.01047 0.01089 0.02271 Land_maize 0.131 0.273 0.315*** 0.000 −0.104 0.411 −0.08678 0.09178 0.17441 0.34022
Off_farm 0.002 0.015 .00169 .015266
Sigma .29978*** 0.001 0.033*** 0.005 0.105*** 0.010
Sigma(u) .18861*** 0.0029 .35989*** 0.0098
Sigma(v) .00973** 0.00449 .04921*** 0.0093
Rho(w,v) .76645** 0.39002 .89504*** 0.33496
determining the production level of maize in this subsample. Almost in all frontiers, the average production elasticity of seed and land allocated for maize are the highest.
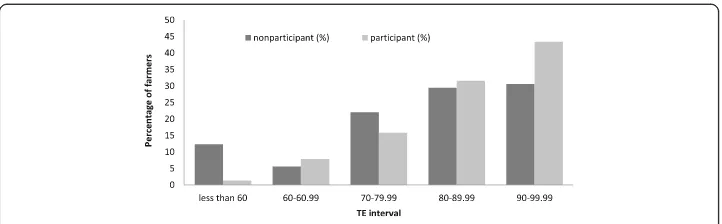
Impact of participation in off-farm activities on technical efficiency
After estimating the SPF corrected for both observed and unobserved heterogeneities, we predicted the TE score of each sample respondent. Figure2 presents the distribution of TE score for both participant and non-participant farmers. The TE scores range between 39.27 and 99.56 for the entire population. It indicates that the TE scores of 37.21% percent of the maize producers considered for this study were below the mean efficiency level. Considering only the participants, the TE score is ranged between 59.39 and 99.56 and the corresponding figure for the nonparticipants is found between 39.27 and 99.06.
Table 6summarizes the TE mean difference between the two groups after correcting for bias from both observable and non-observable heterogeneities. The results indicate a significant mean difference between the two groups. Specifically, the result reveals farmers who are participating in off-farm income-generating activities have 6.23% of technical efficiency gain compared with their non-participant counterparts. The result is consistent with Pfeiffer et al. (2009).
As indicated in Table5, the mean TE for pooled sample respondents was found to be 81.44% and the corresponding figure for households participating in off-farm activities and non-participants are 86.29 and 80.06%, respectively.
Finally, we examined which of the two groups (participants vs. nonparticipants) has higher output after controlling for biases from observed and unobserved variables. For this purpose, we compared the predicted frontier output of the two groups at three dif-ferent input levels: (1) at the average for the smallest matched pair of farms, (2) at the average for the entire sample, and (3) at the average for the largest matched pair. The result is indicated along with a test of the mean difference in Table 7. As it is indicated in the table, households who are participating in off-farm activities are significantly more productive than the non-participant farmers. Thus, the analysis suggests that par-ticipants do not only exhibit higher TE but also higher total output.
Fig. 2The distribution of TE score for participant and non-participant farmers
Table 6TE scores after bias correction
Variable Combined Participants Non-participants Difference
Mean Std. err. Mean Std. err. Mean Std. err. Mean
TE 81.44 0.008 86.29 0.012 80.06% 0.009 6.23%***
Conclusion
This study analyzed the determinants of participation in off-farm activities and examined the impact of participation in off-farm activities on technical efficiency of maize produc-tion in eastern Ethiopia using data collected from 355 households. The probit model re-sults indicate that literacy of the spouse, agricultural cooperative membership, family size, and access to market information had positively and significantly affected the participation in off-farm activities whereas male household head had negative and significant effect on participation in off-farm activities. The stochastic frontier production function was used to estimate technical efficiency scores, and propensity score matching was combined with Green (2010) to control sample selection bias. The result indicated that participation in off-farm activities have a positive influence on both production and productivity of maize. The result suggests that participants in off-farm activities are more technically efficient in maize production than the non-participants. The finding of this study indicated the exist-ence of complementarity between on-farm and off-farm activities. This result challenges the perception that participation in off-farm activities may lead to a reduction in on-farm production due to competition between farm and off-farm works for family labor. The re-sult indicates that livelihood diversification improves the agriculture sector in addition to creation of more employment opportunities as it provides a medium for family labor re-allocation. This confirms the fact that off-farm income enhances agricultural production and productivity by providing cash to purchase agricultural technologies and efficiently utilize those resources.
Hence, given the complementarities between off-farm and farm activities, providing services like education and market information to the farmers and strengthening agri-cultural cooperatives should be facilitated to increase the participation of farmers in off-farm activities and in turn to improve their livelihoods.
Endnotes
1
The critical value for a test of sizeαis equal to the valueχ2(α), where this is the value, which is exceeded by theχ12random variable with probability equal to 2α(Coelli1998).
2
Kebeleis the smallest administrative hierarchy in Ethiopia.
3
Every kebeleadministration has a full list of households living in the area. We used this list as a sample frame. When the randomly selected farmer does not produce maize he/she will be replaced by a farmer next to him/her in the list.
4
List and definition of variables used for this study is presented under Table 8 in the Appendix.
5
Family size is calculated by converting difference in age and sex of members of the family members using conversion factor given in Table 9, and Table 10 in theAppendix indicates the conversion factor used to compute TLU.
6
quxiis a local measurement unit equivalent with 1/8 of a hectare
7
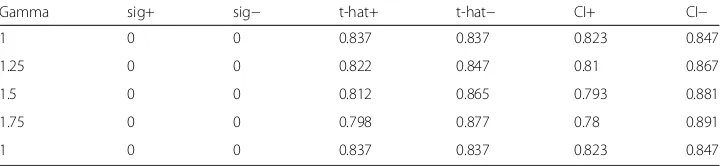
The sensitivity analysis is presented under Table 11 in theAppendix. Table 7Predicted frontier output after bias correction
Predict frontier Mean Min Max Significance level
Participants 8225.957 2844.444 25,848.23 ***
Non-participants 6187.10 2775.337 20,651.33
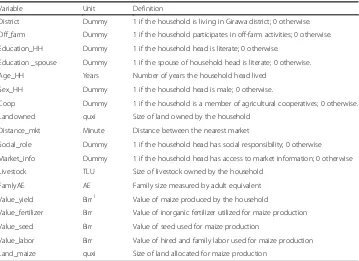
Table 8Definition of variables
Variable Unit Definition
District Dummy 1 if the household is living in Girawa district; 0 otherwise.
Off_farm Dummy 1 if the household participates in off-farm activities; 0 otherwise.
Education_HH Dummy 1 if the household head is literate; 0 otherwise.
Education _spouse Dummy 1 if the spouse of household head is literate; 0 otherwise.
Age_HH Years Number of years the household head lived
Sex_HH Dummy 1 if the household head is male; 0 otherwise.
Coop Dummy 1 if the household is a member of agricultural cooperatives; 0 otherwise.
Landowned quxi Size of land owned by the household
Distance_mkt Minute Distance between the nearest market
Social_role Dummy 1 if the household head has social responsibility; 0 otherwise
Market_info Dummy 1 if the household head has access to market information; 0 otherwise
Livestock TLU Size of livestock owned by the household
FamlyAE AE Family size measured by adult equivalent
Value_yield Birr1 Value of maize produced by the household
Value_fertilizer Birr Value of inorganic fertilizer utilized for maize production
Value_seed Birr Value of seed used for maize production
Value_labor Birr Value of hired and family labor used for maize production
Land_maize quxi Size of land allocated for maize production
1Ethiopian currency; 1USD was equivalent with 21.21 ETB in the time of data collection
Table 9Conversion factor for computation of adult equivalent
Adult equivalent
Age group (years) Male Female
< 10 0.6 0.6
11–13 0.9 0.8
14–16 1 0.75
17–50 1 0.75
> 50 1 0.7
Source: Storck et al. (1991)
Table 10Conversion factors used to estimate tropical livestock unit (TLU) equivalents
Animal category TLU
Calf
Donkey (young) Weaned calf Camel Heifer
Sheep and goat (adult) Cow and ox
Sheep and goat (young) Horse
Chicken Donkey (adult)
0.25 0.35 0.34 1.25 0.75 0.13 1.00 0.06 1.10 0.013 0.70
Source: Storck, et al. (1991)
Abbreviations
CSA:Central Statistical Agency; DEA: Data envelopment analysis; DMU: Decision-making unit; PSM: Propensity score
matching; SFA: Stochastic production approach; SPF: Stochastic production frontier; TE: Technical efficiency
Acknowledgements
We are grateful to the Haramaya University for funding this research work. We also acknowledge enumerators, sample respondents, and extension staff of the Ministry of Agriculture for their efforts that led to the success of this study.
Funding
Haramaya University financially and logistically supported this research.
Availability of data and materials
The data that support the findings of this study can be obtained from the authors based on request.
Authors’contributions
MHA conceptualized the study and designed and performed the data analysis. KAM was responsible for the design of the questionnaire, interpretation of model results, and write-up of the manuscript. Both authors read and approved the final manuscript.
Authors’information
Mr. Musa Hasen Ahmed is a staff member of the Department of Agricultural Economics at Haramaya University. He has published articles related to productivity analysis, impact evaluation, natural resource valuation, and adoption of agricultural technologies. Mr. Kumilachew Alamerie Melesse is an assistant professor of Agricultural Economics at Haramaya University. He has experience in research related to agricultural technology adoption, productivity analysis, impact evaluation, risk analysis, and agricultural market analysis.
Ethics approval and consent to participate
Ethical approval and consent to participate is not applicable for our study.
Competing interests
The authors declare that they have no competing interests.
Publisher’s Note
Springer Nature remains neutral with regard to jurisdictional claims in published maps and institutional affiliations.
Received: 3 March 2017 Accepted: 20 January 2018
References
Abate GT, Rashid S, Borzaga C, Getnet K (2016) Rural finance and agricultural technology adoption in Ethiopia: does the institutional design of lending organizations matter? World Dev 84:235–253
Abebe G. G. (2014). Off-farm income and technical efficiency of smallholder farmers in Ethiopia—a stochastic frontier analysis. European Erasmus Mundus Master Program: Agricultural Food and Environmental Policy Analysis (AFEPA). Degree thesis No 862 ISSN 1401-4084, Uppsala 2014
Aigner D, Lovell CK, Schmidt P (1977) Formulation and estimation of stochastic frontier production function models. J Econ 6(1):21–37
Alasia A, Weersink A, Bollman RD, Cranfield J (2009) Off-farm labour decision of Canadian farm operators: urbanization effects and rural labour market linkages. J Rural Stud 25(1):12–24
Alemu D, Gabre-Madhin E, Dejene S (2006) From farmer to market and market to farmer: characterizing smallholder commercialization in Ethiopia. International Food Policy Research Institute, Washington, DC
Anley Y, Bogale A, Haile-Gabriel A (2007) Adoption decision and use intensity of soil and water conservation measures by smallholder subsistence farmers in Dedo district, Western Ethiopia. Land Degrad Dev 18(3):289–302
Anríquez G, Daidone S (2010) Linkages between the farm and nonfarm sectors at the household level in rural Ghana: a consistent stochastic distance function approach. Agric Econ 41(1):51–66
Table 11Sensitivity analyses
Gamma sig+ sig− t-hat+ t-hat− CI+ CI−
1 0 0 0.837 0.837 0.823 0.847
1.25 0 0 0.822 0.847 0.81 0.867
1.5 0 0 0.812 0.865 0.793 0.881
1.75 0 0 0.798 0.877 0.78 0.891
1 0 0 0.837 0.837 0.823 0.847
Gammalog odds of differential assignment due to unobserved factors,sig+upper bound significance level,sig−lower
bound significance level,t-hat+upper bound Hodges-Lehmann point estimate,t-hat−lower bound Hodges-Lehmann
Babatunde RO (2013) On-farm and off-farm works: complement or substitute. In: Evidence from Rural Nigeria. Contributed paper for the 4th International Conference of the African Association of Agricultural Economists Babatunde RO, Qaim M (2010) Impact of off-farm income on food security and nutrition in Nigeria. Food Policy 35(4):303–311 Balcombe K, Fraser I, Rahman M, Smith L (2007) Examining the technical efficiency of rice producers in Bangladesh.
J Int Dev 19(1):1–16
Barrett CB, Reardon T, Webb P (2001) Nonfarm income diversification and household livelihood strategies in rural Africa: concepts, dynamics, and policy implications. Food Policy 26(4):315–331
Bauman A, Jablonski BB, Thilmany McFadden D (2016) Evaluating scale and technical efficiency among farms and ranches with a local market orientation. In: 2016 Annual Meeting, July 31-August 2, 2016, Boston, Massachusetts (No. 236057). Agricultural and Applied Economics Association
Becerril J, Abdulai A (2010) The impact of improved maize varieties on poverty in Mexico: a propensity score-matching approach. World Dev 38(7):1024–1035
Beyene AD (2008) Determinants of off-farm participation decision of farm households in Ethiopia. Agrekon 47(1):140–161 Bezu S, Barrett CB, Holden ST (2012) Does the nonfarm economy offer pathways for upward mobility? Evidence from a
panel data study in Ethiopia. World Dev 40(8):1634–1646
Bezu S, Holden S (2014) Are rural youth in Ethiopia abandoning agriculture? World Dev 64:259–272
Binam JN, Tonye J, Nyambi G, Akoa M (2004) Factors affecting the technical efficiency among smallholder farmers in the slash and burn agriculture zone of Cameroon. Food Policy 29(5):531–545
BojnecŠ, FertőI (2013) Farm income sources, farm size and farm technical efficiency in Slovenia. Post-Communist Econ 25(3):343–356
Bozoğlu M, Ceyhan V (2007) Measuring the technical efficiency and exploring the inefficiency determinants of vegetable farms in Samsun province, Turkey. Agric Syst 94(3):649–656
Bravo-Ureta BE, Greene W, Solís D (2012) Technical efficiency analysis correcting for biases from observed and unobserved variables: an application to a natural resource management project. Empir Econ 43(1):55–72 Caliendo M, Kopeinig S (2008) Some practical guidance for the implementation of propensity score matching. J Econ
Surv 22(1):31–72
Cameron AC, Trivedi PK (2005) Microeconometrics: methods and applications. Cambridge university press Chagwiza C, Muradian R, Ruben R (2016) Cooperative membership and dairy performance among smallholders in
Ethiopia. Food Policy 59:165–173
Chang HH, Wen FI (2011) Off-farm work, technical efficiency, and rice production risk in Taiwan. Agric Econ 42(2):269–278 Chavas JP, Petrie R, Roth M (2005) Farm household production efficiency: evidence from the Gambia. Am J Agric Econ
87(1):160–179
Coelli T (1998) A multi-stage methodology for the solution of orientated DEA models. Oper Res Lett 23(3):143–149 Coelli TJ, Rao DSP, O'Donnell CJ, Battese GE (2005) An introduction to efficiency and productivity analysis. Springer
Science & Business Media
Collier P, Dercon S (2014) African agriculture in 50 years: smallholders in a rapidly changing world? World Dev 63:92–101 CSA (Central Statistical Agency) (2014) Report on area and production of major crops (Private Peasant Holdings, Meher
Season): agricultural sample survey 2015/2016 (2008 E.C.), vol I, Addis Ababa
Davis B, Winters P, Carletto G, Covarrubias K, Quinones EJ, Zezza A, Stamoulis K, Azzarri C, Digiuseppe S (2010) A cross-country comparison of rural income generating activities. World Dev 38(1):48–63
Dawson N, Martin A, Sikor T (2016) Green revolution in sub-saharan Africa: implications of imposed innovation for the wellbeing of rural smallholders. World Dev 78:204–218
De Janvry A, Sadoulet E (2001) Income strategies among rural households in Mexico: the role of off-farm income. World Dev 29(3):467–480
Dercon S, Hoddinott J, Woldehanna T (2012) Growth and chronic poverty: evidence from rural communities in Ethiopia. J Dev Stud 48(2):238–253
Dethier JJ, Effenberger A (2012) Agriculture and development: a brief review of the literature. Econ Syst 36(2):175–205 Diao X, Hazell P, Thurlow J (2010) The role of agriculture in African development. World Dev 38(10):1375–1383 El-Osta, H. S., Mishra, A. K., & Morehart, M. J. (2008). Off-farm labor participation decisions of married farm couples and
the role of government payments. Review of Agricultural Economics, 30(2), 311–332.
Farrell MJ (1957) The measurement of productive efficiency. Journal of the Royal Statistical Society Series A (General) 120(3):253–290
Feng S, Heerink N, Ruben R, Qu F (2010) Land rental market, off-farm employment and agricultural production in Southeast China: a plot-level case study. China Econ Rev 21(4):598–606
Foster AD, Rosenzweig MR (2004) Agricultural productivity growth, rural economic diversity, and economic reforms: India, 1970–2000. Econ Dev Cult Chang 52(3):509–542
Francesconi GN, Heerink N (2011) Ethiopian agricultural cooperatives in an era of global commodity exchange: does organisational form matter? J Afr Econ 20(1):153–177
Gedara KM, Wilson C, Pascoe S, Robinson T (2012) Factors affecting technical efficiency of rice farmers in village reservoir irrigation systems of Sri Lanka. J Agric Econ 63(3):627–638
González-Flores M, Bravo-Ureta BE, Solís D, Winters P (2014) The impact of high value markets on smallholder productivity in the Ecuadorean Sierra: a stochastic production frontier approach correcting for selectivity bias. Food Policy 44:237–247 Goodwin BK, Mishra AK (2004) Farming efficiency and the determinants of multiple job holding by farm operators. Am
J Agric Econ 86(3):722–729
Greene W (2010) A stochastic frontier model with correction for sample selection. J Prod Anal 34(1):15–24 Haggblade S, Hazell P, Reardon T (2010) The rural non-farm economy: prospects for growth and poverty reduction.
World Dev 38(10):1429–1441
Headey D, Dereje M, Taffesse AS (2014) Land constraints and agricultural intensification in Ethiopia: a village-level analysis of high-potential areas. Food Policy 48:129–141
Hoang TX, Pham CS, Ulubaşoğlu MA (2014) Non-farm activity, household expenditure, and poverty reduction in rural Vietnam: 2002–2008. World Dev 64:554–568
Kassie M, Jaleta M, Shiferaw B, Mmbando F, Mekuria M (2013) Adoption of interrelated sustainable agricultural practices in smallholder systems: evidence from rural Tanzania. Technol Forecast Soc Chang 80(3):525–540
Khonje M, Manda J, Alene AD, Kassie M (2015) Analysis of adoption and impacts of improved maize varieties in eastern Zambia. World Dev 66:695–706
Kilic T, Carletto C, Miluka J, Savastano S (2009) Rural nonfarm income and its impact on agriculture: evidence from Albania. Agric Econ 40(2):139–160
Lamb RL (2003) Fertilizer use, risk, and off-farm labor markets in the semi-arid tropics of India. Am J Agric Econ 85(2):359–371 Lanjouw JO, Lanjouw P (2001) The rural non-farm sector: issues and evidence from developing countries. Agric Econ 26(1):1–23 Lanjouw P (2001) Nonfarm employment and poverty in rural El Salvador. World Dev 29(3):529–547
Lanjouw P, Murgai R (2009) Poverty decline, agricultural wages, and nonfarm employment in rural India: 1983–2004. Agric Econ 40(2):243–263
Larochelle C, Alwang J (2013) The role of risk mitigation in production efficiency: a case study of potato cultivation in the Bolivian Andes. J Agric Econ 64(2):363–381
Larsen AF, Lilleør HB (2014) Beyond the field: the impact of farmer field schools on food security and poverty alleviation. World Dev 64:843–859
Lien G, Kumbhakar SC, Hardaker JB (2010) Determinants of off-farm work and its effects on farm performance: the case of Norwegian grain farmers. Agric Econ 41(6):577–586
Matshe I, Young T (2004) Off-farm labour allocation decisions in small-scale rural households in Zimbabwe. Agric Econ 30(3):175–186
Meeusen W, van Den Broeck J (1977) Efficiency estimation from Cobb-Douglas production functions with composed error. Int Econ Rev 18:435–444
Minten B, Barrett CB (2008) Agricultural technology, productivity, and poverty in Madagascar. World Dev 36(5):797–822 Mishra AK, Kumar A, Joshi PK, D'souza A (2016) Impact of contracts in high yielding varieties seed production on profits
and yield: the case of Nepal. Food Policy 62:110–121
Mishra AK, Mottaleb KA, Mohanty S (2015) Impact of off-farm income on food expenditures in rural Bangladesh: an unconditional quantile regression approach. Agric Econ 46(2):139–148
Mochebelele MT, Winter-Nelson A (2000) Migrant labor and farm technical efficiency in Lesotho. World Dev 28(1):143–153 Oseni G, Winters P (2009) Rural nonfarm activities and agricultural crop production in Nigeria. Agric Econ 40(2):189–201 Owusu V, Abdulai A, Abdul-Rahman S (2011) Non-farm work and food security among farm households in Northern
Ghana. Food Policy 36(2):108–118
Pfeiffer L, López-Feldman A, Taylor JE (2009) Is off-farm income reforming the farm? Evidence from Mexico. Agric Econ 40(2):125–138
Ruben R (2001) Nonfarm employment and poverty alleviation of rural farm households in Honduras. World Dev 29(3):549–560 Satriawan E, Swinton SM (2007) Does human capital raise farm or nonfarm earning more? New insight from a rural
Pakistan household panel. Agric Econ 36(3):421–428
Simar L, Wilson PW (2015) Statistical approaches for non-parametric frontier models: a guided tour. Int Stat Rev 83(1):77–110 Smith LED, Nguyen Khoa S, Lorenzen K (2005) Livelihood functions of inland fisheries: policy implications in developing
countries. Water Policy 7:359–383
Stampini M, Davis B (2009) Does nonagricultural labor relax farmers’credit constraints? Evidence from longitudinal data for Vietnam. Agric Econ 40(2):177–188
Storck H, Emana B, Adnew B, Borowiccki A, Woldehawariat S (1991) Farming systems and resource economics in the tropics: farming system and farm management practices of smallholders in the Hararghe Highland, vol II. Wissenschaftsverlag Vauk, Kiel
Takahashi K, Barrett CB (2013) The system of rice intensification and its impacts on household income and child schooling: evidence from rural Indonesia. Am J Agric Econ aat086
Tassew W, Lansink AO, Peerlings J (2000) Off-farm work decisions on Dutch cash crop farms and the 1992 and agenda 2000 CAP reforms. Agric Econ 22(2000):163–171
Teshome A, de Graaff J, Kessler A (2016) Investments in land management in the north-western highlands of Ethiopia: the role of social capital. Land Use Policy 57:215–228
Tijani AA (2006) Analysis of the technical efficiency of rice farms in Ijesha Land of Osun State, Nigeria. Agrekon 45(2): 126–135
Wouterse F, Taylor JE (2008) Migration and income diversification: evidence from Burkina Faso. World Dev 36(4):625–640 Xiaogang C, Skully M, Brown K (2005) Banking efficiency in China: application of DEA to pre- and post-deregulation
eras: 1993–2000. China Econ Rev 16(3):229–245
Xu TIAN, SUN FF, ZHOU YH (2015) Technical efficiency and its determinants in China's hog production. J Integr Agric 14(6):1057–1068
Yang J, Wang H, Jin S, Chen K, Riedinger J, Peng C (2016) Migration, local off-farm employment, and agricultural production efficiency: evidence from China. J Prod Anal 45(3):247–259
Zezza A, Carletto G, Davis B, Stamoulis K, Winters P (2009) Rural income generating activities: whatever happened to the institutional vacuum? Evidence from Ghana, Guatemala, Nicaragua and Vietnam. World Dev 37(7):1297–1306 Zhang L, Su W, Eriksson T, Liu C (2016) How off-farm employment affects technical efficiency of China’s farms: the case