• No results found

The potential of spectral domain optical coherence tomography imaging based retinal biomarkers

N/A
N/A
Protected

Academic year: 2020

Share "The potential of spectral domain optical coherence tomography imaging based retinal biomarkers"

Copied!
10
0
0

Loading.... (view fulltext now)

Full text

Figure

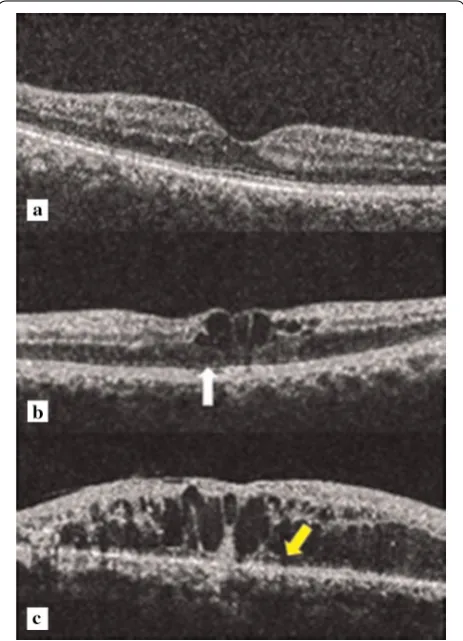
Fig. 1 Spectral domain optical coherence tomography showing grades of disruption of the ELM and EZ
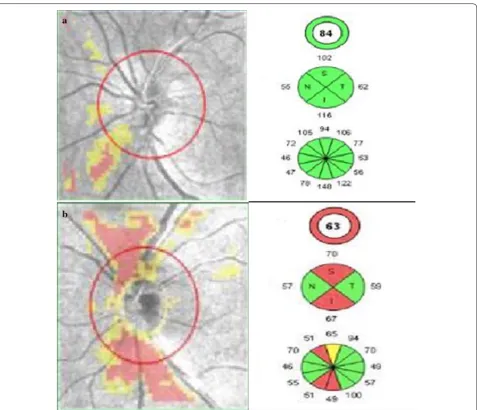
Fig. 2 Retinal Nerve Fiber Layer (RNFL) thickness analysis using optic disc cube 200 × 200 feature depicting on RNFL thickness deviation map a left eye of patient with non-proliferative diabetic retinopathy showing RNFL thinning, b left eye of patient with proliferative diabetic retinopathy show-ing thinning of RNFL
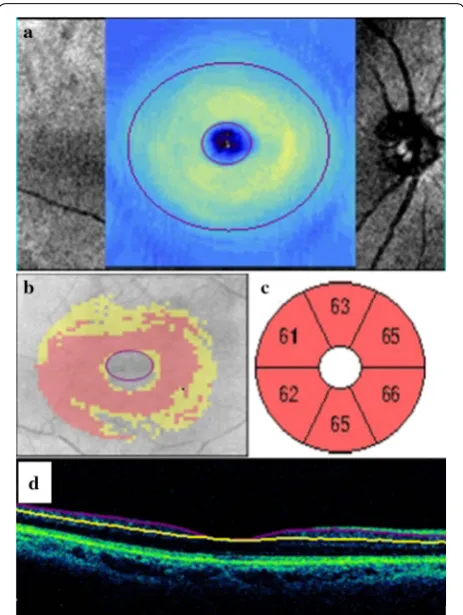
Fig. 3 Ganglion Cell Analysis in a patient of diabetes showing thin-ning in thickness of GCL in GCL thickness map (a), deviation map (b), GCL sectoral quantative analysis (c)
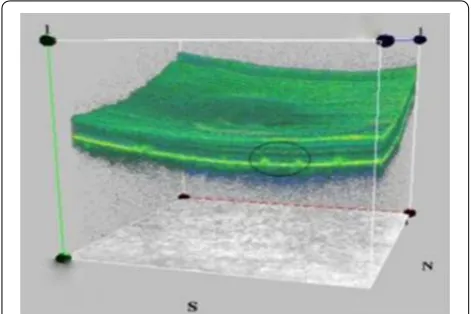
Fig. 4 Three dimensional visualization shows flecks at the level of retinal pigment epithelium (enclosed in black circle)
+2

References

Related documents