Open Access
Research
An agent-based approach for modeling dynamics of contagious
disease spread
Liliana Perez* and Suzana Dragicevic
Address: Spatial Analysis and Modeling Laboratory, Department of Geography, Simon Fraser University, 8888 University Drive, Burnaby, BC, V5A 1S6, Canada
Email: Liliana Perez* - [email protected]; Suzana Dragicevic - [email protected] * Corresponding author
Abstract
Background: The propagation of communicable diseases through a population is an inherent spatial and temporal process of great importance for modern society. For this reason a spatially explicit epidemiologic model of infectious disease is proposed for a greater understanding of the disease's spatial diffusion through a network of human contacts.
Objective: The objective of this study is to develop an agent-based modelling approach the integrates geographic information systems (GIS) to simulate the spread of a communicable disease in an urban environment, as a result of individuals' interactions in a geospatial context.
Methods: The methodology for simulating spatiotemporal dynamics of communicable disease propagation is presented and the model is implemented using measles outbreak in an urban environment as a case study. Individuals in a closed population are explicitly represented by agents associated to places where they interact with other agents. They are endowed with mobility, through a transportation network allowing them to move between places within the urban environment, in order to represent the spatial heterogeneity and the complexity involved in infectious diseases diffusion. The model is implemented on georeferenced land use dataset from Metro Vancouver and makes use of census data sets from Statistics Canada for the municipality of Burnaby, BC, Canada study site.
Results: The results provide insights into the application of the model to calculate ratios of susceptible/infected in specific time frames and urban environments, due to its ability to depict the disease progression based on individuals' interactions. It is demonstrated that the dynamic spatial interactions within the population lead to high numbers of exposed individuals who perform stationary activities in areas after they have finished commuting. As a result, the sick individuals are concentrated in geographical locations like schools and universities.
Conclusion: The GIS-agent based model designed for this study can be easily customized to study the disease spread dynamics of any other communicable disease by simply adjusting the modeled disease timeline and/or the infection model and modifying the transmission process. This type of simulations can help to improve comprehension of disease spread dynamics and to take better steps towards the prevention and control of an epidemic outbreak.
Published: 5 August 2009
International Journal of Health Geographics 2009, 8:50 doi:10.1186/1476-072X-8-50
Received: 16 March 2009 Accepted: 5 August 2009
This article is available from: http://www.ij-healthgeographics.com/content/8/1/50
© 2009 Perez and Dragicevic; licensee BioMed Central Ltd.
Background
Spatial epidemiology issues are outstandingly important, particularly the viral spread through populated areas is believed to be one of the major concerns [1]. The inci-dence and prevalence of infectious diseases in a given population, with varied geographic and demographic set-tings, need to be analyzed over the spatial and temporal domain in order to build dynamic models that provide a global insight of outbreaks' behaviour.
Transmission of an infectious disease may occur through several pathways: by means of contact with infected indi-viduals, by water, airborne inhalation, or through vector-borne spread. However, for the purpose of this study, the direct contact of susceptible individuals with an infected one will be considered as the main transmission medium of contagious diseases. Therefore, it is assumed that infec-tious diseases are diffused from individual to individual following a network of contact between them. Since this contact usually takes place in a geographical space, it is fairly natural to expect that the space plays an important role in the dynamics of infectious diseases [2]. Clear evi-dences that some infectious diseases in humans popula-tions spread geographically are the three well-known recent examples of communicable disease spatial advance in the United Kingdom [3] and Canada [4,5]. For this rea-son, it is required to understand the complex dynamics of contagious illnesses given certain spatial environments. Some of the most well known mathematical approaches are the differential equation models (DE) [6], and mean-field type models (MF) [7], which have not taken into account spatial and temporal factors such as variable pop-ulation density and dynamics, and they also ignore space implications within the system. The neglect of the spatial component in the formulation of epidemic models can be solved by describing the spatial behaviour with the use of complex systems theory approaches.
One of the challenges that face geographers, epidemiolo-gists and computer scientists working in the field of spa-tio-temporal modeling, is trying to understand the complexity of the spread of diseases. The search for an understanding of the non-linear behaviour of epidemics' spread and their causes in order to control them, has resulted in several attempts to model and predict the pat-tern of many different communicable diseases through a population. Models can be defined as an abstraction of the real world, regardless of type or complexity, they are basically simplifications of a real-life system, which can contain only some of the essential elements of it – as determined by the researcher -, models are not exact reproductions of reality and can be interpreted by differ-ent people in differdiffer-ent ways [8]. In spatial epidemiology,
models have been primarily used to facilitate an under-standing of the complexity of the interaction between the spread of a disease among different individuals and its impact on society.
It is for these reasons that the objective of this study is to develop and implement an agent-based modeling approach for the spread of a communicable disease. The theoretical framework will be implemented in a case study of measles to allow the creation, representation and execution of a communicable disease propagation simu-lation over space and time and in an urban environment. One of the most important factors that this study consid-ered is the complexity of mobile individuals in an urban setting with transportation network, their exchanges dur-ing the commutdur-ing time and some of the possible interac-tions among them in specific locainterac-tions such as work places, schools, university and shopping malls where peo-ple flow and where their contacts and interactions are dynamic.
Representation of Space and Time in Epidemic Modeling
Epidemics have been modeled making use of many differ-ent types of models, from those that are purely mathemat-ical to the spatially explicit ones. The mathematmathemat-ical modeling of epidemics has been the subject of a number of studies over the past century [9]. The formulation of these classic epidemic models enable the simulation of events for which laboratory experiments could not be conducted easily. The main assumption of this kind of models is that the population, in which a pathogenic agent is active, comprises different subgroups of individu-als and they examine only the temporal dynamics of the infection cycle.
Classic Epidemic Spread Models
based on the classification of the total population (SIR: Infected-Recovered, SEI: Recovered, and SEIR: Susceptible-Exposed-Infected-Recovered). These deterministic models assume that populations are completely mixed and ignore spatial effects of spread epidemics; also interaction between indi-viduals is neglected since they model populations as con-tinuous entities [12]. The SI, SIR, SEIR, SIS and SIRS models fail to effectively model spatial aspects of the spread of an epidemic, the individual contact process, and the effects of individual behaviours, among others [12]. For this reason, the development of new mathematical and computing methodologies are necessary.
Complex Systems Approaches for Epidemic Spread Models
Cellular automata (CA) theory has been used for mode-ling location-specific characteristics of susceptible popula-tions together with stochastic parameters that capture the probabilistic nature of disease transmission [13,14]. However, the representation of individuals' movement and interactions over the space was no presented. This is an important factor to consider in highly contagious dis-eases and therefore this methodology gave way to a new approach. Agent-based modeling (ABM), is also a bot-tom-up approach, similar to CA models, but has the advanced capability of tracking the movement of a disease and the contacts between each individual in a social group located in a geographic area [15,16]. The potentials that ABM possess to model epidemic spread, have been used in epidemiology to study and track the movement of infected individuals and their contacts in a social system [17,18].
Agent-based models allow interaction among individuals and are capable to overcome the limitations of different approaches such as cellular automata and classical epi-demic models, permitting to study specific spatial aspects of the spread of epidemics and addressing naturally sto-chastic nature of the epidemic process. Consisting of a population of individual actors or "agents", an environ-ment, and a set of rules [19], actions in ABM take place through the agents, which are simple, self-contained pro-grams that collect information from their surroundings and use it to determine how to act [20]. Modeling in epi-demiology using an agent-based approach pursues the progression of a disease through each individual (thus populations become highly heterogeneous by health sta-tus during simulations), and tracks the contacts of each individual with others in the relevant social networks and geographical areas (e.g., co-workers, schoolmates). All the rules for individual agent movement (e.g., to and from workplace and/or school) and for contacts with and trans-missions to other people are explicit [21].
ABMs and their ability to produce emergent macro-effects from micro-rules have served as a cornerstone for the development of different methodological frameworks in epidemiology [16]. Epidemiologic applications using ABM approach are mostly designed to allow epidemiolog-ical researchers to do a preliminary "what-if" analysis with the purpose of assessing systems' behaviour under various conditions and evaluating which alternative control poli-cies to adopt in order to fight epidemics such as smallpox [22-24]. Although these models effectively track the pro-gression of the disease through each individual, and track the contacts of each individual with others in the relevant system (social or natural), they need to add physical infra-structures such as road networks, and real geographic environments to account for more complex interactions among susceptible and infected individuals. Another important application of ABM in epidemiology is the modeling of vector-borne diseases and the changes in their incidence that are attributable to climatic changes. These models have been developed in order to allow the evaluation of impacts of climate change on vector borne diseases like malaria, as well as the a priori evaluation of environmental management-based interventions [25].
The spread of human epidemics strongly relies on the structure of the underlying social network, and it has become clear that differently structured networks lead to different types of epidemiology [26,27]. By modeling the correlations between individuals, it is possible to under-stand the role of spatial heterogeneity in spreading dynamics. The previous statements have lead to the devel-opment of different models in order to depict the spatial behaviour of diverse infectious diseases through struc-tured and realistic urban networks, for example, influenza [10,18,28-31], Mumps [32,33], West Nile virus [34,35], Tuberculosis (TB) [16], Lassa virus [18], among others. Some of the models mentioned represent the spatial dis-tribution and mobility of individuals making it possible to model the spatial heterogeneity in the disease transmis-sion. Nonetheless, one of their drawbacks is the lack of use of real landscape structures and integration with geospatial data and geographic information systems (GIS) to represent the continuous environment where the dis-crete individuals interact.
Methods
areas. At these geographical locations, individuals may interact among themselves in a group activity. Mobile activities are related to the daily commuting activities of individuals through the public transportation system. When a group disperses, an individual travels through space and time to a different location, often interacting and joining another group. The simulation of this popu-lation dynamic is essential to depict individuals' life path of movement through space and time. The disease propa-gation modeled in this study represents this movement path as a trajectory in space (movement from one place to another) through a transportation network and in time, expressed on hourly basis. In this fashion the daily activi-ties of commuting, studying, working and leisure time are simulated.
The methodology for this study involved the development of a complex algorithm composed by two parts. The first was designed to describe communicable disease stages, which is the generic infection model. The second repre-sents the rules that govern the life path behaviour of the agents and the infection behaviours that allow the trans-mission of the disease within a group of people in a city. Two scales are considered for the individual interactions in respect to transmission and propagation of the disease. One is at the individual scale considering the smallest space around a person when the disease can be transmit-ted. Second is the limit of boundaries of the city in which individuals move, live and interact with each other on a daily routine.
Generic Infection Model
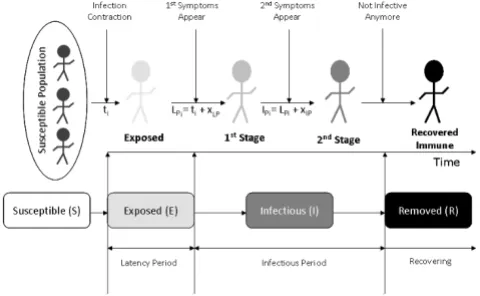
Highly communicable diseases may spread by airborne droplets or through direct contact with nasal or throat secretions emitted through sneezing or coughing of infected persons [36]. Symptoms may vary between dis-eases, but they generally are divided in two stages. In the first stage, after the exposure to the infectious agent the symptoms are nothing special and used to be associated with a typical cold. The second stage initiates after a cer-tain number of days and it is at that time when the specif-icity of the disease is very evident. After examining different compartmental models used in epidemiology, this simulation adopted the Susceptible-Exposed-Infec-tious-Removed (SEIR). The SEIR model successfully addresses a significant period of time during which an individual has been exposed to the infection but is not yet contagious: Exposed phase or latency period. The latency period is used to describe the period of time between exposure to the virus and the time the disease becomes apparent through symptoms and signs. The morbid period, also known as Infectious phase, is the period of time between the moment an individual starts being infectious until it is recovered (Figure 1).
In this study, for simplicity reasons, the model is devel-oped in such way that all recovered individuals cannot become infected again and they will remain immune. The initial conditions for the simulation are set up to represent a susceptible population, an immune population (due to previous communicable disease infection or vaccination), and infected population at the beginning of the outbreak. In order to design and implement the generic model, mathematical expressions are developed, so that the model can be used for different types of communicable diseases. As depicted in figure 1, latency period (LPi) and infectious period (IPi) are presented with following equa-tions:
where (ti) represents the one single day that an individual is exposed to the virus for the first time; (xLP) represents the number of days that have to elapse before the exposed individual to become infected; (xIP) corresponds to the number of days it takes for the individual to recover from the disease; (xLP) and (xIP) take different values for differ-ent diseases.
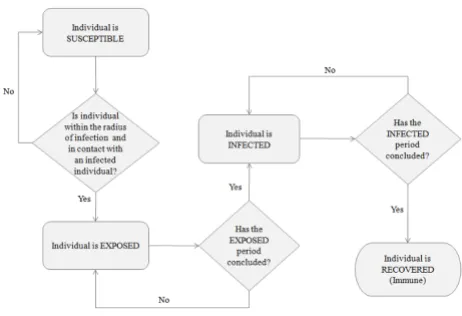
The rules that govern the unconscious biological process of disease spread are depicted in the flow diagram pre-sented in Figure 2, where each individual is reprepre-sented as an agent in the proposed model. Once an infectious
indi-LPi =ti+xLP, (1)
IPi =LPi+xIP, (2)
Different states of the SEIR infection model, to simulate the progress of and epidemic in a human population
Figure 1
Different states of the SEIR infection model, to simu-late the progress of and epidemic in a human popula-tion. LPi: latency period, IPi: infectious period, ti: first day that an individual is exposed to the virus for the first time, xLP: number of days for an exposed individual to become infec-tive, and xIP: number of days for an individual to recover
vidual arrives at a fixed location to perform any stationary activity (e.g., study, work, shopping, etc) a calculation is performed to determine the number of susceptible indi-viduals within its perimeter to be contagious (Pc). This area is calculated based on a radius (r) of 1 m distance from the infected individual, considered as the smallest distance at which an individual can contract the disease and get infected.
After determining the susceptible individuals within the infected persons' surroundings (Pc), the disease is trans-mitted to some of them.
Agent Based Model
The model proposed in this study attempts to realistically represent the behaviour of individuals' daily path in an urban setting, as well as characterize the natural biological process of the disease spread among individuals (Figure 3). So that, it is required to maximize the simplicity regarding the interactions that one can account between agents, which then allow maximizing the understanding of their dynamics. The agent based model operates on dis-crete time steps during which a population of individuals, represented as agents, moves through a geographical space, where daily activities are performed. In order to represent a normal daily routine, it is assumed that the length time for out-of-house daily activities for an individ-ual is 10 hours. Two hours are spent commuting via pub-lic transportation, and the other eight hours are spent either in work places, study places (high schools, univer-sities, community colleges, etc) or doing some leisure activities at places like shopping malls.
ABMs are best described in order of their major compo-nents: environment, agents and interactions. This model is implemented using georeferenced GIS data layers of an urban area in order to geographically represent the usual urban landscape where typical individuals' contact takes place. In order to account for some of the factors that may influence an epidemic in urban areas, the model was designed to include georeferenced information of popula-tion densities, different land uses and transportapopula-tion net-works. The flow diagram designed to represent the process of the disease propagation is used to explain the method for searching and querying the different geographic layers to determine the behaviour of the agents. As shown in fig-ure 4(c), the agent-based model has four different georef-erenced inputs; the first one (A) is the population of agents that represent the behaviour of individuals living in an urban area. The second (B) is the information regarding population density; this dataset allows the eval-uation of the number of people per square meter and thereby greater probabilities of getting the infection will be assigned to individuals that perform any stationary activity in these areas. The third (C) is the transportation network, which is used by the agents to commute from one place to another within the municipality. Finally the fourth input (D) represents three different land use types: residential areas (houses, townhouses and apartments), work and study areas (institutional and commercial buildings), and entertainment areas (shopping malls).
Pc=pr2 (3)
Flow diagram representing different infection phases Figure 2
Flow diagram representing different infection phases.
Process of the epidemic spread AB model for a single time step representing daily activity of individuals' activities and their interactions in an urban environment
Figure 3
Only one type of agent is used in this model to represent individuals and it has no attributes of age or gender. When the model is initialized and the agents are ran-domly added to residential areas, the georeferenced loca-tion of each individual is established and stored in the individuals' memory to recall its point of origin. After this initial stage, the agents simulate individuals' daily com-muting to work places or study buildings. The entire sus-ceptible population is divided into 70% of workers and 30% of students. After the first commuting hour, the workers go to work places and the students go to study areas. Figure 4(b) depicts the closed geographic space where individuals interact amongst themselves and trans-mit the disease. The movement of the individuals through the transportation network simulates the commuting behaviour, and was accomplished using a geographic
information system (GIS) that holds the spatial locations of all the roads and stores the topological relationships between them. Therefore, if an agent needs to get to a des-tination, it needs to search the transportation network dataset in order to know which roads it has to travel along and then actually plot the shortest route to get to the desired point. The routing algorithm works by firstly building a list of coordinates which the agent must pass through to get to its destination and then moving along the planned route. The flow diagram shown in figure 5 illustrates the behaviour that determines different activi-ties performed by diverse individuals.
The agents are mainly distinguished by their health status (e.g. susceptible, exposed, infected, immune), movement rules, and mode of infection transmission. For the pur-(a) Geographic area: City of Burnaby, Canada, with the relevant land use classes; (b) Geographic space of individual's interac-tions; (c) Geospatial data inputs
Figure 4
pose of this model simulation, only public places (work places, schools and shopping malls) were considered for the propagation of the disease, this implies that the infec-tion rules are not effective during the night time period in the residential areas or elsewhere.
An infection can only be transmitted from an infected per-son in a contagious stage to individuals that are healthy (susceptible) and within the established perimeter (Pc) for the disease to be communicable – explained in equa-tion 3. The total number of individuals that are exposed within this perimeter (Pc) depends also on the population density where they are located at the moment of the inter-action with and infected agent. If a group of susceptible individuals interact within the perimeter (Pc) of an infected individual, not all of them will contract the dis-ease and therefore the rate of infection is determined using low, medium and high population densities, in order to calculate the number of individuals that are exposed to the disease. The fact that disease spread risk is considered to be higher for individuals living in highly dense populated urban areas is therefore taken in consid-eration [37]. Assuming a direct relationship between pop-ulation and rate of infection, higher rates are given to those individuals located in areas with high density pop-ulation. The flow diagram which describes the infection model and therefore the disease propagation among indi-viduals is presented in Figure 6.
The population of agents is held constant during a simu-lation run. Even if they have recovered, immune agents are not removed from the population. Agents are thus characterized by their location in the environment and by their internal state (status), which can be: susceptible, exposed, infected or recovered (immune). Once an agent is exposed, it remains infected for certain amount of days until it loses the infection status and recovers. This indi-vidual, therefore, remains immune for the rest of the sim-ulation.
Model implementation
Case Study
For implementation purposes a simulation of measles epidemic in a human population located within the city of Burnaby, BC, Canada, is used to implement and illus-trate the methodological framework. There is clear evi-dence that infectious diseases in human populations spread geographically. A known example of such commu-nicable disease spread is the measles outbreak in the met-ropolitan area of Metro Vancouver in British Columbia, Canada. On January 28th 1997, three cases of measles among students attending a public university in the city of Burnaby were initially reported to the British Columbia Centre for Disease Control; by April 1st 1997, 107 cases of measles had been confirmed to be spread in some sur-rounding areas linked to Simon Fraser University (SFU) [38]. Measles (also known as rubeola) is a disease caused by a virus, specifically a paramyxovirus of the genus Mor-Flow diagram that characterizes daily activities of individuals within the city
Figure 5
billivirus. This infectious disease spread through contact with fluids from an infected person's nose and mouth, either directly or through aerosol transmission. Measles is highly contagious, and it is known and stated by epidemi-ologists that 90% of people without immunity sharing daily activities with an infected person will catch it [36].
Geospatial Data Sets
Simulation of a measles epidemic spread in a geographic area is computationally intensive and requires the use of georeferenced data sets and a limited number of individ-uals interacting in the urban space. For computational simplicity, the use of geospatial data for the City of Burn-aby, Canada has been chosen to implement the model. The selection of the area was made based on the structure of the area and its dynamics. Burnaby is the city immedi-ately east of Vancouver and makes part of the Metro Van-couver district. It is the third-largest and most populated urban center in British Columbia. The city features high and low density residential areas, major commercial town centers, industrial complex, rapid transit, and major
post-secondary institutions including one public university and a technical institute (Figure 4). The complexity of urban dynamics within the City of Burnaby makes is a suitable study site to implement the proposed model. Geoferenced data sets are derived from 2001 population census data from Statistics Canada [39] for population densities, from Metro Vancouver [40] for land use data and from the Greater Vancouver Transportation Authority (Translink) [41] for transportation network data.
Agent-based Simulation Toolkit
In order to implement the designed ABM, Repast Sim-phony (RepastS) and some of its Java libraries [42] were used. RepastS extends the Repast portfolio by offering a new approach to simulation development and execution, including a set of advanced computing technologies for applications such as disease spread simulation. In addi-tion to the integrated library of classes for agent-based simulations, this toolkit allows simulations within a geo-graphic information system environment.
Flow diagram for the infection rules that describe the disease propagation among individuals at physically fixed location Figure 6
RepastS introduced the context and projection concepts. The context is basically a bucket that is used to hold a pop-ulation of agents but does not give agents any concept of space or relationships. Once the agents are in a context, projections can give the agents a space and can define their relationships. For example, GIS projections give each agent a spatial location and Network projections allow relationships between agents to be defined (e.g. a trans-portation network). These new concepts allow the model implementation having agents with a spatial location and movement around a geographic environment using the transportation network. In order to link the agent-based model to a GIS it is necessary to code the instructions that allow the ABM to read the GIS files (shapefiles). Hence, the individuals interact among themselves within the geo-graphic space represented in the model (Figure 7). The agent-based simulation created for this study is a collec-tion of agents and a model that is in charge of setting up and managing the execution of these agents' behaviours and the spatial relationship between them and their urban environment. The developed model is responsible for set-ting up and controlling simulation visualization, data recording and analysis.
Implementation
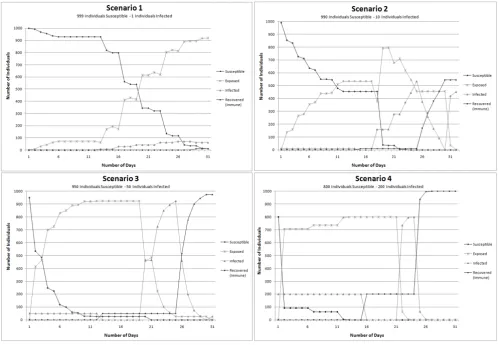
The entire population of the city cannot be taken in con-sideration due to computational reasons. In addition, it is expected that within the city not everyone is always com-muting and interacting at the same time. Only a percent-age of the population is in labour force or are students, therefore a limited number of individuals has been cho-sen for the simulations [39]. The model implementation is accomplished by using 1000 individuals involved in a measles epidemic and interacting at a city scale. The mea-sles SEIR model timeline adopted makes use of 12 days for the latency period and 8 days for the infectious period. Four scenarios are designed to illustrate different ratio of susceptible versus infected individuals: a) Scenario 1: 999 susceptible individuals and 1 infectious individual, b) Scenario 2: 990 susceptible individuals and 10 infectious individuals, c) Scenario 3: 950 susceptible individuals and 50 infectious individuals, d) Scenario 4: 800 susceptible individuals and 200 infectious individuals. The model was tested using a time frame of sixty days for Scenario 1 and thirty days for Scenario 2, 3, and 4 to observe and contrast the evolution and spread of the disease trough time in the study area shown in figure 4.
Graphical user interface (GUI) developed for the model implementation. Dots represent the individuals moving within an urban environment
Figure 7
The graphical user interface (GUI) (Figure 7) was devel-oped to add flexibility to the implementation and model output scenarios visualization capability. The GUI allows different users to create and test various scenarios by changing the total population and the ratio of susceptible, infected and immune individuals that take part of the sim-ulation. Likewise, the time frame can be modified and the GIS layer with the agents' attributes can be stored for sta-tistical analysis and the colours of the display can be also modified by the user. The geographic display in the GUI permits the visualization of urban landscape where the individuals move. Through the GUI simulation parame-ters can be changed at anytime to visualize new scenarios
Results and discussion
The results are obtained based on simulations for each of the four scenarios. Figure 8 depicts the measles infection progress using Scenario 1, (a) is portraying day one of the simulation, (b), (c) and (d) depict respectively day ten, twenty and thirty of the epidemic spread for a closed pop-ulation of 1000 people. Figure 9 presents the number of daily exposures, infections and recoveries for a measles epidemic over a period of sixty days for Scenario 1. These results demonstrate that during the first day of interaction amongst population, at least 1% of the population were in contact with the infected individual and therefore was exposed to the virus. Five days after the first contact between some of the population and the infected individ-ual, the rate of contagion remains stable with an average of less than one percent of the population interacting and being exposed to the virus due to the lack of diagnosis and removal of the infected individual from the susceptible population.
From the fifth day to the eleventh day there are no new contagious individuals, but the ones that have been exposed to the virus are about to become infectious to their surrounding coworkers, classmates or people shar-ing the same free time daily activity (e.g. visitshar-ing the mall). The stability in the number of individuals infected between the fifth and the thirteenth day is the result of the stationary activities performed by the individuals who usually share with the same group. This steadiness is also product of low interaction rates within the population through the entire city due to some concentration of exposed individuals in geographical locations like schools and university. Another reason for this steadiness is that the agent-based simulation of the disease propagation depends on the increase of individualized infection life paths to peak or decline over time.
On the thirteenth day the number of individuals exposed decrease from the day before, and this was due to the evo-lution from the exposed state of health to the infectious
state of health. The thirteenth day marked the increment in the infected population and since more individuals were able to transmit the virus, the percentage of the pop-ulation infected increased from one day to the other by two percent. After day sixteen the number of individuals infected increased almost exponentially. The spatial distri-bution of the simulated agents located at geographically fixed locations is portrayed in figure 8, representing spa-tial locations of the individuals during the first, tenth, twentieth and thirtieth day. The agents are initially located at residential areas. After the first hour of the day during which the commuting takes place, agents are relocated to workplaces, schools or university, to interact with their coworkers or classmates that are at the same location. Dif-ferent health statuses are represented by difDif-ferent shapes to show the stages of the epidemic in a spatial context and also through different moments in time.
These other scenarios were performed in order to obtain more insights about the dynamics of the disease spread under diverse circumstances. For this purpose the amount of initial ratio between susceptible and infected individu-als in a specific population was modified for each sce-nario; these scenarios also allowed the model performance evaluation. Figure 10 demonstrates different rates progress in the spread of the disease, due to changes in the initial number of infected individuals.
Comparing Scenario 1 and Scenario 2 it is evident that the exponential increase in the population exposed is almost similar, but the time frame changes significantly. This sug-gests that in a close population interacting on daily basis, the probability of getting the infection increases propor-tionally to the number of the infectious agents in the envi-ronment. For the Scenario 3 and Scenario 4 the amount of initial infected individuals has a considerable influence in the spreading process of the epidemic. Although Scenarios 3 and 4 have respectively 5.3% and 25% of the initial pop-ulation infected, the spreading phenomenon is not signif-icantly different. In Scenario 3 after the third day, 70% of the entire population of susceptible individuals had been exposed to the disease and in Scenario 4 this spreading process occurred between the first two days.
Spatial distribution of Susceptible-Exposed-Infected-Immune population in an urban area on two different days Figure 8
simulation, is exposed to the disease after a time lapse of thirty days. In reality 107 cases were reported after sixty days and Scenario 1 reported 139 infected people after forty five days; the difference in the outcomes from Sce-nario 1 and the numbers described in reality is due to a series of reasons. First, the geographic area of individuals' interaction is a limited (Figure 4) and second, the popula-tion of individuals is closed. Finally, the simulapopula-tion implemented in this study does not take into account any precaution measure to immunized susceptible individu-als in order to avoid the disease and decrease the number of infected individuals.
The other reasons why the simulation outcome of the measles spread is slightly different from the one that occurred in 1997, is the fact that population was not divided by age groups, and also that the entire population taken in the model was considered as susceptible. In real-ity this is not the case due to a high percent of population has been vaccinated for this kind of diseases. The age fac-tor is a very important parameter to consider due to young
population possesses a higher probability to contract the disease and if taken into account this would alter the model outcomes. Furthermore, this study did not have access to real data on the individual measles cases due to confidentiality issues. In order to improve the accuracy of this model in further developments, it is important to divide the population into different age groups, and pro-vide the information on vaccination status of each indi-vidual. In terms of improving agent behaviour, addition of the capability for an agent to have a degree of choice or willingness to stay at home and stop moving at the appearance of the first symptoms, would be beneficial. Such individuals help to slow down the disease spreading process and the epidemic would be modeled more realis-tically.
Sensitivity Analysis of Model Outcomes
In order to assess the impact of the parameters and deci-sion rules within the model, a sensitivity analysis (SA) was performed to determine how model is sensitive to changes in the parameters value. Sensitivity analyses are Graphical representation of the disease spread progression comparison of the proportion of individuals in each health state through time
Figure 9
necessary to explore the behaviour of complex system models, because the structural complexity of the modeled process and the model is coupled with a high degree of uncertainty in estimating the values of many of the input parameters [43]. A sensitivity analysis quantifies how changes in the values of the input parameters alter the value of the outcome. There are two classes of SA tech-niques – univariate and multivariate [43]. In the univari-ate SA the model outcome is analyzed with respect to the variation of one parameter at a time whereas the other parameters of the system remain constant. The multivari-ate SA is concerned with systematically varying multiple input parameters and determining the impacts on the analyzed outcome [44,45].
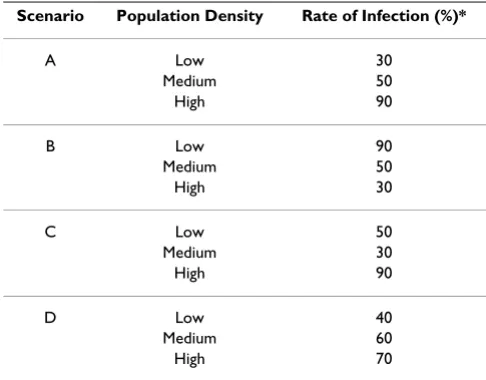
For this study purposes a univariate technique was used. The first parameter of the sensitivity analysis is the rate of infection based on population density, and it was per-formed using four different scenarios: A, B, C, and D to
initialize the simulation. Table 1 provide the variations of the rate of infection parameter based on population density low/medium/high. The second parameter for sensitivity analysis was related to the variations to time spent for dif-ferent activities, was performed using three different sce-narios: E, F, and G. The variations of overall time that individuals spent for different activities (e.g. working and/or studying, going to shopping malls, etc), are presented in Table 2. The disease spread simulations for the SA were produced for temporal intervals of 30-days using a one-hour time step. A closed population of 1000 individuals was chosen, where 999 individuals were susceptible and 1 individual was infected. The model outputs were then vis-ually compared for all these scenarios to see how parame-ters impact the model performance.
The simulation results obtained are used to evaluate the sensitivity of the model output to variations in the rate infection and they are presented in Figure 11, and sensitiv-Graphical representation of the variation in number of cases of Susceptible-Infected-Exposed-Recovered individuals within the population and for the simulation outcomes for four scenarios
Figure 10
ity to changes in time spent for different activities are pro-vided in Figure 12.
Figure 11 presents the number of daily exposures, infec-tions and recoveries for a measles epidemic over a period of thirty days for the four scenarios – A, B, C and D. These results indicated that the model is sensitive to the rate of infection parameter, based on the population density. Comparing Scenario A and B it can be observed that changing the rate of infection from 30% to 90% in areas with low population density increased the number of individuals exposed to the disease in a shorter period of time. Evaluating Scenario A and C where the rates of infec-tion were changed from 50% to 30% in areas with medium population density, it can be observed that the number of individuals exposed to the disease did not
increase at the same rate. In Scenario A the greatest increase in the number of exposed individuals was observed in the day sixteen, meanwhile for Scenario C it occurs during the day twenty. Comparing Scenarios A and D smaller changes of the rate of infection based on popu-lation density lead to different simupopu-lation outcomes. Even though, the number of individuals exposed seems similar in both scenarios until day fifteen, afterwards the disease progress changed significantly.
Figure 12 presents the number of daily exposures, infec-tions and recoveries for a measles epidemic over a period of thirty days for the three scenarios – E, F, and G. The results indicate that the model outcomes vary when the time spent by individuals in different daily activities changes. In Scenario E and G, when 30% of the individu-als in the simulation are set to spend four hours working/ studying the number of individuals exposed to the disease appears to be similar although these individuals spent dif-ferent amounts of time in leisure activities. However, when the time spent working/studying is changed to two hours as in Scenario F, the disease progression varies by slowing down the process of spread among individuals trough the time.
Conclusion
This study proposes a GIS-agent based model that simu-lates the outbreak of a communicable disease, in an urban area where different activities take place during a daily cit-izens' routine.
The results of disease propagation simulation indicate that the model is successfully able to generate various sce-narios of an outbreak in complex and realistic geographic urban settings by incorporating movement in the agent entities. The addition of mobility allow realistic emula-tion of daily behaviours of individuals of a populaemula-tion that interact among themselves and that perform station-ary activities in fixed spatially located areas after moving from one place to another. The model implemented in this study can be extended to incorporate parameters such as population gender, age, and ethnicity in order to intro-duce levels of susceptibility in different groups of individ-uals. Likewise, decisions taken by infected individuals such as stay at home to avoid the contact and spread of the disease can be included. The advantage of the GIS-AB model designed in this study is that any other communi-cable disease spread can be simulated by simple adjusting the modeled disease timeline and/or the infection model and modifying the transmission process.
The dynamics of the spread were implemented for the case of measles propagation and analyzed using the simu-lation outcomes. The output results from the behaviour of
Table 1: Set of values used to evaluate sensitivity to changes in rate of infection based on population density
Scenario Population Density Rate of Infection (%)*
A Low 30
Medium 50
High 90
B Low 90
Medium 50
High 30
C Low 50
Medium 30
High 90
D Low 40
Medium 60
High 70
* Percentage of EXPOSED individuals from the total SUSCEPTIBLE ones within the perimeter of contagion (Pc)
Table 2: Set of values used to evaluate sensitivity to changes in time spent for different activities
Scenario Activity Time Spent (Hours)*
E Commuting 2
Work 4
Leisure 4
F Commuting 2
Work 2
Leisure 4
G Commuting 2
Work 4
Leisure 2
the disease spread demonstrated that global mixing in a closed population produces that almost the total number of individuals in the simulation becomes exposed after twenty five days. Furthermore, this study examined the impact of model parameters on the generated model out-puts by determining the level of sensitivity to changes in the rate of infection based on population density and changes in time spent for different activities throughout seven different scenarios. Theses analyses are important since uncertainties embedded in the model outcomes are often either ignored or not adequately addressed. The pro-posed modeling approach offers a mean to analyze "what if" scenarios in case of a disease spread at a city-scale.
Some limitations of this model are with respect to model validation. The lack of information and real geographical location of the individual cases occurred during the 1997 outbreak and how these were treated is making this model theoretical. Often this type of data is not available due to confidentiality reasons, making very difficult to perform
the model validation. Computational limitations are also an issue because not all the population can be considered given the limited computer memory capacity. This conse-quently affects the number of contacts between individu-als within the city that can be simulated; increasing the interaction to such a point that the infection progress can appear faster than it may happens in reality, as individuals interact only through a limited network of transportation. Further work on model improvement includes agents endowed with additional attributes that allow a better insight of different groups of populations (e.g., ages, gen-der, ethnic group, etc), their daily habits and interactions among them, as well as degrees of age group susceptibil-ity.
The model presented is a prototype that can be used as a laboratory to test possible outcomes and scenarios under a contagious disease outbreak at city-scale and with varia-tions of different model parameters settings. The out-comes of the model simulations allow stating the Graphical representation of model sensitivity to changes in rate of infection based on the population density
Figure 11
importance of achieving sufficient knowledge about the spatial interactions of individuals and their contact net-works. Further improvements to this approach would help to model and analyze the risk of disease spread through socially connected groups. Likewise, the results of this simulation can help to improve comprehension of the disease spread dynamics and to take better steps towards the prevention and control of an epidemic.
Competing interests
The authors declare that they have no competing interests.
Authors' contributions
The second author provided the initial ideas and model conceptualization. The first author programmed and coded the software routines and developed the GUI that permitted the model implementation. Both authors were involved equally in the design, development and
imple-mentation of the model as well as in the writing of the paper.
Acknowledgements
Partial support of this study was made through the Natural Sciences and Engineering Research Council (NSERC) of Canada Discovery Grant Pro-gram awarded to the second author. Authors are thankful for the valuable comments of two anonymous reviewers provided in an earlier draft of this paper.
References
1. Connolly M, Gayer M, Ryan M, Salama P, Spiegel P, Heymann D:
Communicable diseases in complex emergencies: impact and challenges. Lancet 2004, 364:1974-1983.
2. Fuks H, Duchesne R, Lawniczak AT: Spatial correlations in SIR epidemic models. WSEAS MATH 2005; Cancun, Mexico 2005. 3. Outbreak of Measles Epidemic in UK [http://www.medin
dia.net/news/view_news_main.asp?x=11342]
4. Mumps Outbreak Continues [http://www.gov.ns.ca/news/ details.asp?id=20070413002]
5. Mumps: Coming Soon to A Place Near You [http://www.fra serhealth.ca/HealthTopics/CommunicableDiseases/mumps]
Graphical representation of model sensitivity to changes in time spent for different activities Figure 12
Publish with BioMed Central and every scientist can read your work free of charge
"BioMed Central will be the most significant development for disseminating the results of biomedical researc h in our lifetime."
Sir Paul Nurse, Cancer Research UK
Your research papers will be:
available free of charge to the entire biomedical community
peer reviewed and published immediately upon acceptance
cited in PubMed and archived on PubMed Central
yours — you keep the copyright
Submit your manuscript here:
http://www.biomedcentral.com/info/publishing_adv.asp
BioMedcentral 6. Ching Fu S, Milne G: Epidemic Modelling Using Cellular
Automata. ACAL2003: The First Australian Conference on Artificial Life; Canberra, Australia 2003.
7. Kleczkowski A, Grenfell BT: Mean-field-type equations for spread of epidemics: The 'small world' model. Physica A 1999,
274:355-360.
8. Sattenspiel L: Infectious diseases in the historical archives: a modeling approach. In Human Biologists in the Archives: Demogra-phy, Health, Nutrition and Genetics in Historical Populations Cambridge SA. UK: University Press; 2003:234-265.
9. Bauch CT: The Role of Mathematical Models in Explaining Recurrent Outbreaks of Infectious Childhood Diseases. In
Mathematical EpidemiologyVolume 1945. Edited by: Brauer F, Driess-che Pvd, Wu J. Springer-Verlag; 2008:297-319.
10. Bian L, Liebner D: Simulating spatially explicit networks for dis-persion of infectious diseases. In GIS, Spatial Analysis and Modeling
Edited by: Maguire D, Goodchild MF, Batty M. Redlands, California: ESRI Press; 2005:245-264.
11. Kermack W, McKendrick A: A Contribution to the Mathemati-cal Theory of Epidemics. Proceedings of the Royal Society of London A 1927, 115:700-721.
12. Di Stefano B, Fuks H, Lawniczak AT: Object-Oriented Implemen-tation of CA-LGCA Modelling Applied to the Spread of Epi-demics. 2000 Canadian Conference on Electrical and Computer Engineering, IEEE 2000, 1:26-31.
13. Sirakoulis GC, Karafyllidis I, Thanailakis A: A cellular automaton model for the effects of population movement and vaccina-tion on epidemic propagavaccina-tion. Ecological Modelling 2000,
133:209-233.
14. Zhen J, Quan-Xing L: A cellular automata model of epidemics of a heterogeneous susceptibility. Chinese Physics 2006,
15:1248-1256.
15. Bagni R, Berchi R, Cariello P: A comparison of simulation models applied to epidemics. Journal of Artificial Societies and Social Simula-tion 2002, 5:33.
16. Patlolla P, Gunupudi V, Mikler AR, Jacob RT: Agent-Based Simula-tion Tools in ComputaSimula-tional Epidemiology. In 4th International Workshop, International Conference on Innovative Internet Community Sys-tems (I2CS '04); June 21–23; Guadalajara, Mexico Springer Berlin/Hei-delberg; 2004:212-223.
17. Gordon TJ: A simple agent model of an epidemic. Technological Forecasting and Social Change 2003, 70:397-417.
18. Dunham JB: An Agent-Based Spatially Explicit Epidemiologi-cal Model in MASON. Journal of Artificial Societies and Social Simula-tion 2005, 9:.
19. Epstein JM, Axtell RL: Growing Artificial Societies: Social Science From the Bottom Up Washington, D.C.: Brookings Institution Press MIT Press; 1996.
20. Gilbert N, Troitzsch K: Simulation for the Social Scientists Berkshire, England: McGraw Hill; 2005.
21. Epstein J, Cummings D, Chakravarty S, Singa R, Burke D: Toward a Containment Strategy for Smallpox Bioterror: An Individual-Based Compu-tational Approach Washington, D.C.: Brookings Institution Press; 2004. 22. Chen LC, Kaminsky B, Tummino T, Carley KM, Casman E, Fridsma D, Yahja A: Aligning Simulation Models of Smallpox Outbreaks.
Tucson, AZ: Center for Computational Analysis of Social and Organ-izational Systems (CASOS); 2004.
23. Eidelson BM, Lustick I: VIR-POX: An Agent-Based Analysis of Smallpox Preparedness and Response Policy. Journal of Artificial Societies and Social Simulation 2004, 7:23.
24. Carley KM, Fridsma DB, Casman E, Yahja A, Altman N, Chen L-C, Kaminsky B, Nave D: BioWar: Scalable Agent-Based Model of Bioattacks. IEEE Transactions on Systems, Man, and Cybernetics, Part A: Systems and Humans 2006, 36:252-265.
25. Bomblies A, Duchemin J-B, Eltahir E: Hydrology of malaria: Model development and application to a Sahelian village. Water Resources Research 2008, 44:26.
26. Keeling M: The effects of local spatial structure on epidemio-logical invasions. Proceedings of the Royal Society of London B 1999,
266:859-867.
27. Chowell G, Hyman J, Eubank S, Castillo-Chavez C: Scaling laws for the movement of people between locations in a large city. Physical Review E 2003, 68:661021-661027.
28. Bian L: A conceptual framework for an individual-based spa-tially explicit epidemiological model. Environment and Planning B: Planning and Design 2004, 31:381-395.
29. Yang Y, Atkinson PM: An Integrated ABM and GIS Model of Infectious Disease Transmission. Computers in Urban Planning and Urban Management – CUPUM'05; 29 June – 1 July; London, England
2005.
30. Ferguson NM, Keeling MJ, Edmunds WJ, Gani R, Grenfell BT, Ander-son RM, Leach S: Planning for smallpox outbreaks. Nature 2003,
425:681-685.
31. Bian L, Liebner D: A network model for dispersion of commu-nicable diseases. Transactions in GIS 2007, 11:155-173.
32. Simoes JM: Modelling the Spreading of Infectious Diseases using Mobility Networks. CUPUM 2005 The Ninth International Conference on Computers in Urban Planning and Urban Management; July; London, UK 2005.
33. EpiSIM – Software for Spatial Epidemic Simulation [http:// www.casa.ucl.ac.uk/joanamargarida/websiteProject/]
34. Bouden M, Moulin B, Gosselin P: The geosimulation of West Nile virus propagation: a multi-agent and climate sensitive tool for risk management in public health. International Journal of Health Geographics 2008, 7:35.
35. Li Z, Hayse V, Hlohowskyj I, Smith K, Smith R: Agent-based Model for Simulation of West Nile Virus Transmission. Proceedings of the Agent 2005 Conference on Social Dynamics: Interaction, Reflexivity and Emergence; June 26–28; Chicago, USA 2005:14.
36. Vaccine-Preventable Diseases Measles [http://www.phac-aspc.gc.ca/im/vpd-mev/measles-eng.php]
37. Yang Z, Haas Pd, Wachmann C, Soolingen Dv, Embden Jv, Andersen A: Molecular epidemiology of tuberculosis in Denmark in 1992. Journal of Clinical Microbiology 1995, 33:2077-2081.
38. Bell A, King A, Pielak K: Epidemiology of measles outbreak in British Columbia- February 1997. Canada Communicable Disease Report 1997, 23:49-51.
39. Census Canada 2001 [http://www.statcan.gc.ca/]
40. Metro Vancouver Regional District [http://www.metrovancou ver.org]
41. The Greater Vancouver transit authority [http:// www.translink.bc.ca]
42. Repast Simphony [http://repast.sourceforge.net/index.html] 43. Kocabas V, Dragicevica S: Assessing cellular automata model
behaviour using a sensitivity analysis approach. Computers, Environment and Urban Systems 2006, 30:921-953.
44. Iman RL, Helton JC: An Investigation of Uncertainty and Sensi-tivity Analysis Techniques for Computer Models. Risk Analysis
1988, 8:71-90.