R E S E A R C H
Open Access
Classification of occupational activity
categories using accelerometry: NHANES
2003
–
2004
Jeremy A. Steeves
1*, Catrine Tudor-Locke
2, Rachel A. Murphy
3, George A. King
4, Eugene C. Fitzhugh
5and Tamara B. Harris
3Abstract
Background:An individual’s occupational activity (OA) may contribute significantly to daily physical activity (PA) and sedentary behavior (SB). However, there is little consensus about which occupational categories involve high OA or low OA, and the majority of categories are unclassifiable with current methods. The purpose of this study was to present population estimates of accelerometer-derived PA and SB variables for adults (n= 1112, 20–60 years) working the 40 occupational categories collected during the 2003–2004 National Health and Nutrition Examination Survey (NHANES).
Methods:ActiGraph accelerometer-derived total activity counts/day (TAC), activity counts/minute, and proportion of wear time spent in moderate-to-vigorous PA [MVPA], lifestyle, and light PA organized by occupational category were ranked in ascending order and SB was ranked in descending order. Summing the ranks of the six
accelerometer-derived variables generated a summary score for each occupational category, which was re-ranked in ascending order. Higher rankings indicated higher levels of OA, lower rankings indicated lower levels of OA. Tertiles of the summary score were used to establish three mutually exclusive accelerometer-determined OA groupings: high OA, intermediate OA, and low OA.
Results:According to their summary score,‘farm and nursery workers’were classified as high OA and‘secretaries, stenographers, and typists’ were classified as low OA. Consistent with previous research, some low OA occupational categories (e.g.,‘engineers, architects, and scientists’,‘technicians and related support occupations’,‘management related occupations’,‘executives, administrators, and managers’,‘protective services’, and‘writers, artists, entertainers, and athletes’) associated with higher education and income had relatively greater amounts of MVPA compared to other low OA occupational categories, likely due to the greater percentage of men in those occupations and/or the influence of higher levels of leisure time PA. Men had more TAC, activity counts/minute and time in MVPA, but similar proportions of SB compared to women in all three OA groupings.
Conclusions:Objectively measured PA allowed for a more precise estimate of the amount of PA and SB associated with different occupations and facilitated systematic classification of the 40 different occupational categories into three distinct OA groupings. This information provides new opportunities to explore the relationship between OA and health outcomes.
Keywords:Occupational activity, Accelerometer, Work, Employment, Classification, Cross-sectional
* Correspondence:[email protected] 1
Department of Kinesiology, University of Wisconsin-Milwaukee, 2400 E Hartford Avenue, Milwaukee, WI 53201, USA
Full list of author information is available at the end of the article
Background
The benefits of regular physical activity (PA), including lowered mortality rates, improved function and en-hanced quality of life, are widely recognized [1–4]. An individual can accumulate daily PA through occupational demands, transportation, household tasks, or engage-ment in leisure time PA (LTPA) [5, 6]. Higher levels of LTPA have been promoted as health enhancing, [2, 3] while the effects of occupational activity (OA) on health
remain inconclusive [7–9]. Many studies have shown
high levels of OA to be associated with improved health, [7, 10–13] and the detrimental effects of large amounts of occupational sitting [14, 15]. In contrast, other studies have found high levels of OA to have deleterious health effects [9, 16–19].
Due to the substantial amount of time relegated to paid work in today’s society [20–22], an individual’s oc-cupation likely has a strong influence on daily PA and sedentary behaviors (SB) (e.g., does their job require mostly sitting, standing, walking, engaging in repetitive tasks, or heavy labor) [23]. Also OA and LTPA patterns are profoundly different in varying occupations. Blue collar workers may be highly physically active during work, and highly sedentary during leisure, while white collar workers may engage in greater LTPA, after a sed-entary day at the office [24, 25]. While extensive re-search on the comparison of physical demands between different occupations has been performed for decades [26–28], the incorporation of OA into the measurement of daily PA is still evolving [29, 30]. Including OA in addition to LTPA will allow a better understanding of the prevalence of daily PA, and inform interventions aimed to improve health, increase productivity, and re-duce work-related injury of the employed population.
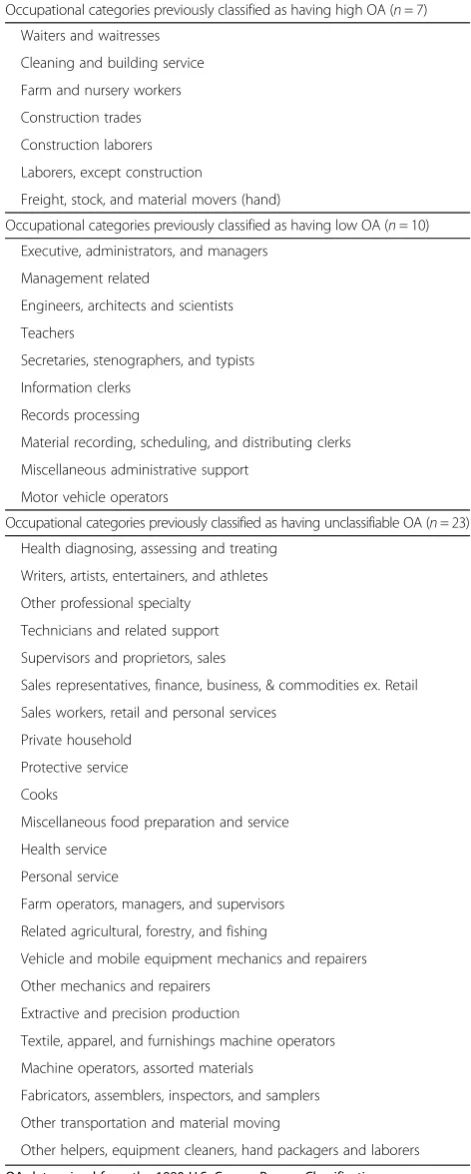
Based on self-reported occupation, the National Health and Nutrition Examination Survey (NHANES) III used the 1980 U.S. Census Bureau Classification Codes to clas-sify respondents into 40 defined and diverse occupational categories according to work performed, required skills, education, training, and credentials [31] (Table 1). Previ-ously King et al. [32] used the occupation descriptions of the U.S. Department of Labor as a reference to assign each of the 40 occupational categories to one of three broad OA groupings: (a) high amounts of OA, (b) low amounts of OA, or (c) unclassifiable amounts of OA [32]. Seven of the 40 occupational categories were considered to repre-sent high amounts of OA (e.g.,‘cleaning and building ser-vice’,‘construction laborers’) and 10 were considered to represent low amounts of OA (e.g.,‘secretaries’,‘teachers’). The remaining 23 occupational categories were consid-ered too ambiguous to classify as either high or low OA and thus were labeled as unclassifiable OA (e.g.,‘health services’, ‘sales workers, retail and personal services’) (Table 1). These three general groupings have been used
Table 1High, low, and unclassifiable occupational activity (OA) groupings assigned by an expert panel
Occupational categories previously classified as having high OA (n= 7) Waiters and waitresses
Cleaning and building service Farm and nursery workers Construction trades Construction laborers Laborers, except construction
Freight, stock, and material movers (hand)
Occupational categories previously classified as having low OA (n= 10) Executive, administrators, and managers
Management related
Engineers, architects and scientists Teachers
Secretaries, stenographers, and typists Information clerks
Records processing
Material recording, scheduling, and distributing clerks Miscellaneous administrative support
Motor vehicle operators
Occupational categories previously classified as having unclassifiable OA (n= 23) Health diagnosing, assessing and treating
Writers, artists, entertainers, and athletes Other professional specialty
Technicians and related support Supervisors and proprietors, sales
Sales representatives, finance, business, & commodities ex. Retail Sales workers, retail and personal services
Private household Protective service Cooks
Miscellaneous food preparation and service Health service
Personal service
Farm operators, managers, and supervisors Related agricultural, forestry, and fishing
Vehicle and mobile equipment mechanics and repairers Other mechanics and repairers
Extractive and precision production
Textile, apparel, and furnishings machine operators Machine operators, assorted materials
Fabricators, assemblers, inspectors, and samplers Other transportation and material moving
Other helpers, equipment cleaners, hand packagers and laborers
previously by other researchers [12, 21, 33], with analyses focused primarily on the two more extreme and certain groupings. Since the unclassifiable OA group contains the majority of the occupational categories, (23 of the 40 cat-egories) limiting analysis to only the high and low OA groupings restricts what can be inferred about the rela-tionship between OA and health outcomes.
The 2003–2004 NHANES contained the same 40
oc-cupational categories, and included objectively measured PA and SB collected with accelerometry. This serendipit-ous coupling presented an opportunity to categorize in-dividuals into new OA groupings using objective data. Therefore, the purpose of this analysis of the 2003–2004 NHANES occupation and accelerometry data was to classify the 40 occupational categories into high OA, intermediate OA, and low OA groupings based on ob-jectively measured PA and SB.
Methods
As a continuous surveillance program conducted by the National Center for Health Statistics (NCHS), the NHANES assesses the health and nutritional status of non-institutionalized U.S. civilians [34]. Complex, multi-stage sampling was used to obtain a nationally representa-tive sample. This analysis focused on a subgroup of the total population; specifically, employed individuals aged
20–60 years. The NCHS Research Ethics Review Board
approved all protocols and each participant provided in-formed consent [34]. Data from the occupational ques-tionnaire, interview, examination, and accelerometry
components of NHANES 2003–2004 were used in this
analysis. Subsequent NHANES cycles did not use simi-lar occupational categories so the analysis herein is ne-cessarily limited to the 2003–2004 cycle.
Study population
From a potential sample of 2904 participants aged 20– 60 years with complete data for all indicated variables (see Table 2 below), participants who reported working at a job or business but not at work (n= 114), going to school or retired (n= 354), having limitations keeping them from working (n= 280), those who did not report an occupational category (n= 231), and those who re-ported less than full-time work (<35 h/week) [35] were excluded (n= 351) because of the uncertainty in their employment, or mobility status during the activity moni-toring period [36]. Keeping with previous analysis, par-ticipants with less than 4 valid days (of ≥10 h/day of wear time) of accelerometer data [37] were also excluded
(n= 462). The analysis sample ultimately comprised
1112 adults employed full-time in one of 40 occupa-tional categories and with at least 4 days of valid acceler-ometer data.
Accelerometry
In 2003 NHANES added the PA monitor component to objectively assess participants greater than 6 years of age. NHANES participants received standardized in-structions to wear the uniaxial ActiGraph AM-7164 ac-celerometer (ActiGraph, Fort Walton Beach, FL) over the right hip attached by an elasticized belt for seven consecutive days, and to remove the monitor during sleeping, bathing, and other aquatic activities. The Acti-Graph AM-7164 assesses accelerations ranging from 0.05 to 2.0 g that are band limited with a frequency
re-sponse of 0.25–2.5 Hz. It was programmed to record
information in 1 min epochs and measured vertical acceleration transformed to “activity counts/minute,” a proprietary unit of movement and its intensity. After 7 days participants returned the accelerometers to the NHANES data center by ppaid mail. Prior to its re-lease, the accelerometer data was examined by NHANES staff for unreasonable values and to confirm that instru-ments remained calibrated. Unreliable data were clearly marked and not used in this analysis. Additional details about the data collection protocol are available on-line at http://www.cdc.gov/nchs/data/nhanes/meccomp.pdf [38].
Data processing followed previously established stan-dards [37]. Specifically, non-wear time was defined as≥60 consecutive minutes of zero activity counts/minute, allowing for up to 2 min with activity counts/minute be-tween 0 and 100 [37]. To determine valid days (≥10 h/ day of wear time), non-wear time was subtracted from 24 h [39]. For participants with at least 4 days, (week or weekend day, consecutive or not) total activity counts/ day (TAC) [40] and wear time mean activity counts/ minute (indicators of PA volume that capture varying movement intensities throughout the day) were calculated for each day. Accelerometer wear time data were also classified into activity intensity levels using cut points previously established for NHANES (0–99 counts = sed-entary; 100–759 counts = light; 760–2019 counts = life-style;≥2020 counts = moderate-to-vigorous PA [MVPA]) [37, 41]. The proportion of time in each activity intensity level was determined by dividing minutes spent in each intensity by minutes of wear time. Steps/day were not re-leased for the 2003–2004 NHANES cycle, so they are not considered in this analysis.
Population estimates of PA and SB for occupational categories and establishing OA groupings
for reporting, unless otherwise noted [42]. Analyses were conducted using SAS software (Research Triangle Park, NC). To account for the complex sampling design utilized by the NHANES, a 2-year sampling weight was calculated and used for analyses following the recommended guide-lines from the NCHS.
The 40 occupational categories from NHANES 2003–
2004 were ranked (1–40) in ascending order according to each accelerometer-derived variable, except for SB, which was ranked in descending order. A high rank (e.g., 1) was reflective of having greater amounts of OA, while a low rank (e.g., 40) indicated lower amounts of OA. By summing the rank of all six accelerometer-derived variables, a summary score was assigned to each occupational category. Occupational categories were
subsequently ranked in ascending order by their summary scores and three mutually exclusive accelerometer-determined OA groupings were created by splitting the ordered summary scores into tertiles: 1) high OA (top tertile of the summary scores, n= 13), 2) intermediate OA (middle tertile,n= 13), and 3) low OA (bottom ter-tile, n= 14). Considering that the majority of jobs re-quire little OA we chose to allocate 14 occupational categories to the low OA group [20, 21]. Results are pre-sented for men and women by occupational category and OA grouping.
Differences in the characteristics of high OA, inter-mediate OA, and low OA individuals were analyzed by chi-square test (categorical variables), and analysis of variance (ANOVA) (continuous variables). Adjusted
Table 2Demographic characteristics by OA groupings in the National Health and Examination Survey 2003–2004 (n= 1112)
Characteristic High OA (N= 289) Intermediate OA (N= 300) Low OA (N= 523) p-value*
Age (years), M (SE) 39.3 (0.88) 39.6 (0.74) 42.0 (0.50) 0.009a,c
BMI, M (SE) 27.5 (0.57) 28.9 (0.48) 28.2 (0.31) 0.15
Race/ethnicity, %
Non-Hispanic white 63.6 69.4 77.9 <0.0001a,c
Non-Hispanic black 8.3 9.7 8.9
Mexican American 16.9 11.4 4.1
Other 11.1 9.6 9.2
Sex
Men 86.8 62.1 42.3 <0.001a,b,c
Women 13.2 37.9 57.7
Marital Status
Married/living with partner 74.5 69.6 69.4 0.2
Single/not living with partner 25.5 30.4 30.6
Education, %
<High school 23.5 13.1 2.8 <0.001a,b,c
High school 33.3 38.9 16.6
>High school 43.2 48.0 80.6
Household Income, %
<25K 16.5 16.1 5.1 <0.001a,c
25–<45K 23.5 31.6 13.1
45–<75K 33.9 25.7 28.6
75K+ 22 21.5 49.5
Missing 4.1 5.1 3.7
Smoking, % <0.001a,b,c
Never 42.9 58.1 58.4
Former 25.2 12.9 24.4
Current 31.9 29.0 17.2
Wear time (min/day), M (SE) 889.5 (7.93) 884.8 (6.99) 884.7 (4.16) 0.89
High OAhigh occupational activity,Intermediate OAintermediate occupational activity,Low OAlow occupational activity,Mmean,SEstandard error. *pvalues for overall group comparisons. Pairwise comparisons:a
High OA significantly different from Low OA,b
High OA significantly different from Intermediate OA,
c
means and standard error (SE) were calculated for accelerometer-derived PA variables and wear time, and ANOVA with Bonferroni correction (alpha = 0.05/7) were used to compare PA variables between men and women in high OA, intermediate OA, and low OA groupings. For the purposes of a comparison other than between OA groupings, TAC of men and women within each OA grouping were compared to age-matched sex-specific population-referenced TAC per-centiles (25th, 50th, and 75th) previously determined
from NHANES 2003–2006 [40]. Sensitivity analyses
were conducted comparing accelerometer-derived PA variables (activity counts/minute, proportion of wear time spent in MVPA, lifestyle, light, and SB) between high, intermediate, and low OA groupings during
trad-itional working hours (9 am–5 pm) and after work
(5–10 pm) using ANOVA with Bonferroni correction
(alpha = 0.05/5).
Results
Characteristics of adults by OA groupings
A large number of adults were excluded from the ana-lytic sample because of inclusion criteria. Compared to the analytical sample (n= 1112), those excluded from the study (n= 1792) were significantly younger, had lower wear time, accumulated significantly less activity counts/minute and TAC, spent a lower proportion of time in MVPA, lifestyle, and light, and more time seden-tary, were more likely to have less than a high school education, to be non-Hispanic black, female, current smokers, single, and lower income (<25 K). We com-pared subgroups of excluded participants to identify any specific biases—for instance excluded part-time workers were younger, worked less hours, had less lifestyle PA, accelerometer wear time, and TAC than full-time workers. Some occupational categories ‘personal service occupa-tions’,‘sales workers, retail and personal’,‘private house-hold occupations’, and‘waiters and waitresses’had more part-time than full-time workers. Excluded participants with less than 4 valid days of accelerometer data [37] were younger, had less accelerometer wear time, and total counts. In an effort to maximize generalizability we decided restrict our analysis to full-time workers with good accelerometer wear time compliance.
There were significant differences in sex, age, race/ethni-city, education, income, and smoking status between OA groupings (Table 2). A greater proportion of those grouped as having high and intermediate OA were men. For ex-ample, only 13 % of the high OA group were women, whereas 58 % of the low OA group were women. On aver-age, participants grouped as having low OA were signifi-cantly older, more educated, had higher household income, and were not current smokers compared to those who were grouped as having high or intermediate OA. A
higher proportion of Mexican Americans worked in high and intermediate OA occupations than in low OA occupa-tions. There were no significant differences in BMI, marital status, or accelerometer wear time (884.93 min/day) be-tween any OA groupings.
Tables 4, 5, 6, 7, 8 and 9 highlight the number of men and women sampled from each occupational category. Several occupational categories were represented exclu-sively by one sex.‘Related agricultural, forestry, and fish-ing (n= 21)’, ‘construction laborers (n= 9)’, ‘other mechanics and repairers (n= 37)’, and‘vehicle and mo-bile equipment mechanics and repairers (n= 15)’ were occupational categories with 100 % men; while ‘private household (n= 9)’,‘records processing (n= 33)’, and‘ sec-retaries, stenographers, and typists (n= 21)’ were only represented by women. Sixteen of the 40 occupational categories were represented by less than 20 individuals, and seven occupational categories were represented by less than 10 individuals. In the smallest occupational cat-egory, ‘laborers, except construction’ there were only data available for three individuals (1 man, 2 women). Because of the small numbers and sex imbalances of cer-tain occupational categories we chose not to run statis-tical comparisons within or between the 40 occupational categories.
Low, intermediate, and high OA
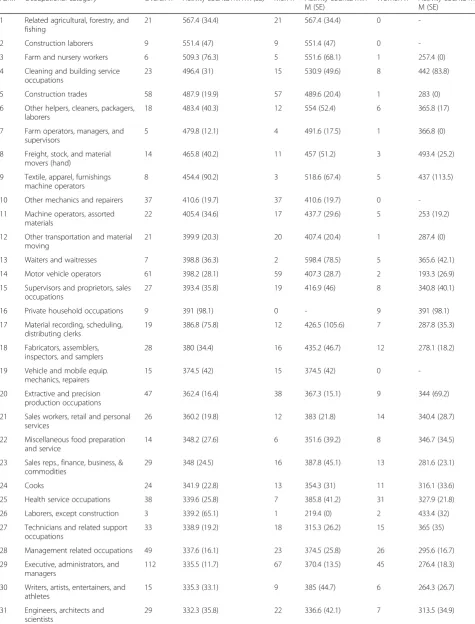
Mean and standard error (SE) for the six accelerometer-derived variables in rank order for each of the 40 occu-pational categories are presented in Tables 4, 5, 6, 7, 8 and 9. ‘Secretaries, stenographers, and typists’ had the lowest TAC, and activity counts/minute followed by‘ re-cords processing occupations.’ ‘Related agricultural, for-estry, and fishing occupations’ had the highest TAC, activity counts/minute, and the largest proportion of MVPA (8 %). ‘Engineers, architects and scientists’ had the largest proportion of monitored time spent in SB (65 %), and the smallest proportion of time spent in light (23 %) and lifestyle PA (8 %). Conversely,‘waiters and waitresses’ had the smallest proportion of time spent in SB (40 %), and largest proportion of time spent in light PA (43 %).
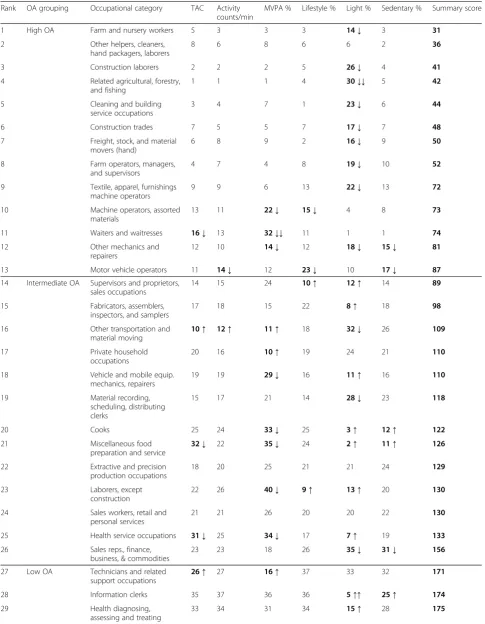
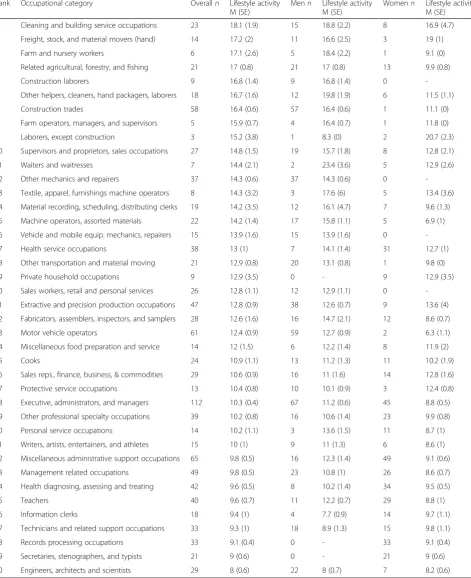
Table 3Occupational categories ranked by summary score of the accelerometer-derived variables and the corresponding OA groupings
Rank OA grouping Occupational category TAC Activity counts/min
MVPA % Lifestyle % Light % Sedentary % Summary score
1 High OA Farm and nursery workers 5 3 3 3 14↓ 3 31
2 Other helpers, cleaners,
hand packagers, laborers
8 6 8 6 6 2 36
3 Construction laborers 2 2 2 5 26↓ 4 41
4 Related agricultural, forestry,
and fishing
1 1 1 4 30↓↓ 5 42
5 Cleaning and building
service occupations
3 4 7 1 23↓ 6 44
6 Construction trades 7 5 5 7 17↓ 7 48
7 Freight, stock, and material
movers (hand)
6 8 9 2 16↓ 9 50
8 Farm operators, managers,
and supervisors
4 7 4 8 19↓ 10 52
9 Textile, apparel, furnishings
machine operators
9 9 6 13 22↓ 13 72
10 Machine operators, assorted
materials
13 11 22↓ 15↓ 4 8 73
11 Waiters and waitresses 16↓ 13 32↓↓ 11 1 1 74
12 Other mechanics and
repairers
12 10 14↓ 12 18↓ 15↓ 81
13 Motor vehicle operators 11 14↓ 12 23↓ 10 17↓ 87
14 Intermediate OA Supervisors and proprietors, sales occupations
14 15 24 10↑ 12↑ 14 89
15 Fabricators, assemblers,
inspectors, and samplers
17 18 15 22 8↑ 18 98
16 Other transportation and
material moving
10↑ 12↑ 11↑ 18 32↓ 26 109
17 Private household
occupations
20 16 10↑ 19 24 21 110
18 Vehicle and mobile equip.
mechanics, repairers
19 19 29↓ 16 11↑ 16 110
19 Material recording,
scheduling, distributing clerks
15 17 21 14 28↓ 23 118
20 Cooks 25 24 33↓ 25 3↑ 12↑ 122
21 Miscellaneous food
preparation and service
32↓ 22 35↓ 24 2↑ 11↑ 126
22 Extractive and precision
production occupations
18 20 25 21 21 24 129
23 Laborers, except
construction
22 26 40↓ 9↑ 13↑ 20 130
24 Sales workers, retail and
personal services
21 21 26 20 20 22 130
25 Health service occupations 31↓ 25 34↓ 17 7↑ 19 133
26 Sales reps., finance,
business, & commodities
23 23 18 26 35↓ 31↓ 156
27 Low OA Technicians and related support occupations
26↑ 27 16↑ 37 33 32 171
28 Information clerks 35 37 36 36 5↑↑ 25↑ 174
29 Health diagnosing,
assessing and treating
processing occupations’were consistently in the lower ranks for most accelerometer-derived variables, while ‘farm and nursery workers’,‘other helpers, equipment cleaners, hand packagers, and laborers’,‘construction laborers’, and‘related agricultural, forestry, and fishing occupations’ were consistently near the top for most accelerometer-derived variables and were the four highest ranked occupational categories according to the summary score.
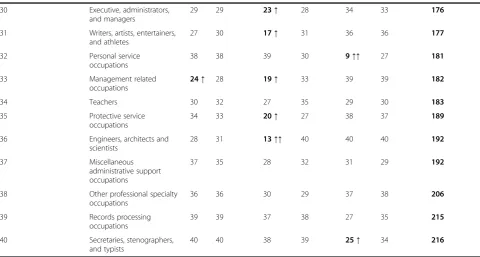
Among the three OA groupings most of the individual accelerometer-derived variables aligned closely with the summary scores (Table 3). Scrutinizing the low OA group-ing revealed several notable exceptions. For example, some low OA occupational categories (e.g.,‘engineers, architects, and scientists’,‘technicians and related support occupations’, ‘management related occupations’, ‘executives, administra-tors, and managers’,‘protective services’, and‘writers, artists, entertainers, and athletes’) displayed relatively higher rankings for the proportion of time in MVPA. To be clear, their time in MVPA was higher than what was expected given their relatively lower summary score.
Within each OA grouping men accumulated significantly more TAC, activity counts/minute, and had a greater
proportion of time in MVPA than women (Table 10). Within the intermediate OA and low OA groupings, women spent a significantly greater proportion of time in light PA than men. Men grouped in low OA had a signifi-cantly greater proportion of time spent in lifestyle PA than women in the same OA grouping. There were no differ-ences in the proportion of time spent in SB or wear time between men and women in any OA grouping. Sensitivity analyses showed significant differences in activity counts/ hour, and all activity intensity levels between OA group-ings during traditional working hours (9 am–5 pm). The high OA grouping accumulated more activity counts/mi-nute, MVPA, lifestyle, and light PA, and less SB, followed by intermediate and low OA occupations. There were no differences in accelerometer-derived PA and SB variables between OA groupings after work (5–10 pm).
OA groupings compared to age-matched, sex-specific population-referenced TAC percentiles
When the PA levels of our sample were compared with a larger sample of U.S. men and women of similar age, men with low OA accumulated TAC slightly below the 50th percentile, while women in low OA had TAC values
Table 3Occupational categories ranked by summary score of the accelerometer-derived variables and the corresponding OA groupings(Continued)
30 Executive, administrators,
and managers
29 29 23↑ 28 34 33 176
31 Writers, artists, entertainers, and athletes
27 30 17↑ 31 36 36 177
32 Personal service
occupations
38 38 39 30 9↑↑ 27 181
33 Management related
occupations
24↑ 28 19↑ 33 39 39 182
34 Teachers 30 32 27 35 29 30 183
35 Protective service
occupations
34 33 20↑ 27 38 37 189
36 Engineers, architects and
scientists
28 31 13↑↑ 40 40 40 192
37 Miscellaneous
administrative support occupations
37 35 28 32 31 29 192
38 Other professional specialty
occupations
36 36 30 29 37 38 206
39 Records processing
occupations
39 39 37 38 27 35 215
40 Secretaries, stenographers,
and typists
40 40 38 39 25↑ 34 216
similar to the 50th percentile (Fig. 1). Men and women in intermediate OA occupations accumulated TAC slightly above the 50th percentile, and men and women in high
OA occupations had TAC values above the 50th percentile and close to the 75th percentile compared to sex-and age-matched TAC of U.S. adults.
Table 4Ranking for daily TAC by occupational category and by sex: NHANES 2003–2004 (n= 1112)
Rank Occupational category Overalln TAC M (SE) Menn TAC M (SE) Womenn TAC M (SE)
1 Related agricultural, forestry, and fishing 21 485,767 (29,836) 21 485,767 (29,836) 0
-2 Construction laborers 9 471,863 (54,189) 9 471,863 (54,189) 0
-3 Cleaning and building service occupations 23 450,084 (30,591) 15 483,758 (51,323) 8 397,142 (79,167) 4 Farm operators, managers, and supervisors 5 436,923 (295.8) 4 448,050 (4261) 1 329,570 (0)
5 Farm and nursery workers 6 434,533 (72,549) 5 479,218 (61,203) 1 168,400 (0)
6 Freight, stock, and material movers (hand) 14 425,193 (22,221) 11 425,427 (28,972) 3 424,461 (5927)
7 Construction trades 58 424,700 (19,785) 57 426,154 (20,224) 1 256,600 (0)
8 Other helpers, cleaners, packagers, laborers 18 422,397 (43,719) 12 494,944 (51,212) 6 301,419 (8065) 9 Textile, apparel, furnishings machine operators 8 389,395 (72,764) 3 430,829 (54,246) 5 378,150 (90,086) 10 Other transportation and material moving 21 363,428 (19,964) 20 369,009 (20,866) 1 279,710 (0)
11 Motor vehicle operators 61 358,903 (21,335) 59 365,130 (21,238) 2 219,442 (61,238)
12 Other mechanics and repairers 37 358,301 (15,423) 37 358,301 (15,423) 0
-13 Machine operators, assorted materials 22 356,234 (37,952) 17 386,340 (35,424) 5 214,122 (22,970) 14 Supervisors and proprietors, sales occupations 27 346,590 (35,260) 19 371,350 (43,575) 8 291,278 (35,530) 15 Material recording, scheduling, distributing clerks 19 334,085 (60,295) 12 358,570 (85,201) 7 272,997 (41,793)
16 Waiters and waitresses 7 332,931 (32,540) 2 503,971 (73,138) 5 304,425 (41,551)
17 Fabricators, assemblers, inspectors, and samplers 28 332,848 (17,945) 16 378,576 (28,778) 12 248,454 (15,706) 18 Extractive and precision production occupations 47 327,915 (17,333) 38 336,678 (20,915) 9 295,118 (60,034) 19 Vehicle and mobile equip. mechanics, repairers 15 320,773 (40,082) 15 320,773 (40,082) 0
-20 Private household occupations 9 320,474 (84,755) 0 - 9 320,474 (84,755)
21 Sales workers, retail and personal services 26 314,124 (18,394) 12 339,663 (23,099) 14 291,893 (21,422)
22 Laborers, except construction 3 305,925 (71,578) 1 174,290 (0) 2 409,405 (2793)
23 Sales reps., finance, business, & commodities 29 303,648 (23,216) 16 343,308 (42,571) 13 237,490 (17,916) 24 Management related occupations 49 299,487 (16,539) 23 335,330 (28,517) 26 258,586 (14,012)
25 Cooks 24 298,019 (19,802) 13 314,980 (31,615) 11 262,556 (18,198)
26 Technicians and related support occupations 33 296,734 (17,082) 18 279,416 (22,874) 15 315,969 (30,724) 27 Writers, artists, entertainers, and athletes 15 296,033 (30,519) 9 342,968 (41,433) 6 229,124 (22,602) 28 Engineers, architects and scientists 29 294,668 (33,219) 22 300,829 (38,693) 7 267,305 (28,429) 29 Executive, administrators, and managers 112 293,657 (10,403) 67 325,623 (12,281) 45 239,623 (15,811)
30 Teachers 40 292,993 (23,268) 11 373,185 (44,851) 29 267,744 (23,133)
31 Health service occupations 38 290,882 (22,132) 7 330,900 (35,382) 31 280,704 (19,070)
32 Miscellaneous food preparation and service 14 288,423 (20,262) 6 294,952 (22,086) 8 285,417 (30,348) 33 Health diagnosing, assessing and treating 42 284,889 (13,572) 8 290,655 (22,823) 34 283,369 (16,371) 34 Protective service occupations 13 281,516 (33,814) 10 278,523 (39,317) 3 298,215 (22,129)
35 Information clerks 18 280,789 (44,557) 4 215,013 (19,044) 14 291,417 (50,557)
36 Other professional specialty occupations 39 279,639 (16,847) 16 296,210 (31,331) 23 262,859 (17,062) 37 Miscellaneous administrative support occupations 65 277,748 (14,067) 16 361,957 (46,240) 49 253,329 (16,315)
38 Personal service occupations 14 246,259 (19,502) 3 316,398 (28,738) 11 215,592 (12,896)
39 Records processing occupations 33 243,927 (11,345) 0 - 33 243,927 (11,345)
40 Secretaries, stenographers, and typists 21 223,662 (15,790) 0 - 21 223,662 (15,790)
Table 5Ranking for activity counts/minute by occupational category and by sex: NHANES 2003–2004 (n= 1112)
Rank Occupational category Overalln Activity counts/min M (SE) Menn Activity counts/min M (SE)
Womenn Activity counts/min M (SE)
1 Related agricultural, forestry, and fishing
21 567.4 (34.4) 21 567.4 (34.4) 0
-2 Construction laborers 9 551.4 (47) 9 551.4 (47) 0
-3 Farm and nursery workers 6 509.3 (76.3) 5 551.6 (68.1) 1 257.4 (0)
4 Cleaning and building service occupations
23 496.4 (31) 15 530.9 (49.6) 8 442 (83.8)
5 Construction trades 58 487.9 (19.9) 57 489.6 (20.4) 1 283 (0)
6 Other helpers, cleaners, packagers, laborers
18 483.4 (40.3) 12 554 (52.4) 6 365.8 (17)
7 Farm operators, managers, and supervisors
5 479.8 (12.1) 4 491.6 (17.5) 1 366.8 (0)
8 Freight, stock, and material movers (hand)
14 465.8 (40.2) 11 457 (51.2) 3 493.4 (25.2)
9 Textile, apparel, furnishings machine operators
8 454.4 (90.2) 3 518.6 (67.4) 5 437 (113.5)
10 Other mechanics and repairers 37 410.6 (19.7) 37 410.6 (19.7) 0
-11 Machine operators, assorted materials
22 405.4 (34.6) 17 437.7 (29.6) 5 253 (19.2)
12 Other transportation and material moving
21 399.9 (20.3) 20 407.4 (20.4) 1 287.4 (0)
13 Waiters and waitresses 7 398.8 (36.3) 2 598.4 (78.5) 5 365.6 (42.1)
14 Motor vehicle operators 61 398.2 (28.1) 59 407.3 (28.7) 2 193.3 (26.9)
15 Supervisors and proprietors, sales occupations
27 393.4 (35.8) 19 416.9 (46) 8 340.8 (40.1)
16 Private household occupations 9 391 (98.1) 0 - 9 391 (98.1)
17 Material recording, scheduling, distributing clerks
19 386.8 (75.8) 12 426.5 (105.6) 7 287.8 (35.3)
18 Fabricators, assemblers, inspectors, and samplers
28 380 (34.4) 16 435.2 (46.7) 12 278.1 (18.2)
19 Vehicle and mobile equip. mechanics, repairers
15 374.5 (42) 15 374.5 (42) 0
-20 Extractive and precision production occupations
47 362.4 (16.4) 38 367.3 (15.1) 9 344 (69.2)
21 Sales workers, retail and personal services
26 360.2 (19.8) 12 383 (21.8) 14 340.4 (28.7)
22 Miscellaneous food preparation and service
14 348.2 (27.6) 6 351.6 (39.2) 8 346.7 (34.5)
23 Sales reps., finance, business, & commodities
29 348 (24.5) 16 387.8 (45.1) 13 281.6 (23.1)
24 Cooks 24 341.9 (22.8) 13 354.3 (31) 11 316.1 (33.6)
25 Health service occupations 38 339.6 (25.8) 7 385.8 (41.2) 31 327.9 (21.8)
26 Laborers, except construction 3 339.2 (65.1) 1 219.4 (0) 2 433.4 (32)
27 Technicians and related support occupations
33 338.9 (19.2) 18 315.3 (26.2) 15 365 (35)
28 Management related occupations 49 337.6 (16.1) 23 374.5 (25.8) 26 295.6 (16.7)
29 Executive, administrators, and managers
112 335.5 (11.7) 67 370.4 (13.5) 45 276.4 (18.3)
30 Writers, artists, entertainers, and athletes
15 335.3 (33.1) 9 385 (44.7) 6 264.3 (26.7)
31 Engineers, architects and scientists
Discussion
This study is the first to report observed accelerometer-derived PA and SB variables for a wide variety of occu-pational categories in U.S. adults. Accelerometry pro-vides an objective measure of movement in everyday life and thus should yield a more valid and reproducible ranking of OA than that achieved earlier by researchers’ best estimates [32]. The information in the paper pro-vides future researchers with detailed measures of the volume and intensity of PA and SB variables that can be compared across the 40 occupational categories based on the 1980 U.S. Census Bureau Classification Coding System. These data also highlight the importance of oc-cupation as a determinant of daily PA and SB.
Previously, occupational categories with indeterminate levels of PA and/or those known to have high variability in PA requirements were considered to be unclassifiable in terms of OA [32]. In fact, more than half (23 of 40) of the occupational categories within NHANES 2003–2004 were considered too ambiguous to classify based on the occupation descriptions of the U.S. Department of Labor [32]. For example firefighters, a specific occupation within the‘protective services’category, may be very ac-tive when fighting a fire, but the majority of their time may be spent sedentary or in light intensity PA while waiting for a call. Despite the high levels of PA required to be an athlete, they were included in the occupational category ‘writers, artists, entertainers, and athletes’ which was previously categorized as “unclassifiable”due to the assumed lower levels of PA of the other occupa-tions in the category. In our new grouping ‘writers, art-ists, entertainers, and athletes’ belongs to the low OA grouping, which would suggest that overall number of professional athletes sampled was low. These examples highlight some limitations of relying on job classification as an index of PA [43, 44]. Due to the uncertainty of PA levels of many occupational categories, researchers have
predominantly limited their analyses to the occupational categories assumed to have more consistently very high or low levels of OA [12, 21, 45]. The ability to quantify the PA and SB of individuals working in a diverse spectrum of occupational categories with accelerometer data allows for more data-driven grouping into low, intermediate, and high OA. While our tertile approach is arbitrary, it logically splits the occupational categories into three equivalent OA groupings, and avoids having the majority of occupations being considered unclassifi-able. Accounting for the variation in PA within each oc-cupational category is still a challenge to overcome, however these data-driven OA groupings may enhance researchers ability to rely on occupational categories as an index of PA, and improve our capability to identify relationships between OA, daily PA and health [46].
In the past relying on occupational categories as a proxy for OA has be useful when gathering information on daily PA of various occupations that involve large amounts of sedentary time or greater amounts of phys-ical labor [32, 46]. The use of objectively measured PA and SB provides data to support the use of occupational categories as a proxy for OA differences. Our study cor-roborates the utility of the original high and low OA groupings established by King et al. [32]. Only three of the 17 occupational categories previously classified as having high, or low OA were differently categorized using objectively measured PA and SB.‘Laborers, except construction’ went from high to intermediate OA,‘ ma-terial recording, scheduling, and distributing clerks’went from low to intermediate OA, and‘motor vehicle opera-tors’went from low to high OA.
Due to the variety of occupations within some occupa-tional categories PA levels may be quite heterogeneous within an occupational category. Also there is no infor-mation regarding the breakdown of all the occupations within each of the 40 occupational categories (i.e., there
Table 5Ranking for activity counts/minute by occupational category and by sex: NHANES 2003–2004 (n= 1112)(Continued)
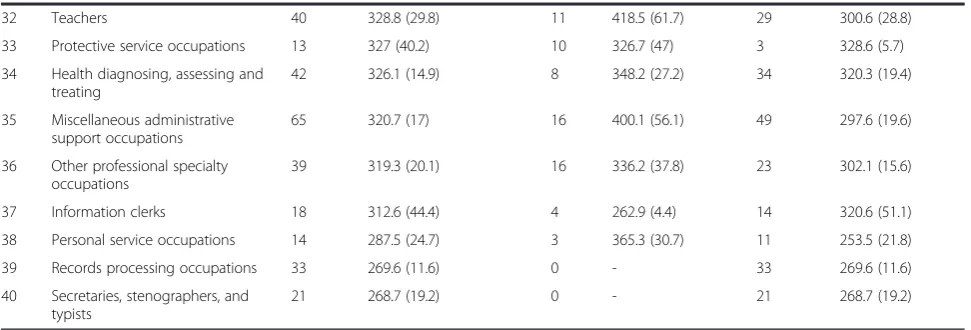
32 Teachers 40 328.8 (29.8) 11 418.5 (61.7) 29 300.6 (28.8)
33 Protective service occupations 13 327 (40.2) 10 326.7 (47) 3 328.6 (5.7)
34 Health diagnosing, assessing and treating
42 326.1 (14.9) 8 348.2 (27.2) 34 320.3 (19.4)
35 Miscellaneous administrative support occupations
65 320.7 (17) 16 400.1 (56.1) 49 297.6 (19.6)
36 Other professional specialty occupations
39 319.3 (20.1) 16 336.2 (37.8) 23 302.1 (15.6)
37 Information clerks 18 312.6 (44.4) 4 262.9 (4.4) 14 320.6 (51.1)
38 Personal service occupations 14 287.5 (24.7) 3 365.3 (30.7) 11 253.5 (21.8)
39 Records processing occupations 33 269.6 (11.6) 0 - 33 269.6 (11.6)
40 Secretaries, stenographers, and typists
21 268.7 (19.2) 0 - 21 268.7 (19.2)
Table 6Ranking for proportion of time in MVPA by occupational category and by sex: NHANES 2003–2004 (n= 1112)
Rank Occupational category Overalln MVPA M (SE) Menn MVPA M (SE) Womenn MVPA M (SE)
1 Related agricultural, forestry, and fishing 21 7.7 (1) 21 7.7 (1) 0
-2 Construction laborers 9 7.4 (1) 9 7.4 (1) 0
-3 Farm and nursery workers 6 5.7 (1.3) 5 6.4 (1.2) 1 1.5 (0)
4 Farm operators, managers, and supervisors 5 5.6 (0.8) 4 5.9 (0.9) 1 3.2 (0)
5 Construction trades 58 5.6 (0.4) 57 5.6 (0.4) 1 1.2 (0)
6 Textile, apparel, furnishings machine operators 8 5.4 (1.5) 3 6.1 (0.2) 5 5.2 (1.9)
7 Cleaning and building service occupations 23 5.1 (0.4) 15 6 (0.8) 8 3.7 (1)
8 Other helpers, cleaners, packagers, laborers 18 4.8 (0.8) 12 5.8 (1.2) 6 3 (0.2)
9 Freight, stock, and material movers (hand) 14 4.4 (0.6) 11 4.5 (0.8) 3 4 (0.8)
10 Private household occupationsa 9 4.3 (1.5) 0 - 9 4.3 (1.5)
11 Other transportation and material moving 21 4.2 (0.3) 20 4.3 (0.3) 1 2.5 (0)
12 Motor vehicle operators 61 4.1 (0.5) 59 4.2 (0.5) 2 0.7 (0.3)
13 Engineers, architects and scientists 29 4 (0.7) 22 4.1 (0.8) 7 3.3 (0.6)
14 Other mechanics and repairers 37 4 (0.5) 37 4 (0.5) 0
-15 Fabricators, assemblers, inspectors, and samplers 28 3.6 (0.5) 16 4.5 (0.6) 12 1.9 (0.4)
16 Technicians and related support occupations 33 3.6 (0.4) 18 3.6 (0.6) 15 3.7 (0.7)
17 Writers, artists, entertainers, and athletes 15 3.5 (0.7) 9 4.7 (1) 6 1.9 (0.3)
18 Sales reps., finance, business, & commodities 29 3.5 (0.6) 16 4.6 (1) 13 1.8 (0.5)
19 Management related occupations 49 3.5 (0.4) 23 4.2 (0.5) 26 2.8 (0.4)
20 Protective service occupations 13 3.4 (1) 10 3.7 (1.1) 3 2 (0.4)
21 Material recording, scheduling, distributing clerksa 19 3.3 (1) 12 3.7 (1.5) 7 2.2 (0.4)
22 Machine operators, assorted materials 22 3.3 (0.6) 17 3.7 (0.6) 5 1.6 (0.4)
23 Executive, administrators, and managers 112 3.2 (0.2) 67 3.9 (0.3) 45 2 (0.3)
24 Supervisors and proprietors, sales occupations 27 3.1 (0.5) 19 3.7 (0.7) 8 1.9 (0.4)
25 Extractive and precision production occupations 47 3.1 (0.3) 38 3.3 (0.3) 9 2.1 (0.6)
26 Sales workers, retail and personal services 26 3.1 (0.3) 12 3.8 (0.4) 14 2.4 (0.4)
27 Teachers 40 3 (0.5) 11 4.2 (0.9) 29 2.6 (0.5)
28 Miscellaneous administrative support occupations 65 3 (0.3) 16 4.9 (1.3) 49 2.4 (0.4)
29 Vehicle and mobile equip. mechanics, repairers 15 2.9 (0.7) 15 2.9 (0.7) 0
-30 Other professional specialty occupations 39 2.9 (0.3) 16 3.4 (0.5) 23 2.5 (0.2)
31 Health diagnosing, assessing and treating 42 2.7 (0.3) 8 3.2 (0.5) 34 2.6 (0.3)
32 Waiters and waitressesa 7 2.5 (0.9) 2 5.8 (0.8) 5 1.9 (0.8)
33 Cooks 24 2.2 (0.4) 13 2.5 (0.4) 11 1.5 (0.5)
34 Health service occupations 38 2.1 (0.4) 7 3.4 (0.8) 31 1.8 (0.3)
35 Miscellaneous food preparation and service 14 2.1 (0.4) 6 2.3 (1) 8 2 (0.4)
36 Information clerksa 18 1.9 (0.6) 4 2.5 (0.5) 14 1.8 (0.7)
37 Records processing occupations 33 1.8 (0.2) 0 - 33 1.8 (0.2)
38 Secretaries, stenographers, and typists 21 1.7 (0.4) 0 - 21 1.7 (0.4)
39 Personal service occupations 14 1.6 (0.4) 3 3.1 (0.5) 11 1 (0.1)
40 Laborers, except construction 3 1.3 (0.3) 1 0.9 (0) 2 1.6 (0.3)
MVPAmoderate-to-vigorous physical activity (≥2020 counts),Mmean,SEstandard error.a
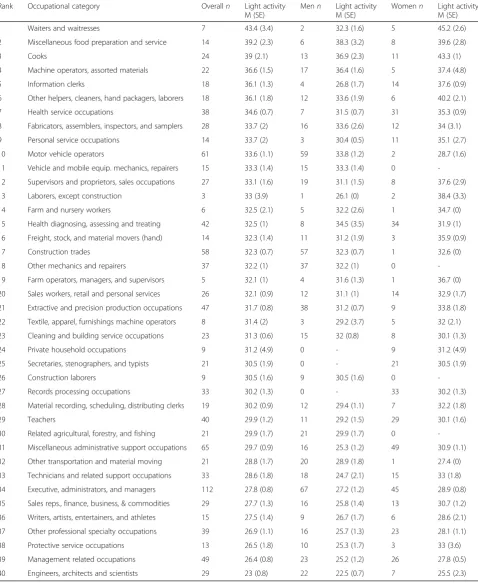
Table 7Ranking for proportion of time in lifestyle activity by occupational category and by sex: NHANES 2003–2004 (n= 1112)
Rank Occupational category Overalln Lifestyle activity M (SE)
Menn Lifestyle activity M (SE)
Womenn Lifestyle activity M (SE)
1 Cleaning and building service occupations 23 18.1 (1.9) 15 18.8 (2.2) 8 16.9 (4.7)
2 Freight, stock, and material movers (hand) 14 17.2 (2) 11 16.6 (2.5) 3 19 (1)
3 Farm and nursery workers 6 17.1 (2.6) 5 18.4 (2.2) 1 9.1 (0)
4 Related agricultural, forestry, and fishing 21 17 (0.8) 21 17 (0.8) 13 9.9 (0.8)
5 Construction laborers 9 16.8 (1.4) 9 16.8 (1.4) 0
-6 Other helpers, cleaners, hand packagers, laborers 18 16.7 (1.6) 12 19.8 (1.9) 6 11.5 (1.1)
7 Construction trades 58 16.4 (0.6) 57 16.4 (0.6) 1 11.1 (0)
8 Farm operators, managers, and supervisors 5 15.9 (0.7) 4 16.4 (0.7) 1 11.8 (0)
9 Laborers, except construction 3 15.2 (3.8) 1 8.3 (0) 2 20.7 (2.3)
10 Supervisors and proprietors, sales occupations 27 14.8 (1.5) 19 15.7 (1.8) 8 12.8 (2.1)
11 Waiters and waitresses 7 14.4 (2.1) 2 23.4 (3.6) 5 12.9 (2.6)
12 Other mechanics and repairers 37 14.3 (0.6) 37 14.3 (0.6) 0
-13 Textile, apparel, furnishings machine operators 8 14.3 (3.2) 3 17.6 (6) 5 13.4 (3.6) 14 Material recording, scheduling, distributing clerks 19 14.2 (3.5) 12 16.1 (4.7) 7 9.6 (1.3)
15 Machine operators, assorted materials 22 14.2 (1.4) 17 15.8 (1.1) 5 6.9 (1)
16 Vehicle and mobile equip. mechanics, repairers 15 13.9 (1.6) 15 13.9 (1.6) 0
-17 Health service occupations 38 13 (1) 7 14.1 (1.4) 31 12.7 (1)
18 Other transportation and material moving 21 12.9 (0.8) 20 13.1 (0.8) 1 9.8 (0)
19 Private household occupations 9 12.9 (3.5) 0 - 9 12.9 (3.5)
20 Sales workers, retail and personal services 26 12.8 (1.1) 12 12.9 (1.1) 0
-21 Extractive and precision production occupations 47 12.8 (0.9) 38 12.6 (0.7) 9 13.6 (4) 22 Fabricators, assemblers, inspectors, and samplers 28 12.6 (1.6) 16 14.7 (2.1) 12 8.6 (0.7)
23 Motor vehicle operators 61 12.4 (0.9) 59 12.7 (0.9) 2 6.3 (1.1)
24 Miscellaneous food preparation and service 14 12 (1.5) 6 12.2 (1.4) 8 11.9 (2)
25 Cooks 24 10.9 (1.1) 13 11.2 (1.3) 11 10.2 (1.9)
26 Sales reps., finance, business, & commodities 29 10.6 (0.9) 16 11 (1.6) 14 12.8 (1.6)
27 Protective service occupations 13 10.4 (0.8) 10 10.1 (0.9) 3 12.4 (0.8)
28 Executive, administrators, and managers 112 10.3 (0.4) 67 11.2 (0.6) 45 8.8 (0.5)
29 Other professional specialty occupations 39 10.2 (0.8) 16 10.6 (1.4) 23 9.9 (0.8)
30 Personal service occupations 14 10.2 (1.1) 3 13.6 (1.5) 11 8.7 (1)
31 Writers, artists, entertainers, and athletes 15 10 (1) 9 11 (1.3) 6 8.6 (1)
32 Miscellaneous administrative support occupations 65 9.8 (0.5) 16 12.3 (1.4) 49 9.1 (0.6)
33 Management related occupations 49 9.8 (0.5) 23 10.8 (1) 26 8.6 (0.7)
34 Health diagnosing, assessing and treating 42 9.6 (0.5) 8 10.2 (1.4) 34 9.5 (0.5)
35 Teachers 40 9.6 (0.7) 11 12.2 (0.7) 29 8.8 (1)
36 Information clerks 18 9.4 (1) 4 7.7 (0.9) 14 9.7 (1.1)
37 Technicians and related support occupations 33 9.3 (1) 18 8.9 (1.3) 15 9.8 (1.1)
38 Records processing occupations 33 9.1 (0.4) 0 - 33 9.1 (0.4)
39 Secretaries, stenographers, and typists 21 9 (0.6) 0 - 21 9 (0.6)
40 Engineers, architects and scientists 29 8 (0.6) 22 8 (0.7) 7 8.2 (0.6)
Table 8Ranking for proportion of time in light activity by occupational category and by sex: NHANES 2003–2004 (n= 1112)
Rank Occupational category Overalln Light activity
M (SE)
Menn Light activity M (SE)
Womenn Light activity M (SE)
1 Waiters and waitresses 7 43.4 (3.4) 2 32.3 (1.6) 5 45.2 (2.6)
2 Miscellaneous food preparation and service 14 39.2 (2.3) 6 38.3 (3.2) 8 39.6 (2.8)
3 Cooks 24 39 (2.1) 13 36.9 (2.3) 11 43.3 (1)
4 Machine operators, assorted materials 22 36.6 (1.5) 17 36.4 (1.6) 5 37.4 (4.8)
5 Information clerks 18 36.1 (1.3) 4 26.8 (1.7) 14 37.6 (0.9)
6 Other helpers, cleaners, hand packagers, laborers 18 36.1 (1.8) 12 33.6 (1.9) 6 40.2 (2.1)
7 Health service occupations 38 34.6 (0.7) 7 31.5 (0.7) 31 35.3 (0.9)
8 Fabricators, assemblers, inspectors, and samplers 28 33.7 (2) 16 33.6 (2.6) 12 34 (3.1)
9 Personal service occupations 14 33.7 (2) 3 30.4 (0.5) 11 35.1 (2.7)
10 Motor vehicle operators 61 33.6 (1.1) 59 33.8 (1.2) 2 28.7 (1.6)
11 Vehicle and mobile equip. mechanics, repairers 15 33.3 (1.4) 15 33.3 (1.4) 0
-12 Supervisors and proprietors, sales occupations 27 33.1 (1.6) 19 31.1 (1.5) 8 37.6 (2.9)
13 Laborers, except construction 3 33 (3.9) 1 26.1 (0) 2 38.4 (3.3)
14 Farm and nursery workers 6 32.5 (2.1) 5 32.2 (2.6) 1 34.7 (0)
15 Health diagnosing, assessing and treating 42 32.5 (1) 8 34.5 (3.5) 34 31.9 (1)
16 Freight, stock, and material movers (hand) 14 32.3 (1.4) 11 31.2 (1.9) 3 35.9 (0.9)
17 Construction trades 58 32.3 (0.7) 57 32.3 (0.7) 1 32.6 (0)
18 Other mechanics and repairers 37 32.2 (1) 37 32.2 (1) 0
-19 Farm operators, managers, and supervisors 5 32.1 (1) 4 31.6 (1.3) 1 36.7 (0)
20 Sales workers, retail and personal services 26 32.1 (0.9) 12 31.1 (1) 14 32.9 (1.7)
21 Extractive and precision production occupations 47 31.7 (0.8) 38 31.2 (0.7) 9 33.8 (1.8)
22 Textile, apparel, furnishings machine operators 8 31.4 (2) 3 29.2 (3.7) 5 32 (2.1)
23 Cleaning and building service occupations 23 31.3 (0.6) 15 32 (0.8) 8 30.1 (1.3)
24 Private household occupations 9 31.2 (4.9) 0 - 9 31.2 (4.9)
25 Secretaries, stenographers, and typists 21 30.5 (1.9) 0 - 21 30.5 (1.9)
26 Construction laborers 9 30.5 (1.6) 9 30.5 (1.6) 0
-27 Records processing occupations 33 30.2 (1.3) 0 - 33 30.2 (1.3)
28 Material recording, scheduling, distributing clerks 19 30.2 (0.9) 12 29.4 (1.1) 7 32.2 (1.8)
29 Teachers 40 29.9 (1.2) 11 29.2 (1.5) 29 30.1 (1.6)
30 Related agricultural, forestry, and fishing 21 29.9 (1.7) 21 29.9 (1.7) 0
-31 Miscellaneous administrative support occupations 65 29.7 (0.9) 16 25.3 (1.2) 49 30.9 (1.1)
32 Other transportation and material moving 21 28.8 (1.7) 20 28.9 (1.8) 1 27.4 (0)
33 Technicians and related support occupations 33 28.6 (1.8) 18 24.7 (2.1) 15 33 (1.8)
34 Executive, administrators, and managers 112 27.8 (0.8) 67 27.2 (1.2) 45 28.9 (0.8)
35 Sales reps., finance, business, & commodities 29 27.7 (1.3) 16 25.8 (1.4) 13 30.7 (1.2)
36 Writers, artists, entertainers, and athletes 15 27.5 (1.4) 9 26.7 (1.7) 6 28.6 (2.1)
37 Other professional specialty occupations 39 26.9 (1.1) 16 25.7 (1.3) 23 28.1 (1.1)
38 Protective service occupations 13 26.5 (1.8) 10 25.3 (1.7) 3 33 (3.6)
39 Management related occupations 49 26.4 (0.8) 23 25.2 (1.2) 26 27.8 (0.5)
40 Engineers, architects and scientists 29 23 (0.8) 22 22.5 (0.7) 7 25.5 (2.3)
Table 9Ranking for proportion of time in sedentary activity by occupational category and by sex: NHANES 2003–2004 (n= 1112)
Rank Occupational category Overalln Sedentary activity M (SE)
Menn Sedentary activity M (SE)
Womenn Sedentary activity M (SE)
1 Waiters and waitresses 7 39.8 (3.2) 2 38.5 (6) 5 40 (4.3)
2 Other helpers, cleaners, hand packagers, laborers 18 42.4 (1.2) 12 40.7 (1.6) 6 45.3 (1.6)
3 Farm and nursery workers 6 44.7 (5.4) 5 43 (5.5) 1 54.7 (0)
4 Construction laborers 9 45.3 (2) 9 45.3 (2) 0
-5 Related agricultural, forestry, and fishing 21 45.4 (1.3) 21 45.4 (1.3) 0
-6 Cleaning and building service occupations 23 45.6 (2.2) 15 43.2 (3.5) 8 49.3 (5.4)
7 Construction trades 58 45.7 (1.3) 57 45.6 (1.3) 1 55.1 (0)
8 Machine operators, assorted materials 22 45.9 (1.5) 17 44.2 (1.5) 5 54.1 (4.7)
9 Freight, stock, and material movers (hand) 14 46.1 (2.9) 11 47.8 (3.8) 3 41 (0.4)
10 Farm operators, managers, and supervisors 5 46.3 (1) 4 46.1 (1) 1 48.3 (0)
11 Miscellaneous food preparation and service 14 46.7 (2.3) 6 47.2 (3.5) 8 46.5 (2.4)
12 Cooks 24 47.9 (2.6) 13 49.3 (3.2) 11 45 (2.1)
13 Textile, apparel, furnishings machine operators 8 48.9 (5.5) 3 47.1 (6.6) 5 49.4 (6.9)
14 Supervisors and proprietors, sales occupations 27 49 (3) 19 49.6 (3.6) 8 47.7 (5)
15 Other mechanics and repairers 37 49.5 (1.2) 37 49.5 (1.2) 0
-16 Vehicle and mobile equip. mechanics, repairers 15 49.8 (2.9) 15 49.8 (2.9) 0
-17 Motor vehicle operators 61 50 (1.5) 59 49.3 (1.5) 2 64.3 (3)
18 Fabricators, assemblers, inspectors, and samplers 28 50.1 (3.6) 16 47.2 (5.1) 12 55.5 (3.1)
19 Health service occupations 38 50.4 (1.6) 7 51 (1.9) 31 50.2 (1.8)
20 Laborers, except construction 3 50.5 (7.9) 1 64.7 (0) 2 39.3 (5.3)
21 Private household occupations 9 51.7 (9.1) 0 - 9 51.7 (9.1)
22 Sales workers, retail and personal services 26 52 (1.5) 12 52.1 (1.7) 14 51.9 (2.4) 23 Material recording, scheduling, distributing clerks 19 52.3 (4.4) 12 50.8 (6) 7 56.1 (3.4) 24 Extractive and precision production occupations 47 52.4 (1.2) 38 52.9 (0.9) 9 50.4 (5.3)
25 Information clerks 18 52.5 (1.8) 4 63 (2) 14 50.8 (1.5)
26 Other transportation and material moving 21 54.1 (2.2) 20 53.7 (2.3) 1 60.2 (0)
27 Personal service occupations 14 54.5 (2.5) 3 53 (1.5) 11 55.2 (3.5)
28 Health diagnosing, assessing and treating 42 55.2 (1.1) 8 52.1 (4.4) 34 56.1 (1.1)
29 Miscellaneous administrative support occupations 65 57.5 (1.4) 16 57.5 (3.1) 49 57.5 (1.7)
30 Teachers 40 57.5 (1.7) 11 54.4 (1.7) 29 58.5 (2.4)
31 Sales reps., finance, business, & commodities 29 58.2 (1.9) 16 58.6 (3.1) 13 57.6 (2) 32 Technicians and related support occupations 33 58.5 (2.5) 18 62.9 (3.2) 15 53.6 (2.4)
33 Executive, administrators, and managers 112 58.6 (1.1) 67 57.7 (1.4) 45 60.2 (1.4)
34 Secretaries, stenographers, and typists 21 58.7 (2.3) 0 - 21 58.7 (2.3)
35 Records processing occupations 33 58.8 (1.6) 0 - 33 58.8 (1.6)
36 Writers, artists, entertainers, and athletes 15 58.9 (2.6) 9 57.6 (3.3) 6 60.9 (3)
37 Protective service occupations 13 59.7 (2.4) 10 60.9 (2.6) 3 52.6 (3.8)
38 Other professional specialty occupations 39 59.9 (1.8) 16 60.3 (2.9) 23 59.6 (1.7)
39 Management related occupations 49 60.3 (1.2) 23 59.7 (2.1) 26 60.9 (0.9)
40 Engineers, architects and scientists 29 65 (1.4) 22 65.4 (1.6) 7 63 (3)
Table 10Accelerometer-derived variable comparison between men and women within OA groupingsa: NHANES 2003–2004
n TAC M (SE) Activity counts/min M (SE) MVPA percentage M (SE)
Lifestyle percentage M (SE)
Light percentage M (SE) Sedentary percentage M (SE) Wear time M (SE)
High OA men 252 410,694 (10,303) 465.6 (11.0) 5.1 (0.2) 15.6 (0.4) 32.6 (0.3) 46.7 (0.5) 891.5 (9.4)
High OA women 37 337,066 (32,206) 388.1 (39.2) 3.2 (0.7) 13.4 (1.6) 35.4 (1.8) 48.0 (2.8) 876.2 (16.0)
p-value 0.004 0.005 <0.001 0.033 0.118 0.371 0.75
Intermediate OA men 175 346,091 (8743) 390.6 (10.7) 3.7 (0.2) 13.3 (0.5) 31.1 (0.5) 51.9 (0.8) 897.5 (9.5)
Intermediate OA women 125 279,822 (10,002) 326.7 (11.1) 2.1 (0.2) 11.8 (0.5) 34.5 (0.8) 51.4 (1.2) 863.9 (7.6)
p-value <0.001 <0.001 <0.001 0.092 <0.001 0.554 0.018
Low OA men 207 317,172 (9801) 359.4 (9.3) 3.9 (0.2) 10.5 (0.5) 26.3 (0.8) 59.2 (1.1) 890.4 (8.0)
Low OA women 316 258,408 (4913) 295.8 (5.0) 2.3 (0.1) 9.1 (0.2) 30.6 (0.2) 57.9 (0.4) 880.4 (4.8)
p-value <0.001 <0.001 <0.001 <0.001 <0.001 0.227 0.373
a
Adjusted for age, BMI, race/ethnicity, household income, education, marital status, smoking category, wear time. TAC, total activity counts; Activity counts/min, activity counts per minute; MVPA percentage, proportion of time spent in moderate-to-vigorous physical activity (≥2020 counts) per daily minutes of wear time; Lifestyle percentage, proportion of time spent in lifestyle intensity physical activity (760–2019 counts) per daily minutes of wear time; Light percentage, proportion of time spent in light intensity physical activity (100–759 counts) per daily minutes of wear time; Sedentary percentage, proportion of time spent in sedentary intensity activity (0–99 counts) per daily minutes of wear time; wear time, daily minutes of accelerometer wear time,p-value, used alpha = 0.05/7
Internati
onal
Journal
of
Behavioral
Nutrition
and
Physical
Activity
(2015) 12:89
Page
15
of
may have been only one athlete in the ‘writers, artists, entertainers, and athletes’ category). Even within the same occupation variability of PA can be large. For ex-ample, cross-country truck drivers spend considerably greater amounts of time sitting compared to local deliv-ery truck drivers who spend a significant amount of time unloading [43]. Additionally, this analysis was not re-stricted to actual working hours due to the inability to isolate work from non-work time using the data as it was originally acquired. Information regarding regular working hours, shift work or alternative work schedules was not available. Because we were unable to account for variability in occupations within occupational cat-egories, and unable to stratify PA and SB taking place during work or leisure time these limitations could re-sult in non-differential exposure misclassification [47], and limits the ability to accurately interpret these data and ultimately make recommendations about changing behaviors within specific domains.
This study provides benchmark values for accelerometer-derived PA and SB variables, organized by occupation category, which will facilitate comparisons between and across studies using the same classification scheme. Creating tertiles of the summary score from all six accelerometer-derived variables to objectively classify the 40 occupational categories into low OA, intermedi-ate OA, and high OA groupings does have limitations. In some cases, solely focusing on the summary score obscured interesting differences only apparent when closely considering the concurrent rankings of all accelerometer-derived variables between all occupa-tional categories. For example, and consistent with pre-vious research, some low OA occupational categories (e.g.,‘engineers, architects, and scientists’, ‘technicians and related support occupations’,‘management related occupations’,‘writers, artists, entertainers, and athletes’, and ‘executives, administrators, and managers’) associ-ated with higher education (>80 % had more than a high school education) and higher income (>70 % earned more than 45K/ year) accumulated relatively higher amounts of MVPA, likely due to increased engagement in leisure time exercise [24, 25, 48]. The higher amount of MVPA relative to the lower summary score in the ‘protective service occupations’ (e.g., firefighters, police and sheriff’s patrol officers, fish and game wardens) was likely due to a combination of increased time spent in vigorous leisure time PA and OA [49]. Because we were unable to separate LTPA from OA, such implications are purely speculative. Although the tertile approach is data-driven, it was possible for two occupations with very similar summary scores to end up in separate OA groupings, for example,‘motor vehicle operators’with a summary score of 87 in the high OA group, and‘ supervi-sors and proprietors, sales occupations’ with a summary
score of 89 in the intermediate OA group. Because there was no clear break in the categories, we made an arbitrary split between the 14th and 15th summary scores, despite the small difference in summary score.
In line with previous research, we showed that men were more active (inferred from higher values for TAC, activity counts/minute, and MVPA) than women [37, 40, 50, 51] within the same OA groupings after adjusting for char-acteristics known to be related to PA. In addition our data highlighted differences in PA of men and women within the same occupational category, and showed obvious differences in the proportion of men and women employed in specific occupational categories. For example, in our sample, only men were employed in many high OA occupational categories, while several low OA occupational categories were 100 % women. Due to gender differences in PA, the proportion of women in an occupational category may affect the re-sults. The proportion of men and women employed as ‘engineers, architects, and scientists’, ‘technicians and related support occupations’,‘management related oc-cupations’, ‘executives, administrators, and managers’, protective services’, and ‘writers, artists, entertainers, and athletes’may be another explanation for why these low OA occupational categories had higher than ex-pected MVPA relative to their summary score. These six low OA occupational categories contained 60 % men, while the remaining eight low OA occupational categories comprised only 25 % men.
to the relative standard error rule occurred and pre-sented the sample size of each occupational category within the tables. Because of sample size limitations we chose to present a more conservative descriptive epi-demiology of accelerometer-derived variables rather than conducting statistical comparisons between occupational categories, and men and women. However, showing the number of men and women in each category of the current sample was informative, especially in cases where the whole category was men, or exclusively women. As the number of women entering the work force has grown in the last half century, it would be use-ful to develop sex-specific estimates for OA in different occupational categories. Unfortunately, the occupational
categories for NHANES 2005–2006 were different, so
enlargement of the sample by incorporation of multiple waves of NHANES was not possible.
A major strength of this study was the use of acceler-ometers to objectively measure PA. At the time of data collection, uniaxial accelerometers were the method of choice, and weaknesses related to uniaxial, count-based PA measurement must be acknowledged. Accelerome-ters do not capture all types of PA, nor do they provide information on the type of PA performed, and their abil-ity to accurately identify time spent in specific intensabil-ity categories has been questioned [53–55]. When worn at the waist accelerometers are most sensitive to ambula-tory PA, and therefore the additional intensity of carry-ing loads, or other upper body movements is not captured [37]. This instrument has been validated against measured activity energy expenditure [56, 57], however it has not been validated for capturing the PA patterns characterizing OA in different occupations. The PA patterns characterizing OA (e.g., mostly sitting, and standing, with little walking, engaging in repetitive tasks) differ significantly from LTPA patterns which usually
involve dynamic movements that engage large muscle groups resulting in increased whole-body metabolism and cardiac output, and are often emphasized for their the health-promoting capacity [16]. Considering the di-verse movement requirements of different occupations (e.g., degree of static work, upper body work, standing, moving, lifting and loading occupations) [16], the ob-served differences in PA between the occupational cat-egories may be more a reflection of the ambulatory movement captured by the uniaxial waist worn acceler-ometer than differences in other forms of OA. If carry-ing loads and upper body movements (e.g., food trays, pitchers/pots for ‘waiters and waitresses’ who had the largest proportion of light PA) were considered, the PA intensity may have been considerably higher.
The movement captured by the accelerometer reflects the accumulation of PA at home, in transit, during leis-ure time, in addition to time at work [37]. The differ-ences in accelerometer-derived PA and SB variables between OA groupings occurred during traditional work hours (9 am–5 pm). Outside of traditional work hours OA groupings had similar levels of PA and SB. This sup-ports our analytical assumption that the majority of workers were working a traditional day shift, and that the differences in accelerometer-derived PA and SB vari-ables were likely due to OA. However, we must acknow-ledge our inability to separate PA and SB taking place during work and leisure time, and previous research which indicates that OA and LTPA is profoundly differ-ent in varying occupations. Blue collar workers with physically strenuous occupations and frequent overtime work are significantly less likely to engage in LTPA, while white collar workers may engage in greater LTPA, after a sedentary day at work [24, 25, 48].
An additional concern regarding waist worn, uniaxial accelerometers is their inability to accurately differentiate
Fig. 1TAC of men and women by OA category against population-referenced TAC percentiles [21].TACtotal activity counts per day,High OA
between sitting and standing postures [58–60], which can result in the misclassification of standing-light work, a light intensity PA, as sedentary [61–63]. Some occupations traditionally spend much of the work day in an upright posture, standing and/or moving around in light intensity behaviors (e.g., teachers, cooks, retail, waiters and wait-resses). The increased energy expenditure and postural demands of standing compared with sitting may be an im-portant distinction to consider when evaluating health outcomes [60, 64]. For assessing and differentiating be-tween sitting and standing postures bebe-tween different occupations, a thigh-mounted accelerometer like the ActivPAL monitor [65] or Actigraph [66], or triaxial ac-celerometer (ActiGraph GT3X+) at the thigh or hip may provide greater accuracy [67].
Conclusions
Objectively measured PA allowed for a more precise es-timate of the amount of PA and SB associated with dif-ferent occupational categories, and made it possible to systematically classify 40 different occupational categor-ies into three distinct OA groupings. An individual’s oc-cupational category appeared to have a great influence on daily PA and SB. This information provides new op-portunities to explore the relationship between OA and health outcomes. It is also important for the design and implementation of programs and policies to improve health, productivity, and reduce work related injury of the employed population. Future occupational epidemio-logical research is needed to understand how variations in OA, LTPA, transportation, and household PA interact to influence engagement in beneficial amounts of daily PA, and influence health [17]. In addition, future re-search should continue to refine recommendations of maximal levels of OA, because strenuous OA can have health-detrimental impacts such as musculoskeletal dis-orders, decreased work ability and absence due to work related sickness or injury [68]. The results reported here highlight the scarcity of the data available for certain oc-cupational categories to conduct and inform such stud-ies. A larger sampling of underrepresented occupational categories, and a wide range of unique occupational cat-egories would benefit future research concerned with the impact of occupation on PA and SB. The observed values presented in this paper are an important resource that should be expanded and refined as future changes occur in OA and as occupational categorization systems evolve.
Abbreviations
OA:Occupational activity; PA: Physical activity; SB: Sedentary behavior; NHANES: National Health and Nutrition Examination Survey; TAC: Total activity counts/day; MVPA: Moderate-to-vigorous physical activity; NCHS: National Center for Health Statistics; SE: Standard error.
Competing interests
The authors declare that they have no competing interests.
Authors’contributions
JAS is the guarantor of this work and, as such, had full access to all the data in the study and takes responsibility for the integrity of the data and the accuracy of the data analyses. JAS, RAM, ECF, CTL, GAK, and TBH, contributed to conception and design of the study. JAS performed statistical analyses. JAS wrote the initial draft of the paper, and all authors contributed to interpretation of the data and the writing of the paper. All authors read and approved the final paper.
Acknowledgements
This work was supported by the Intramural Research Program of the National Institute on Aging, National Institutes of Health. The authors acknowledge the editorial assistance of the NIH Fellows Editorial Board, National Institutes of Health.
Author details
1
Department of Kinesiology, University of Wisconsin-Milwaukee, 2400 E Hartford Avenue, Milwaukee, WI 53201, USA.2Walking Behavior Laboratory, Pennington Biomedical Research Center, Baton Rouge, LA, USA.3Laboratory of Epidemiology and Population Sciences, National Institute on Aging, Bethesda, MD, USA.4Department of Kinesiology, University of Texas, El Paso, TX, USA.5Department of Kinesiology, Recreation, and Sports Studies, University of Tennessee, Knoxville, TN, USA.
Received: 11 December 2014 Accepted: 1 May 2015
References
1. Blair SN, Morris JN. Healthy hearts–and the universal benefits of being physically active: physical activity and health. Ann Epidemiol. 2009;19(4):253–6.
2. Haskell WL, Lee IM, Pate RR, Powell KE, Blair SN, Franklin BA, et al. Physical activity and public health: updated recommendation for adults from the American College of Sports Medicine and the American Heart Association. Med Sci Sports Exerc. 2007;39(8):1423–34.
3. Leitzmann MF, Park Y. Physical activity recommendations and decreased risk of mortality. Arch Intern Med. 2007;167(22):2453–60.
4. Physical Activity Guidelines Advisory Committee. Physical Activity Guidelines Advisory Committee Report, 2008. 2008.
5. Owen N, Sugiyama T, Eakin EE, Gardiner PA, Tremblay MS, Sallis JF. Adults’ sedentary behavior determinants and interventions. Am J Prev Med. 2011;41(2):189–96.
6. U. S. Department of Health and Human Services. Physical activity guidelines for Americans (Report). 2008. p. 1–4.
7. Barengo NC, Hu G, Lakka TA, Pekkarinen H, Nissinen A, Tuomilehto J. Low physical activity as a predictor for total and cardiovascular disease mortality in middle-aged men and women in Finland. Eur Heart J.
2004;25(24):2204–11.
8. Holtermann A, Mortensen OS, Burr H, Sogaard K, Gyntelberg F, Suadicani P. The interplay between physical activity at work and during leisure time–risk of ischemic heart disease and all-cause mortality in middle-aged Caucasian men. Scand J Work Environ Health. 2009;35(6):466–74.
9. Krause N, Brand RJ, Kaplan GA, Kauhanen J, Malla S, Tuomainen TP, et al. Occupational physical activity, energy expenditure and 11-year progression of carotid atherosclerosis. Scand J Work Environ Health. 2007;33(6):405–24. 10. Paffenbarger RS, Hale WE. Work activity and coronary heart mortality. N Engl
J Med. 1975;192:545–50.
11. Choi B, Schnall PL, Yang H, Dobson M, Landsbergis P, Israel L, et al. Sedentary work, low physical job demand, and obesity in US workers. Am J Ind Med. 2010;53(11):1088–101.
12. Steeves JA, Bassett Jr DR, Thompson DL, Fitzhugh EC. Relationships of occupational and non-occupational physical activity to abdominal obesity. Int J Obes (Lond). 2012;36(1):100–6.