R E V I E W
Open Access
A systematic review of reliability and objective
criterion-related validity of physical
activity questionnaires
Hendrik JF Helmerhorst
1,2, Søren Brage
1, Janet Warren
3,4, Herve Besson
1and Ulf Ekelund
1,5*Abstract
Physical inactivity is one of the four leading risk factors for global mortality. Accurate measurement of physical
activity (PA) and in particular by physical activity questionnaires (PAQs) remains a challenge. The aim of this paper
is to provide an updated systematic review of the reliability and validity characteristics of existing and more
recently developed PAQs and to quantitatively compare the performance between existing and newly
developed PAQs.
A literature search of electronic databases was performed for studies assessing reliability and validity data of
PAQs using an objective criterion measurement of PA between January 1997 and December 2011. Articles meeting
the inclusion criteria were screened and data were extracted to provide a systematic overview of measurement
properties. Due to differences in reported outcomes and criterion methods a quantitative meta-analysis was
not possible.
In total, 31 studies testing 34 newly developed PAQs, and 65 studies examining 96 existing PAQs were included.
Very few PAQs showed good results on both reliability and validity. Median reliability correlation coefficients were
0.62
–
0.71 for existing, and 0.74
–
0.76 for new PAQs. Median validity coefficients ranged from 0.30
–
0.39 for existing,
and from 0.25
–
0.41 for new PAQs.
Although the majority of PAQs appear to have acceptable reliability, the validity is moderate at best. Newly
developed PAQs do not appear to perform substantially better than existing PAQs in terms of reliability and validity.
Future PAQ studies should include measures of absolute validity and the error structure of the instrument.
Keywords:
Systematic review, Physical activity, Self-report, Accelerometry, Validity, Reliability
Background
Physical inactivity is considered to be one of the four
lead-ing risk factors for global mortality [1]. The measurement
of physical activity is a challenging and complex
proced-ure. Valid and reliable measures of physical activity (PA)
are required to: document the frequency, duration and
distribution of PA in defined populations; evaluate the
prevalence of individuals meeting health
recommenda-tions; examine the effect of various intensities of physical
activity on specific health parameters; make cross-cultural
comparisons and evaluate the effects of interventions [2].
Physical activity questionnaires (PAQs) are often the
most feasible method when assessing PA in large-scale
studies, likely because of their low cost and convenience
but these instruments have limitations and should be
selected and used judiciously. PAQs are prone to
meas-urement error and bias due to misreporting, either
delib-erate (social desirability bias) or because of cognitive
limitations related to recall or comprehension [3,4].
Cog-nitive immaturity or degeneration can make self-report
of physical activity particularly difficult in the young and
elderly [5,6]. Despite more frequent use of objective
assessment methods to measure physical activity, PAQs
still provide a practical method for PA assessment in
surveillance systems, for risk stratification and when
examining etiology of disease in large observational
studies. Most PAQs are designed to be able to measure
* Correspondence:[email protected]1Medical Research Council Epidemiology Unit, Cambridge, UK 5
Department of Sports Medicine, Norwegian School of Sport Sciences, Oslo, Norway
Full list of author information is available at the end of the article
© 2012 Helmerhorst et al.; licensee BioMed Central Ltd. This is an Open Access article distributed under the terms of the Helmerhorstet al. International Journal of Behavioral Nutrition and Physical Activity2012,9:103
multiple dimensions of PA by reporting type, location,
domain and context of the activity, provide estimates of
time spent in activities of various levels of intensity, and
may be able to rank individuals according to intensity
levels of reported activity [7,8]. However, results from
studies aimed at evaluating the validity of PAQs assessed
in one population cannot be systematically extrapolated
to other populations, ethnic groups, or other
geograph-ical regions. Consequently, a great variety of PAQs have
been developed and tested for reliability and validity in
recent years.
A comprehensive review of PAQs for use in adults was
published in 1997 [9]. Since then, reviews summarizing
the validity and reliability of PAQs have been carried
out in children [10-12] and preschoolers [13]. Recently,
specific reviews were published assessing the quality
of PAQs available for children [11], adults [14] and the
elderly [15]. The aim of the present study was to
system-atically review the literature on reliability of PAQs as
well as their validity evaluated against objective criterion
methods, for use in all age groups, published between
January 1997 and December 2011 to quantitatively
com-pare the performance between existing and newly
devel-oped PAQs.
Methods
Inclusion criteria
Studies meeting all of the following inclusion criteria
were included: (i) published in the English language
between January 1997 and December 2011; (ii) self- or
interviewer-administered PAQs or parental proxy reports
reporting both reliability and validity results; (iii) PAQs
reporting validity results only, when the reliability data
has been published previously; (iv) PAQs developed for a
healthy general population and for observational
surveil-lance studies; (v) PAQs tested in its original form or in
an adapted version if results were reported for validity
and reliability or validity only, when reliability results
were published before; (vi) validity tested against an
objective criterion measure of PA (i.e. accelerometry,
heart rate, combined heart rate and accelerometry,
doubly labeled water (DLW)); (vii) results on validity
obtained by pedometer where the questionnaire was
spe-cifically developed to assess walking only.
Exclusion criteria
We excluded studies that reported: (i) reliability and
val-idity results in groups with specific clinical or medical
conditions (except pregnancy); (ii) results from PAQs
that were designed for specific intervention studies;
(iii) results where the validity of the PAQ was tested
against another self-report method (i.e. diaries, logs);
(iv); results on validity using pedometers (except if
walk-ing only was tested) and indirect measures of physical
activity (e.g. VO
2maxand body composition); (v) results
on essential adaptations of original PAQs, without any
published results on both reliability and validity.
Literature search
The PubMed, Medline and Web of Science databases
were systematically searched using the following lists
and terms:
List A: (physical activity AND health survey OR
population survey OR question*)
List B: List B: measure* (i.e. measures, measurement),
assess* (i.e. assessment, assessed), self-report,
exercise, valid* (i.e. valid, validation, validity),
reliab* (i.e. reliable, reliability), reproducible,
accelerometer, heart rate, doubly labelled water,
doubly labeled water. The search included titles,
abstracts, key words and full texts.
Key search terms in List A were combined with each
of the terms in List B.
The literature search was undertaken in two stages.
The original literature search (1997
–
2008) was
under-taken by two of the authors (JW, HB) independently
and search results were compared and verified. The
literature search was then updated to include studies up
to December 2011 using exactly the same search criteria
(HH). A second search strategy included screening
refer-ences lists of publications that matched the inclusion
criteria and any other publications of which the authors
were aware but did not show up during the original
literature search. Figure 1 displays an overview of the
literature search.
Data collection and extraction
Data were extracted using a standardized pro-forma
which included sample characteristics, questionnaire
details, methods of validity and reliability testing, test
results and authors
’
conclusions. We retrieved full text
of articles of all abstracts that met our inclusion criteria.
Any queries about the inclusion of papers were resolved
by one of the authors (UE).
Reliability
Reliability in all studies was tested through a test-retest
procedure to measure consistency of the PAQs.
Reliabil-ity results from included studies were reported as:
intra-class correlation coefficients (ICC); Pearson and Spearman
correlation coefficients; and agreement measures using
Cohen
’
s weighted kappa (
κ
) and mean differences.
Reliabil-ity was considered poor, moderate (acceptable), or strong
when correlation coefficients or kappa statistics were <0.4,
0.4
–
0.8 or >0.8, respectively [16]. Similarly, an ICC > 0.70
or >0.90 was considered as acceptable and strong,
respect-ively, in those studies reporting this measure [17].
Medians of reliability correlation coefficients across
studies were calculated and included in the tables
when possible.
Validity
Correlation coefficients were the most commonly used
measures of validity, although the Bland-Altman
tech-nique [18] which determines absolute agreement between
two measures expressed in the same units, was also
fre-quently used. The Bland-Altman method estimates the
mean bias and the 95 % limits of agreement (± 2SD of
the difference) and is usually plotted as the difference
between the methods against the mean of the methods
for visual inspection of the error pattern throughout the
measurement range; the dependence of error with the
underlying level can be summarised in the error
correl-ation coefficient but this was only seldom reported.
When calculating the medians, we excluded those studies
reporting correlation coefficients for the associations of
self-reported sedentary time. The medians for sedentary
time are reported separately and associations of sedentary
time with measures of total physical activity (i.e. total
en-ergy expenditure [TEE], physical activity level [PAL] and
total activity from accelerometry [mean counts]) from the
criterion method were excluded in these analyses as these
measures are expected to be inversely related.
Classification
Questionnaires were classified as new or existing (i.e.
previ-ously published test results) PAQ. Existing questionnaires
were subdivided into those which reported new reliability
and validity results, and those which reported new results
on validity only but had previously reported results on
reli-ability. Questionnaires were classified as new, when the
concerning study was the first to publish reliability and
ob-jective validity data on the PAQ. Hereafter, studies were
fur-Figure 1Overview of the literature search.categorised as youth, 18
–
65 years were classified as adults,
and elderly above 65 years.
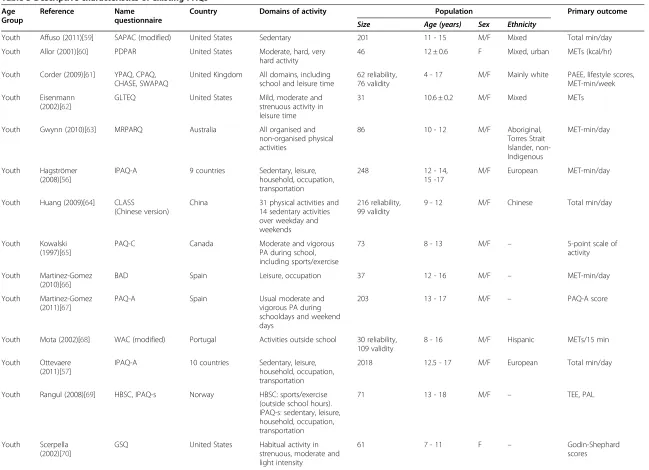
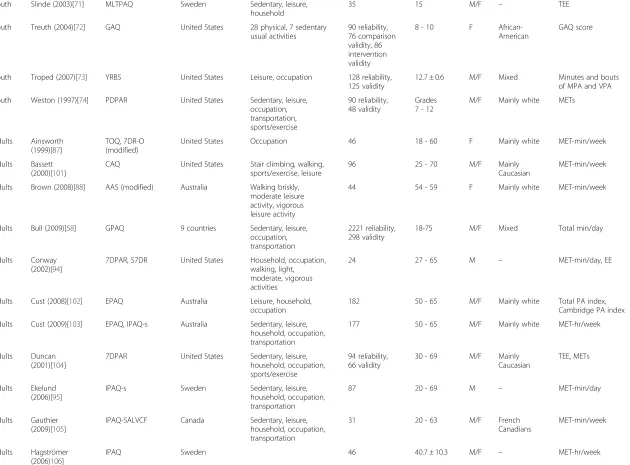
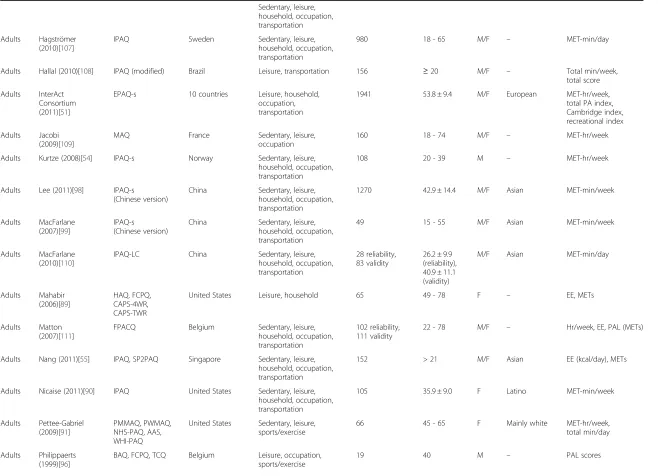
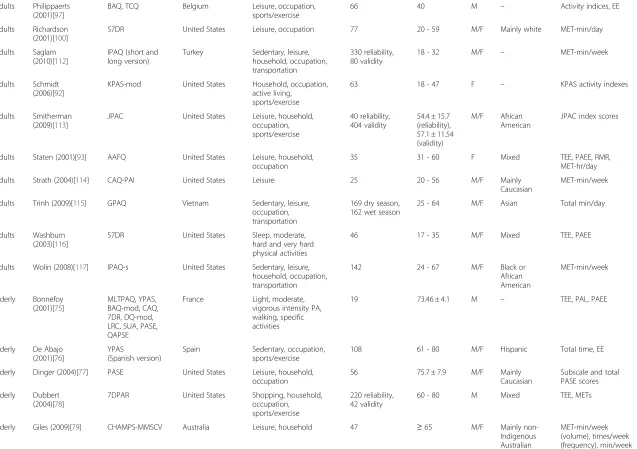
PAQs included
PAQ abbreviations are listed in Table 1, with their
respective timeframe. The details of these studies are
shown in Tables 2 (new PAQs) and 5 (existing PAQs). A
range of tests were used to assess reliability and validity
with some studies reporting results for a total
question-naire summary score, and others assessing reliability
and validity for various aspects, intensities, or domains
of the questionnaire and/or by subgroups within the test
population. The total score or index for the PAQ was
reported, if available. In the absence of a total score,
cor-relation coefficients by intensity category or group are
reported. Where multiple results were reported, a
deci-sion was made about the data that constituted the main
results based on the stated objectives for the study
or questionnaire. Several studies compared results to
another questionnaire concurrently but if this was a
secondary aim of the specific study, the results were
not included.
Results were reported for both total score and other
aspects (e.g. domain, intensity) when this substantially
added to the information for the specific study, for
example when total PA was tested against a different
validation method than PA intensities [31]. Some
ques-tionnaires assessed sedentary behaviour and these results
are specifically reported in the tables or text. Sedentary
behaviour has recently been suggested to be considered
distinctively from physical activity in associations with
health outcomes [50].
Results
The search string (JW and HH) resulted in a total of
11098 hits. The first literature search resulted in 125
papers being retrieved for data extraction. The update
of the literature review to December 2011 resulted in a
further 75 papers being retrieved for data extraction
(Figure 1). More than half of the papers retrieved were
excluded (n = 104). The main reasons for exclusion were
inappropriate criterion measures, generally a measure of
aerobic fitness (n = 48), and lack of information on
reli-ability (n = 26) or validity (n = 17) (Figure 1).
New PAQs
The description of newly developed PAQs is
summar-ized in Table 2. The literature search found 31 articles,
reporting results from 34 newly developed PAQs of
which 10 were from the United States, 10 from Europe,
six from Australia, two from Canada, and one study
from Japan and Sub-Saharan Africa, respectively. Of
note was a 12
–
country international study testing the
International Physical Activity Questionnaire (IPAQ)
[34]. This questionnaire is available in a short form for
surveillance and in a longer form when more detailed
physical activity information is collected. Both forms
are available in a number of languages. IPAQ has been
rigorously tested for reliability and validity and this has
been replicated in a number of countries.
Nineteen studies tested the reliability and validity in
adults, an additional 11 studies focused on youth [19-29]
and one study was performed in Japanese elderly (n = 1)
[49]. Most studies (n = 25) included men and women,
four studies [26,30,32,35] reported data in women and
two studies [37,38] in men only. The number of
partici-pants varied from 30 to 2271, and several studies
[19,20,29,31,33-35,39-41,43-47]
performed
reliability
testing in a larger sample than their test of criterion
validity. The most common response timeframe was the
last seven days, with seven studies [27,30,36,37,44,46,47]
using a timeframe covering the last year (Table 1). All
PAQs captured some elements of leisure time and
recre-ational activity, although most questionnaires also
addressed multiple domains of activity. Sedentary time is
also a commonly captured behaviour from the newly
developed questionnaires and has been given some extra
attention in recent publications and in the current
results. Several recent PAQs, such as the EPIC Physical
Activity Questionnaire (EPAQ2) and the Recent Physical
Activity Questionnaire (RPAQ), aim to measure the
to-tality of physical activity by domains [31,46,47,51]. The
final outcome of the majority of PAQs was reported as
time-integrated MET values, e.g. MET-min/week.
Reliability
All reliability results for new PAQs are listed in Table 3.
Reliability was usually reported as ICC (n = 13),
Pear-son/Spearman correlation (n = 6), kappa statistic (n = 3)
or a combination of these statistics (n = 9). Higher
reli-ability coefficients were more often seen in association
with shorter periods between test and retest. Poor
cor-relation (ICC or r <0.4) was found only in subcategories
of a few PAQs. Median correlations from reported data
for recall of sedentary behaviours across all PAQs were
acceptable:
ICC = 0.68,
Spearman
r = 0.60,
Pearson
r = 0.475, kappa = 0.66.
Youth
Median reliability correlations for the youth were as
follows: ICC = 0.69, Spearman r = 0.71, Pearson r = 0.80,
kappa = 0.53. The Activitygram (ICC = 0.24) [26] and the
self-reported CLASS questionnaire (frequency: ICC =
0.36, duration ICC = 0.24) [25] showed fairly low
reliabil-ity correlations, whereas the MARCA (ICC = 0.93) [52]
and both computer and paper versions of the CDPAQ
(ICC = 0.91
–
0.98) [23] demonstrated high reliability.
Table 1 List of questionnaire abbreviations and the corresponding definitions
Acronym Definition Timeframe
1WPAR One-week Physical Activity Recall Last 7 days
7DPAR 7-Day Physical Activity Recall Last 7 days
7DR 7-Day Recall Last 7 days
7DR-O 7-Day Recall (occupational activity) Last 7 days
AAFQ Arizona Activity Frequency Questionnaire Last 28 days
AAS Active Australian Survey (modified version) Last 7 days, usual week
Activitygram Activitygram Last 3 days
AQuAA Activity Questionnaire for Adolescents and Adults Last 7 days
AWAS Australian Women's Activity Survey Typical week last month
BAD Bouchard Activity Diary Last 3 days
BAQ Baecke Activity Questionnaire Usual activity
BAQ-mod Baecke Activity Questionnaire (modified version) Last year
BONES PAS Beat Osteoporosis: Nourish and Exercise Skeletons Physical Activity Survey
Last 2 days
BRFSS PAQ Behavioral Risk Factor Surveillance System Physical Activity Questionnaire (2001 version)
Typical week
CAPS-4WR Cross-Cultural Activity Participation Study–4 Weeks activity Recall
4 weeks
CAPS-TWR Cross-Cultural Activity Participation Study–Typical Week activity Recall
Typical week
CAQ College Alumnus Questionnaire Last 7 days
CAQ-PAI College Alumnus Questionnaire–Physical Activity Index Last 7 days
CDPAQ Computer Delivered Physical Activity Questionnaire Previous day
CHAMPS Community Healthy Activities Model Program for Seniors Typical week last month
CHAMPS-MMSCV Community Healthy Activities Model Program for Seniors (Modified Mailed Self-Complete Version)
Last 7 days
CHASE Child Heart and Health Study in England questionnaire Typical week
CLASS Children's Leisure Activity Study Survey questionnaire Typical week
CPAQ Children's Physical Activity Questionnaire Last 7 days
DQ-mod Dallosso Questionnaire (modified version) Typical day last week, typical week
EPAQ EPIC Physical Activity Questionnaire Last year
EPAQ-s EPIC Physical Activity Questionnaire (short version) Last year
EPAQ2 EPIC Physical Activity Questionnaire (second version) Last year
FCPQ Five City Project Questionnaire Typical week
Fels PAQ Fels Physical Activity Questionnaire for children Last year
FPACQ Flemish Physical Activity Computerized Questionnaire Typical week
GAQ GEMS (Girls Health Enrichment Multi-site Studies) Activity Questionnaire
Previous day, usual activity
GLTEQ Godin Leisure-Time Exercise Questionnaire Typical week
GPAQ Global Physical Activity Questionnaire Typical week
GSQ Godin-Shephard Questionnaire Typical week
HAQ Harvard Alumni Questionnaire Typical week
HBSC Health Behaviour in School Children Questionnaire Typical week
HEPA99 Swiss Health Enhancing Physical Activity Survey 1999 Typical week
HUNT1 Nord-Trøndelag Health Study questionnaire (version 1) Last 7 days
Table 1 List of questionnaire abbreviations and the corresponding definitions
(Continued)
IPAQ International Physical Activity Questionnaire Last 7 days, typical week
IPAQ-A International Physical Activity Questionnaire (modified for Adolescents)
Last 7 days
IPAQ-E International Physical Activity Questionnaire (short version modified for Elderly)
Last 7 days
IPAQ-LC International Physical Activity Questionnaire (Long version in Chinese)
Last 7 days
IPAQ-s International Physical Activity Questionnaire (short version) Last 7 days
IPAQ-SALVCF International Physical Activity Questionnaire (Self-Administered Long Version in Canadian French)
Last 7 days
JPAC Jackson heart Physical Activity Cohort (i.e. modified KPAS) Last year
KPAS Kaiser Physical Activity Survey Last year
KPAS-mod Kaiser Physical Activity Survey (modified version) Current trimester
LRC Lipid Research Clinics questionnaire Usual activity
MAQ Modifiable Activity Questionnaire Last year
MARCA Multimedia Activity Recall for Children and Adolescents Previous day
MLTPAQ Minnesota Leisure Time Physical Activity Questionnaire Last year
MRPARQ Many Rivers Physical Activity Recall Questionnaire Typical week
NHS-PAQ Nurses' Health Study II–Physical Activity Questionnaire Last 7 days
OIMQ Office In Motion Questionnaire Last 7 days
OPAQ Occupational Physical Activity Questionnaire Typical week
PAAT Physical Activity Assessment Tool Last 7 days
PAQ-A Physical Activity Questionnaire for Adolescents Last 7 days
PAQ-C Physical Activity Questionnaire for older Children Last 7 days
PAQ-EJ Physical Activity Questionnaire for Elderly Japanese Typical week last month
PASE Physical Activity Scale for the Elderly Last 7 days
PDPAR Previous Day Physical Activity Recall Previous day
PMMAQ Past Month–Modifiable Activity Questionnaire Last month
PPAQ Pregnancy Physical Activity Questionnaire Current trimester
Pre-PAQ Preschool-age Children's Physical Activity Questionnaire Last 3 days (1 week, 2 weekend days)
PWMAQ Past Week–Modifiable Activity Questionnaire Last 7 days
PYTPAQ Past Year Total Physical Activity Questionnaire Last year
QAPSE Questionnaire d'Activité Physique Saint-Etienne Typical week last year
RPAQ Recent Physical Activity Questionnaire (i.e. EPAQ2 redesigned)
Last month
RPAR Recess Physical Activity Recall Last recess
S7DR Stanford 7-Day Recall Last 7 days
SAPAC Self-Administered Physical Activity Checklist (modified version)
Last 3 days
SBQ Sedentary Behavior Questionnaire Typical week
SHAPES School Health Action, Planning Evaluation System Last 7 days
SHS97 Swiss Health Survey 1997 Typical week
SP2PAQ Singapore Prospective Study Program Physical Activity Questionnaire
Last 3 months
SPAQ Scottish Physical Activity Questionnaire Last 7 days
SSAAQ Sub-Saharan Africa Activity Questionnaire Last year
SUA Stanford Usual Activity Usual activity, last 3 months
Adults
Median reliability correlations for adults were as follows:
ICC = 0.765, Spearman r = 0.75, Pearson r = 0.74, kappa =
0.655. Reliability was poor for the AQuAA score for
adults (ICC = 0.22) [53]. Similarly, reliability coefficients
were poor for the HUNT2 [37] components of light
(r = 0.17,
κ
= 0.20) and hard activity (r = 0.17,
κ
= 0.41).
The primary version of this questionnaire (HUNT1),
which was designed a decade earlier, however
demon-strated high reliability (r = 0.76
–
0.87,
κ
= 0.69
–
0.82) [54].
The majority of the questionnaires showed acceptable to
good reliability: KPAS (ICC = 0.82
–
0.83) [30], RPAQ
(ICC = 0.76) [31], PPAQ (ICC = 0.78) [32], IPAQ short
(r = 0.76) and long version (r = 0.81) [34], AWAS (ICC =
0.73
–
0.80) [35], FPACQ (ICC = 0.68
–
0.80) [22], OPAQ
(ICC = 0.78) [42], SBQ (ICC = 0.77-0.85, r = 0.74-0.79)
[43], SPAQ (r = 0.998) [39] and SSAAQ (r = 0.95) [44].
Elderly
Median Pearson reliability correlation for the elderly was
r = 0.70. The PAQ-EJ was the only new PAQ designed
for (Japanese) elderly that reported reliability results and
has acceptable recall properties (r = 0.70) [49].
Accelerometry and in particular the ActiGraph
accel-erometer was the most commonly used criterion method
(n = 19), followed by the Caltrac accelerometer (n = 4)
and the Polar heart rate monitor (n = 4). DLW was used
in one study, where absolute validity was moderate to
high for PAEE (r = 0.39) and TEE (r = 0.67) [31]. In
gen-eral, validity coefficients were considerably lower than
reliability coefficients. Median correlations across all
PAQs between reported sedentary behaviours and
calcu-lated inactivity from objective measures were low:
Spear-man r = 0.12.
Youth
Median validity correlations for the youth were as follows:
Spearman r = 0.22, Pearson r = 0.41. CLASS self- and
parental reported physical activity (r =
−
0.04
–
0.11) [25]
was among the least valid questionnaires for children,
although several other PAQs also showed low correlations
with objective measures: Pre-PAQ (r =
−
0.07
–
0.17) [19],
BONES PAS (r = 0.23
–
0.27) [20], GAQ (r = 0.27
–
0.29)
[26], Fels PAQ (0.11
–
0.34) [27]. None of the newly
devel-oped PAQs for children demonstrated high validity.
Adults
Table 1 List of questionnaire abbreviations and the corresponding definitions
(Continued)
SWAPAQ Swedish Adolescent Physical Activity Questionnaire Last 7 days
TCQ Tecumseh Community Questionnaire Last year
TOQ Tecumseh Occupational Questionnaire Last 7 days
WAC Weekly Activity Checklist Last 7 days
WHI-PAQ Women's Health Initiative–Physical Activity Questionnaire Last 7 days
YMCLS Youth Media Campaign Longitudinal Survey Last 7 days
YPAQ Youth Physical Activity Questionnaire Last 7 days, previous day
YPAS Yale Physical Activity Scale Typical week last month
YRBS Youth Risk Behavior Survey Last 7 days
PAEE Physical Activity Energy Expenditure TEE Total Energy Expenditure MPA Moderate intensity Physical Activity VPA Vigorous intensity Physical Activity
MVPA Moderate and Vigorous intensity Physical Activity PAL Physical Activity Level
MET Metabolic Equivalent of Task Acc Accelerometry
HR Heart Rate monitoring DLW Doubly Labeled Water Ped Pedometer
ML Mini-Logger
Frequently used acronyms also included at the bottom of the table.
Table 2 Descriptive characteristics of new PAQs
Age group Reference Name
questionnaire
Country Domains of activity Population Primary outcome
Size Age (years) Sex Ethnicity
Youth Dwyer (2011)[19] Pre-PAQ Australia Habitual and sedentary activities in home environment
103 reliability, 67 validity
3 - 5.9 M/F Mainly Caucasian Min/day
Youth Economos (2010)[20] BONES PAS United States Common activities for children 41 reliability, 40 validity
6 - 9 M/F – METs, WBF score
Youth Martinez-Gomez (2010)[21] RPAR Spain Sedentary, leisure, transportation, sports/exercise
125 12 - 14 M/F – MET-min, minutes
Youth Philippaerts (2006)[22] FPACQ Belgium Sedentary, leisure, occupation, transportation
33 12 - 18 M/F Mainly Caucasian Total hr/week, METs
Youth Ridley (2001)[23] CDPAQ Australia Type, duration, intensity, organization of activities before, during and after school
30 11.96 ± 0.53 M/F – METs, minutes
Youth Ridley (2006)[24] MARCA Australia Sedentary, leisure, household, occupation, transportation, sports/exercise during a school day or another day
32 reliability, 66 validity
9 - 15 M/F – PAL, EE, total time in any activity
Youth Telford (2004)[25] CLASS Australia 30 physical activities over weekdays and weekends
280 5 - 6, 10 - 12 M/F Mainly Australian born
Total min/week
Youth Treuth (2003)[26] GAQ, Activitygram
United States GAQ: 28 physical, 7 sedentary usual activities. Activitygram: log of all activities in light, moderate, vigorous intensity
68 8 - 9 F African-American GAQ score, Activitygram score
Youth Treuth (2005)[27] Fels PAQ United States Leisure, occupation, sports/exercise
229 7 - 19 M/F – Fels PAQ scores
Youth Welk (2007)[28] YMCLS United States Free time activity, organized activity, any outside school activity
192 9 - 13 M/F Mixed Frequency/week,
min/day
Youth Wong (2006)[29] SHAPES Canada Moderate and vigorous activity and participation in physical, sedentary activities
1636 reliability, 67 validity
Grades 6 - 12 M/F Mixed Min/day, EE
Adults Ainsworth (2000)[30] KPAS United States Household, occupation, sports/exercise, active living habits
50 20 - 60 F Mainly white KPAS activity indexes
Adults Besson (2010)[31] RPAQ United Kingdom Sedentary, leisure, household, occupation, transportation
131 reliability, 50 validity
21 - 55 M/F – MET-hr/day,
PAEE (kJ/day), TEE (kJ/day)
Adults Chasan-Taber (2004)[32] PPAQ United States Sedentary, household, occupation, transportation, sports/exercise
63 16 - 40 F Mixed MET-hr/week
Helmerho
rst
et
al.
Internationa
lJournal
of
Behavio
ral
Nutrition
and
Physical
Activity
2012,
9
:103
Page
8
o
f
5
5
http://ww
w.ijbnpa.org
/content/9
Table 2 Descriptive characteristics of new PAQs
(Continued)
Adults Chinapaw (2009)[33] AQuAA Netherlands Sedentary, leisure, household, occupation, transportation, sports/exercise
111 reliability, 89 validity
12 - 38 M/F – MET-min/week,
AQuAA score
Adults Craig (2003)[34] IPAQ 12 countries Short form: sitting, walking, moderate and vigorous intensity. Long form: sedentary, leisure, household, occupation, transportation
Long form: 1880 reliability, 744 validity Short form: 1974 reliability, 781 validity.
18 - 65 M/F Mixed Weighted
MET-min/week
Adults Fjeldsoe (2009)[35] AWAS Australia Sedentary, household, occupation, transportation, planned activities
40 reliability, 75 validity
32 ± 5 F – Total min/week
for each intensity level
Adults Friedenreich (2006)[36] PYTPAQ Canada Leisure, household, occupation 154 35 - 65 M/F – MET-hr/week, total hours/week
Adults Kurtze (2007)[37] HUNT2 Norway Leisure, occupation in light and hard intensity
108 20 - 39 M – Light, hard PA
summary score
Adults Kurtze (2008)[38] HUNT1 Norway Leisure 108 20 - 39 M – Summary index of
weekly PA
Adults Lowther (1999)[39] SPAQ Scotland Leisure, occupation in moderate, hard, very hard intensity
34 reliability, 30 validity
33 ± 12,
33 ± 11 (reliability); 37 ± 11,
35 ± 14 (validity)
M/F – Total min/week
Adults Mäder (2006)[40] SHS97, HEPA99, IPAQ, OIMQ
Switzerland Sedentary, leisure, household, occupation, transportation
178 reliability, 35 validity
15 - 75 M/F Mainly Caucasian
MET-min/week, days/week, combined variable
Adults Meriwether (2006)[41] PAAT United States Leisure, household, occupation, transportation
68 reliability, 63 validity
20 - 61 M/F Mainly white Total min/week
Adults Reis (2005)[42] OPAQ United States Occupational sitting/standing, walking, heavy labour
41 20 - 63 M/F – MET-min/week
Adults Rosenberg (2010)[43] SBQ United States 9 sedentary activities 49 reliability, 842 validity
20.4 ± 1.3 (reliability); ♀41.2 ± 8.7, ♂43.9 ± 8.0 (validity)
M/F Mainly white Total hr/week
Adults Sobngwi (2001)[44] SSAAQ Cameroon Leisure, occupation, walking/cycling
89 reliability, 54 acc, 89 HR
19 - 68 M/F African Total hr/day, MET-hr/day
Adults Timperio (2003)[45] 1WPAR Australia All activities in walking, moderate, vigorous intensity
118 reliability, 122 validity
25 - 47 M/F – MET-min/day
Adults Wareham (2002)[46] EPAQ2 United Kingdom Sedentary, leisure, household, occupation, transportation
399 reliability, 173 validity
40 - 74 M/F Mixed MET-hr/week
Adults Wareham (2003)[47] EPAQ-s United Kingdom Leisure, household, occupation, transportation
2271 reliability, 173 validity
40 - 74 M/F Mixed PA index,
mean day PAR
Helmerho
rst
et
al.
Internationa
lJournal
of
Behavio
ral
Nutrition
and
Physical
Activity
2012,
9
:103
Page
9
http://ww
w.ijbnpa.org
/content/9
Table 2 Descriptive characteristics of new PAQs
(Continued)
Adults Yore (2007)[48] BRFSS PAQ (2001 version)
United States Leisure, household, occupation, transportation
60 44.5 ± 15.7 M/F Mixed MPA and VPA
min/week
Elderly Yasunaga (2007)[49] PAQ-EJ Japan Household, occupation, transportation, sports/exercise
147 65 - 85 M/F Japanese PAQ-EJ score
(MET-hr/week)
Domains named in paper were reclassified, unless the activities were very different from categories used, according to the following system: Occupation: work, school, labour.Transportation: travel, commuting, employment.Household: home/life, housework, caregiving, domestic life, child/elder/self care, cooking, chores, gardening, stair climbing. Leisure: leisure, recreation time. Sports/exercise: play, sports, exercise, workout. Sedentary: sedentary behaviours, e.g. sitting, TV viewing activities, eating, sleeping, bathing, inactivity."–= not stated, M = Male, F = Female.
Helmerho
rst
et
al.
Internationa
lJournal
of
Behavio
ral
Nutrition
and
Physical
Activity
2012,
9
:103
Page
10
of
55
http://ww
w.ijbnpa.org
/content/9
Table 3 Reliability results of new PAQs
Age Group Reference Test-retest period
PAQ Variables tested Reliability results
Correlation coefficients Agreement
Youth Dwyer (2011)[19] 1 - 2 weeks Pre-PAQ Level 5 min/day(Q1)–level 5 min/day(Q2) ICC = 0.64 –
Level 4 min/day(Q1)–level 4 min/day(Q2) ICC = 0.44 –
Level 3 min/day(Q1)–level 3 min/day(Q2) ICC = 0.53 –
Levels 1–2 min/day(Q1)–levels 1– 2 min/day(Q2)
ICC = 0.44 –
Youth Economos (2010)[20] 1 - 2 hours BONES PAS High METs(Q1)–high METs(Q2) Spearman r (95 % CI) =
0.57 (0.32;0.75), P < 0.001 –
Moderate-high METs(Q1)–moderate-high METs(Q2)
Spearman r (95 % CI) =
0.74 (0.56;0.85), P < 0.001 –
WBF score(Q1)–WBF score(Q2) Spearman r (95 % CI) =
0.71 (0.51;0.83), P < 0.001 –
Youth Martinez-Gomez (2010)[21]
1 hour RPAR Total MET-min(Q1)–total MET-min(Q2) ICC = 0.87 –
Youth Philippaerts (2006)[22] 9 days FPACQ Total hr/week(Q1)–total hr/week(Q2) ICC = 0.68 κ= 0.50
Total EE(Q1)–total EE(Q2) ICC = 0.80 κ= 0.53
Inactivity(Q1)–inactivity(Q2) ICC = 0.83 κ= 0.61
Youth Ridley (2001)[23] 7 days CDPAQ Total METs(Q1)–total METs(Q2) ICC = 0.98 (P < 0.05) –
Total min(Q1)–total min(Q2) ICC = 0.91 (P < 0.05) –
CDPAQ-HC Total METs(Q1)–total METs(Q2) ICC = 0.98 (P < 0.05) –
Total min(Q1)–total min(Q2) ICC = 0.96 (P < 0.05) –
Youth Ridley (2006)[24] Within 24 hours
MARCA PAL(Q1)–PAL(Q2) ICC = 0.93 95 % LoA =−0.30–0.30
Youth Telford (2004)[25] > 14 days CLASS-parental report
5-6 yrs: frequency(Q1)–frequency(Q2) ICC = 0.83 (P < 0.001) –
10-12 yrs: frequency(Q1)–frequency(Q2) ICC = 0.69 (P < 0.001) –
5-6 yrs: duration(Q1)–duration(Q2) ICC = 0.76 (P < 0.001) –
10-12 yrs: duration(Q1)–duration(Q2) ICC = 0.74 (P < 0.001) –
CLASS-self 10-12 yrs: frequency(Q1)–frequency(Q2) ICC = 0.36 (P < 0.01) –
10-12 yrs: duration(Q1)–duration(Q2) ICC = 0.24 –
Youth Treuth (2003)[26] 4 days GAQ Yesterday: GAQ score(Q1)–GAQ score(Q2) Pearson r = 0.7833 (P < 0.0001) –
Usual: GAQ score(Q1)–GAQ score(Q2) Pearson r = 0.8187 (P < 0.0001) –
Pearson r = 0.3454 (P = 0.0043) –
Helmerho
rst
et
al.
Internationa
lJournal
of
Behavio
ral
Nutrition
and
Physical
Activity
2012,
9
:103
Page
11
http://ww
w.ijbnpa.org
/content/9
Table 3 Reliability results of new PAQs
(Continued)
Yesterday: TV watching(Q1)–TV watching(Q2)
Usual: TV watching(Q1)–TV watching(Q2) Pearson r = 0.3827 (P = 0.0015) –
Yesterday: other sedentary(Q1)–other sedentary(Q2)
Pearson r = 0.4695 (P < 0.0001) –
Usual: other sedentary(Q1)–other sedentary(Q2)
Pearson r = 0.4837 (P < 0.0001) –
3 days Activitygram Activitygram score(Q1)–activitygram score(Q2)
ICC = 0.24 (P = 0.005) –
Youth Treuth (2005)[27] 6 days Fels PAQ Girls: Fels PAQ score(Q1)–Fels PAQ score(Q2)
ICC = 0.67 –
Boys: Fels PAQ score(Q1)–Fels PAQ score(Q2)
ICC = 0.65 –
Youth Welk (2007)[28] 7 days YMCLS Total activity(Q1)–total activity(Q2) ICC (95 % CI) = 0.60 (0.47;0.70) –
Youth Wong (2006)[29] 7 days SHAPES Combined activity(Q1)–combined activity(Q2)
– κ(±SD) = 0.58 ± 0.17
Sedentary activity(Q1)–sedentary
activity(Q2) – κ
(±SD) = 0.55 ± 0.01
Adults Ainsworth (2000)[30] 1 month KPAS 3-point summary index(Q1)–3-point summary index(Q2)
ICC = 0.82 (P < 0.0001) –
4-point summary index(Q1)–4-point summary index(Q2)
ICC = 0.83 (P < 0.0001) –
Adults Besson (2010)[31] ± 2 weeks RPAQ PAEE(Q1)–PAEE(Q2) ICC = 0.76 (P < 0.001) –
Sedentary time(Q1)–sedentary time(Q2) ICC = 0.76 (P < 0.001) –
Adults Chasan-Taber (2004)[32] 7 days PPAQ Total activity(Q1)–total activity(Q2) ICC = 0.78 –
Sedentary(Q1)–sedentary(Q2) ICC = 0.79 –
Adults Chinapaw (2009)[33] 2 weeks AQuAA Adolescents: AQuAA score(Q1)–AQuAA score(Q2)
ICC (95 % CI) = 0.44 (0.16;0.65) –
Adults: AQuAA score(Q1)–AQuAA score(Q2)
ICC (95 % CI) = 0.22 (−0.04;0.46) –
Adolescents: sedentary(Q1)– sedentary(Q2)
ICC (95 % CI) = 0.57 (0.34;0.73) –
Adults: sedentary(Q1)–sedentary(Q2) ICC (95 % CI) = 0.60 (0.40;0.74) –
Adults Craig (2003)[34] 3 - 7 days IPAQ Long form: total PA(Q1)–total PA(Q2) Pooled Spearman r (95 % CI) = 0.81 (0.79;0.82), range: 0.46 - 0.96 –
Short form: total PA(Q1)–total PA(Q2) Pooled Spearman r (95 % CI) = 0.76 (0.73;0.77), range: 0.32 - 0.88
–
Helmerho
rst
et
al.
Internationa
lJournal
of
Behavio
ral
Nutrition
and
Physical
Activity
2012,
9
:103
Page
12
of
55
http://ww
w.ijbnpa.org
/content/9
Table 3 Reliability results of new PAQs
(Continued)
Adults Fjeldsoe (2009)[35] 7 days AWAS Total activity(Q1)–total activity(Q2) ICC (95 % CI) = 0.73 (0.51;0.86) –
HEPA(Q1)–HEPA(Q2) ICC (95 % CI) = 0.80 (0.65;0.89) –
Sitting(Q1)–sitting(Q2) ICC (95 % CI) = 0.42 (0.13;0.64) –
Adults Friedenreich (2006)[36] 9 weeks (average)
PYTPAQ Total MET-hr/week(Q1)–total MET-hr/ week(Q2)
ICC (95 % CI) = 0.66 (0.56;0.74), Spearman r = 0.64 (P < 0.0001)
–
Adults Kurtze (2007)[37] 7 days HUNT2 Hard activity(Q1)–hard activity(Q2) Spearman r = 0.17 (P < 0.01) κ= 0.41 (0.29;0.54)
Occupational activity(Q1)–occupational activity(Q2)
Spearman r = 0.85 (P < 0.01) κ= 0.80 (0.71;0.89)
Light activity(Q1)–light activity(Q2) Spearman r = 0.17 κ= 0.20 (0.04;0.35)
Adults Kurtze (2008)[38] 7 days HUNT1 Frequency(Q1)–frequency(Q2) Spearman r = 0.87 (P < 0.01) κ= 0.80
Intensity(Q1)–intensity(Q2) Spearman r = 0.87 (P < 0.01) κ= 0.82
Duration(Q1)–duration(Q2) Spearman r = 0.76 (P < 0.01) κ= 0.69
Adults Lowther (1999)[39] 2 days SPAQ Total min(Q1)–total min(Q2) Pearson r = 0.998 (P < 0.01), repeatability coefficient R = 53 min.
MD (95 % LoA) = 3.09 ± 26.5 min
Adults Mäder (2006)[40] 14 - 21 days SHS97 Sweat episodes(Q1)–sweat episodes(Q2) Spearman r = 0.63 (P < 0.05) –
HEPA99 Active/inactive(Q1)–active/inactive(Q2) – κ= 0.46 (P < 005)
IPAQ Total MET-min/week(Q1)–total MET-min/ week(Q2)
Spearman r = 0.54 (P < 0.05) –
Sitting(Q1)–sitting(Q2) Spearman r = 0.60 (P < 0.05) –
OIMQ Total MET-min/week(Q1)–total MET-min/ week(Q2)
Spearman r = 0.68 (P < 0.05) –
Adults Meriwether (2006)[41] 7 days PAAT Total min(Q1)–total min(Q2) Spearman r = 0.618 (P < 0.001) –
Adults Reis (2005)[42] 2 weeks OPAQ Total activity(Q1)–total activity(Q2) ICC (95 % CI) = 0.76 (0.59;0.86) –
Sedentary(Q1)–sedentary(Q2) ICC (95 % CI) = 0.78 (0.62;0.87) –
Adults Rosenberg (2010)[43] 2 weeks SBQ Weekday: total score(Q1)–total score(Q2) ICC (95 % CI) = 0.85 (0.75;0.91), Spearman r (95 % CI) = 0.79 (0.65;0.88)
–
Weekend day: total score(Q1)–total score(Q2)
ICC (95 % CI) = 0.77 (0.63;0.86), Spearman r (95 % CI) = 0.74 (0.58;0.85)
–
Adults Sobngwi (2001)[44] 10 - 15 days SSAAQ Total min(Q1)–total min(Q2) Spearman r = 0.95 (P < 0.001) –
Adults Timperio (2003)[45] 3 days 1WPAR Men: duration(Q1)–duration(Q2) ICC (95 % CI) = 0.45 (0.20;0.64),
P < 0.001 –
Women: duration(Q1)–duration(Q2) ICC (95 % CI) = 0.80 (0.69;0.87), P < 0.001
–
Helmerho
rst
et
al.
Internationa
lJournal
of
Behavio
ral
Nutrition
and
Physical
Activity
2012,
9
:103
Page
13
http://ww
w.ijbnpa.org
/content/9
Table 3 Reliability results of new PAQs
(Continued)
Men: sufficient PA(Q1)–sufficient PA(Q2) – κ= 0.64 (P < 0.001)
Women: sufficient PA(Q1)–sufficient PA(Q2)
– κ= 0.55 (P < 0.001)
Adults Wareham (2002)[46] 3 months EPAQ2 Men: total MET-hr/week(Q1)–total MET-hr/week(Q2)
Pearson r = 0.74 (P < 0.05) κ= 0.64
Women: total MET-hr/week(Q1)–total MET-hr/week(Q2)
Pearson r = 0.72 (P < 0.05) κ= 0.70
Men: TV time(Q1)–TV time(Q2) Pearson r = 0.75 (P < 0.05) κ= 0.71
Women: TV time(Q1)–TV time(Q2) Pearson r = 0.78 (P < 0.05) κ= 0.74
Adults Wareham (2003)[47] 18 - 21 months EPAQ Physical activity index(Q1)–physical
activity index(Q2) – κ
= 0.60 (P < 0.0001)
Adults Yore (2007)[48] 1 - 5 days BRFSS PAQ VPA(Q1)–VPA(Q2) – κ(95 % CI) = 0.86 (0.72;0.99)
MPA(Q1)–MPA(Q2) – κ(95 % CI) = 0.53 (0.31;0.75)
Recommended PA(Q1)–recommended PA(Q2)
– κ(95 % CI) = 0.84 (0.69;0.99)
Walking(Q1)–walking(Q2) – κ(95 % CI) = 0.56 (0.34;0.77)
Strengthening PA(Q1)–strengthening
PA(Q2) – κ
(95 % CI) = 0.92 (0.81;1.00)
10 - 19 days BRFSS PAQ VPA(Q1)–VPA(Q3) – κ(95 % CI) = 0.80 (0.65;0.95)
MPA(Q1)–MPA(Q3) – κ(95 % CI) = 0.35 (0.11;0.59)
Recommended PA(Q1)–recommended PA(Q3)
– κ(95 % CI) = 0.67 (0.46;0.88)
Walking(Q1)–walking(Q3) – κ(95 % CI) = 0.34 (0.10;0.57)
Strengthening PA(Q1)–strengthening
PA(Q3) – κ
(95 % CI) = 0.85 (0.71;0.99)
Elderly Yasunaga (2007)[49] 1 month PAQ-EJ PAQ-EJ score(Q1)–PAQ-EJ score(Q2) Pearson r = 0.70 (P < 0.05) –
Median ICC = 0.76 (youth: 0.69, adults: 0.765, elderly:–)
Median Spearman r = 0.74 (youth: 0.71, adults: 0.75, elderly:–)
Median Pearson r = 0.76 (youth: 0.80, adults: 0.74, elderly: 0.70)
Medianκ= 0.64 (youth: 0.53, adults: 0.655, elderly:–)
Q1 =first completed questionnaire, Q2 = second completed questionnaire, Q3 = third completed questionnaire, r = correlation coefficient (rho), ICC = Intraclass Correlation Coefficient, CI = Confidence Interval (lower; upper), %CV = coefficient of variation (within subjects standard deviation of typical error) as a percentage of the mean score,κ= kappa (i.e. Cohen weighted kappa unless specified otherwise), LoA = Limits of Agreement, MD = Mean Difference,–= not stated.
Helmerho
rst
et
al.
Internationa
lJournal
of
Behavio
ral
Nutrition
and
Physical
Activity
2012,
9
:103
Page
14
of
55
http://ww
w.ijbnpa.org
/content/9
NB:No calculation of weighted kappa is specified in the papers. Usually the kappa statistic is used for categorical responses and weighted kappa for ordinal responses. Interpretation of values of kappa and weighted kappa were usually based on the classification system developed by Landis and Koch (1977), where <0.10 indicated poor agreement, 0.10-0.20 slight agreement, 0.21-0.40 fair agreement, 0.41-0.60 moderate agreement, 0.61-0.80 substantial agreement, 0.81-1.00 almost perfect agreement.
Ainsworth (2000): 3 point summary index = 3 domains: sports/exercise, occupation, active living habits. 4 point summary index = all 4 domains: sports/exercise, occupation, active living habits, housework/caregiving. Chinapaw (2009): AQuAA score: all activities above 2 MET in MET-min/week.
Craig (2003): Pooled Spearman = pooled results from data of 22 studies examining the IPAQ long form and 23 studies examining the short form. Dwyer (2011): Levels 1–2 = stationary, level 3 = moving slowly, level 4 = moving at a medium or moderate pace, level 5 = moving at a fast pace.
Economos (2010): Moderate-high METs = 3–6 METs. High METs =≥6 METs. WBF score = weight-bearing factor score, calculated by adding the weight-bearing factor of the reported weight-bearing activities. Fjeldsoe (2009): HEPA = Health Enhancing Physical Activity: brisk walking and moderate- and vigorous activities from the planned activity and transport domains.
Kurtze (2007): Light activity = no sweating or being out of breath. Hard activity = sweating/out of breath.
Lowther (1999): Total min = total minutes measured in the overlapping 4 days of both questionnaires. Repeatability coefficient (twice the standard deviation of the differences) means that 95 % of the differences in SPAQ from one measurement to the next (under similar conditions) would be between zero plus or minus 53 minutes.
Mäder (2006): IPAQ - Total MET-min/week = MET-min/week for total activity excluding sitting. OIMQ - Total MET-min/week = MET-min/week for total activity, i.e. moderate and vigorous activities.
Philippaerts (2006): Total hrs/week = Total hours per week spent in transport and sports participation, excluding sedentary activities. Total EE = Total EE spent in transport and sports participation, excluding sedentary activities.
Reis (2005): Sedentary = sitting or standing activities. Ridley (2001): CDPAQ-HC = hard copy of CDPAQ.
Rosenberg (2010): Total score = all sedentary behaviors in hours per day for each item were summed separately for weekday and weekend days.
Telford (2004): Reliability results for frequency/duration of overall total PA for 5 to 6 or 10 to 12 year old children in parental proxy-reports or self-administered questionnaires.
Timperio (2003): Duration = duration of total physical activity. Sufficient PA was calculated as 150 minutes of combined walking, moderate- and intensity physical activity, with reported duration of vigorous-intensity physical activity weighted by two.
Treuth (2003): GAQ score = MET weighted mean score of 28 activities. Activitygram score = average intensity/min. Other sedentary = sedentary activities excluding TV watching. Treuth (2005): Fels PAQ score = total activity score; MET weighted sum of sport, leisure, work index.
Wareham (2003): Physical activity index is a four-category index of inactive, moderately inactive, moderately active, active. TV time = hours per week watching television and videos. Wong (2006): Combined activity = combined score of the SHAPES derived variables which contains the variables: VPA, MPA, MVPA, screen time, PAL and BMI.
Yasunaga (2007): PAQ-EJ score (MET-hr/week) = number of days*time*intensity weight.
Yore (2007): MPA≥30 min/day on 5 days/week. VPA≥20 min/day on 3 days/week. Recommended PA, i.e.≥subjects who met the criteria for moderate or vigorous PA. Walking≥30 min/day. Strengthening PA = any muscle-strengthening activity on≥2 days/week. Kappa's are reported for the subsamples who met the criteria for the physical activity intensities.
Helmerho
rst
et
al.
Internationa
lJournal
of
Behavio
ral
Nutrition
and
Physical
Activity
2012,
9
:103
Page
15
http://ww
w.ijbnpa.org
/content/9
Table 4 Validity results of new PAQs
Age Group
Reference Criterion method
Duration of validation
PAQ Variables tested Criterion intensity thresholds
Validity results
Correlation coefficients Agreement
Youth Dwyer (2011)[19] Acc (ActiGraph)
4 - 5 days Pre-PAQ Level 5 min/day(Q)–VPA min/ day(Acc)
>5016 counts/min Pearson r = 0.17 MD (95 % LoA) = 1.9 ± 39.4 min/day
Level 4 min/day(Q)–MPA min/ day(Acc)
3560-5016 counts/min Pearson r = 0.13 MD (95 % LoA) = 48.2 ± 73.1 min/day
Level 3 min/day(Q)–LPA min/ day(Acc)
1592-3560 counts/min Pearson r =−0.07 MD (95 % LoA) =
−4.8 ± 100.7 min/day Levels 1–2 min/day(Q)–sedentary
min/day(Acc)
<1592 counts/min Pearson r = 0.19 MD (95 % LoA) =
−235.4 ± 147.7 min/day Youth Economos
(2010)[20]
Acc (ActiGraph)
2 days BONES PAS High METs(Q)–total counts/ min(Acc)
– Spearman r (95 % CI) = 0.25 (−0.07;0.52)
–
High METs(Q)–VPA(Acc) 6-9 METs, 1952–5724 counts/min
Spearman r (95 % CI) =
0.23 (−0.09;0.51) –
Moderate-high METs(Q)–total counts/min(Acc)
– Spearman r (95 % CI) = 0.27 (−0.05;0.54)
–
Youth Martinez-Gomez (2010)[21]
Acc (ActiGraph)
1 day RPAR Total MET-min(Q)–total counts(Acc) – Pearson r = 0.42 (P = 0.021) κ= 0.16
MVPA min(Q)–MVPA counts(Acc) ≥2000 counts/min Pearson r = 0.52 (P < 0.001) MD (95 % LoA) = 2.15 ± 7.19 min
Acc (Biotrainer)
1 day Total MET-min(Q)–total counts(Acc) – Pearson r = 0.40 (P = 0.025) κ= 0.39
Total MET-min(Q)–total counts/ mov(Acc)
– Pearson r = 0.54 (P = 0.004) κ= 0.16
Youth Philippaerts (2006)[22]
Acc (ActiGraph)
7 days FPACQ Total hr/week(Q)–total counts(Acc) – Pearson r = 0.56 (P < 0.01) –
Total hr/week(Q)–mean counts/ min(Acc)
– Pearson r = 0.43 (P < 0.05) –
TEE(Q)–total counts(Acc) – Pearson r = 0.58 (P < 0.01) –
TEE(Q)–mean counts/min(Acc) – Pearson r = 0.49 (P < 0.05) –
Inactivity(Q)–total counts(Acc) – Pearson r =−0.13 –
Inactivity(Q)–mean counts/min(Acc) – Pearson r =−0.06 –
Youth Ridley (2001)[23] Acc (Caltrac) 2x 1 day CDPAQ Total METs(Q)–total counts(Acc) – Pearson r = 0.41 (P < 0.05) –
Total compendium METs(Q)–total
counts(Acc) –
Pearson r = 0.54 (P < 0.05) –
Helmerho
rst
et
al.
Internationa
lJournal
of
Behavio
ral
Nutrition
and
Physical
Activity
2012,
9
:103
Page
16
of
55
http://ww
w.ijbnpa.org
/content/9
Table 4 Validity results of new PAQs
(Continued)
Total mins(Q)–total counts(Acc) – Pearson r = 0.41 (P < 0.05) –
HR (Polar) 2x 1 day MVPA mins(Q)–MVPA mins(HR) ≥145 bpm Pearson r = 0.66 (P = 0.01) –
Acc (Caltrac) 2x 1 day CDPAQ-HC Total METs(Q)–total counts(Acc) – Pearson r = 0.25 (P < 0.05) –
Total compendium METs(Q)–total counts(Acc)
– Pearson r = 0.22 (P < 0.05) –
Total mins(Q)–total counts(Acc) – Pearson r = 0.33 (P < 0.05) –
HR (Polar) 2x 1 day MVPA mins(Q)–MVPA mins(HR) ≥145 bpm Pearson r = 0.48 (P = 0.05) –
Youth Ridley (2006)[24] Acc (ActiGraph)
1 day MARCA PAL(Q)–total counts(Acc) – Spearman r = 0.45 (P < 0.01) –
Youth Telford (2004)[25] Acc (ActiGraph)
8 days CLASS-parental report
5-6 yrs: total min/day(Q)–total min/day(Acc)
– Spearman r =−0.04 MD (95 % LoA) =−140.7 (−164.9;-116.6) min/day
10-12 yrs: total min/day(Q)–total
min/day(Acc) –
Spearman r = 0.09 MD (95 % LoA) = 11.2 (−6.9;29.4) min/day
5-6 yrs: total min/day(Q)–total raw counts/day(Acc)
– Spearman r = 0.05 –
10-12 yrs: total min/day(Q)–total raw
counts/day(Acc) –
Spearman r = 0.11 –
CLASS-self 10-12 yrs: total min/day(Q)–total min/day(Acc)
– Spearman r =−0.04 MD (95 % LoA) = 1.5 (−17.2;20.3) min/day
10-12 yrs: total min/day(Q)–total raw
counts/day(Acc) –
Spearman r = 0.06 –
Youth Treuth (2003)[26] Acc (ActiGraph)
4 days GAQ Yesterday: GAQ score(Q)–mean counts/min(Acc)
– Pearson r = 0.27 (P < 0.05) –
Usual: GAQ score(Q)–mean counts/
min(Acc) –
Pearson r = 0.29 (P < 0.05) –
Yesterday: TV watching(Q)–mean counts/min(Acc)
– Pearson r =−0.145 (P = 0.24) –
Usual: TV watching(Q)–mean
counts/min(Acc) –
Pearson r =−0.004 (P = 0.98) –
Yesterday: other sedentary(Q)– mean counts/min(Acc)
– Pearson r = 0.0227 (P = 0.85) –
Usual: other sedentary(Q)–mean
counts/min(Acc) –
Pearson r =−0.0916 (P = 0.46) –
Activitygram Activitygram score(Q)–mean counts/min(Acc)
– Pearson r = 0.37 (P < 0.002) –
Helmerho
rst
et
al.
Internationa
lJournal
of
Behavio
ral
Nutrition
and
Physical
Activity
2012,
9
:103
Page
17
http://ww
w.ijbnpa.org
/content/9
Table 4 Validity results of new PAQs
(Continued)
Youth Treuth (2005)[27] Acc (Actiwatch)
6 days Fels PAQ Elementary: Fels PAQ score(Q)– mean counts/min(Acc)
– Spearman r = 0.34 (P = 0.004) –
Middle: Fels PAQ score(Q)–mean
counts/min(Acc) –
Spearman r = 0.11 (P = 0.31) –
High: Fels PAQ score(Q)–mean counts/min(Acc)
– Spearman r = 0.21 (P = 0.006) –
Youth Welk (2007)[28] Acc (ActiGraph)
7 days YMCLS Weekly PA bouts(Q)–weekly PA
bouts(Acc) –
r = 0.24 (P < 0.05) MD (95 % LoA) =
−8.4 ± 28.4 min Previous day: total MVPA mins(Q)–
total MVPA mins(Acc)
3-6 METs r = 0.53 (P < 0.05) MD (95 % LoA) = 14.5 ± 173.9 min
Youth Wong (2006)[29] Acc (ActiGraph)
7 - 9 days SHAPES VPA min/day(Q)–VPA min/day(Acc) ≥8200 counts/min Spearman r = 0.25 (P = 0.07) –
MVPA min/day(Q)–MVPA min/ day(Acc)
≥3200 counts/min Spearman r = 0.44 (P < 0.01) –
MPA min/day(Q)–MPA min/ day(Acc)
3200-8199 counts/min
Spearman r = 0.31 (P = 0.02) –
Adults Ainsworth (2000)[30]
Acc (Caltrac)
2x 7 days KPAS 3 point summary index(Q)– MET-min/day(Acc)
– Spearman r = 0.53 (P < 0.01) –
4 point summary index(Q)–
MET-min/day(Acc) –
Spearman r = 0.49 (P < 0.01) –
Adults Besson (2010)[31] DLW 14 days RPAQ TEE(Q)–TEE(DLW) – Spearman r = 0.67 (P < 0.0001) MD (95 % LoA) =
−3451.9 ± 2025.1 kJ/day (P < 0.05)
PAEE(Q)–PAEE(DLW) – Spearman r = 0.39 (P = 0.0004) MD (95 % LoA) =
−12.9 ± 23.9 kJ/day (P < 0.05)
Acc + HR (Actiheart)
11 days VPA(Q)–VPA(Acc + HR) >6 METs Spearman r = 0.70 (P < 0.0001) MD (95 % LoA) = 0.2 ± 0.4 h/day
MPA(Q)–MPA(Acc + HR) 3.6-6 METs – MD (95 % LoA) =
−0.8 ± 1.0 h/day Light PA(Q)–light PA(Acc + HR) 2-3.5 METs – MD (95 % LoA) =
−0.1 ± 2.4 h/day Sedentary time(Q)–sedentary time
(Acc + HR)
<2 METs Spearman r = 0.27 (P = 0.06) MD (95 % LoA) = 0.7 ± 2.8 h/day
Adults Chasan-Taber (2004)[32]
Acc (ActiGraph)
7 days PPAQ Total activity(Q)–Swartz cut point min/day(Acc)
≥3 METs,
≥574 counts/min
Spearman r = 0.32 –
Spearman r = 0.43 –
Helmerho
rst
et
al.
Internationa
lJournal
of
Behavio
ral
Nutrition
and
Physical
Activity
2012,
9
:103
Page
18
of
55
http://ww
w.ijbnpa.org
/content/9
Table 4 Validity results of new PAQs
(Continued)
Total activity(Q)–Hendelman cut point min/day(Acc)
≥3 METs,
≥191 counts/min Total activity(Q)–Freedson cut
point min/day(Acc) ≥ 3 METs,
≥1952 counts/min
Spearman r = 0.08 –
Total activity(Q)–mean counts/ min(Acc)
– Spearman r = 0.27 –
Sedentary(Q)–Swartz cut point min/day(Acc)
<1.5 METs Spearman r =−0.17 –
Sedentary(Q)–Hendelman cut point min/day(Acc)
<1.5 METs Spearman r =−0.34 –
Sedentary(Q)–Freedson cut point min/day(Acc)
<1.5 METs Spearman r = 0.12 –
Sedentary(Q)–mean counts/ min(Acc)
– Spearman r =−0.10 –
Adults Chinapaw (2009)[33]
Acc (ActiGraph)
14 days AQuAA Adolescents: AQuAA score(Q)–
counts/min(Acc) ≥
2 METs,
≥699 counts/min
Spearman r = 0.13 –
Adults: AQuAA score(Q)–counts/ min(Acc)
≥2 METs,
≥699 counts/min
Spearman r =−0.16 –
Adolescents: sedentary(Q)– counts/min(Acc)
< 2 METs, <699 counts/min
Spearman r = 0.23 –
Adults: sedentary(Q)–counts/ min(Acc)
< 2 METs, <699 counts/min
Spearman r = 0.15 –
Adults Craig (2003)[34] Acc (ActiGraph)
7 days IPAQ Long form: total PA(Q)–total
counts(Acc) –
Pooled Spearman r (95 % CI) = 0.33 (0.26;0.39), range: -0.27 - 0.61
–
Short form: total PA(Q)–total
counts(Acc) –
Pooled Spearman r (95 % CI) = 0.30 (0.23;0.36), range: -0.12 - 0.57
–
Adults Fjeldsoe (2009)[35]
Acc (ActiGraph)
7 days AWAS Total activity(Q)–total activity(Acc) ≥100 counts/min Spearman r = 0.13 (P = 0.24) –
HEPA(Q)–Freedson cut point min/ week(Acc)
– Spearman r = 0.28 (P = 0.01) –
HEPA(Q)–Swartz cut point min/
week(Acc) –
Spearman r = 0.06 (P = 0.64) –
Sitting(Q)–sitting(Acc) <100 counts/min Spearman r = 0.32 (P = 0.006) –
Adults Friedenreich (2006)[36]
Acc (ActiGraph)
4x 7 days PYTPAQ Total MET-hr/week(Q)–total MET-hr/ week(Acc)
– Spearman r = 0.26 (P < 0.05), ICC (95 % CI) = 0.18 (0.03;0.32)
–
Helmerho
rst
et
al.
Internationa
lJournal
of
Behavio
ral
Nutrition
and
Physical
Activity
2012,
9
:103
Page
19
http://ww
w.ijbnpa.org
/content/9
Table 4 Validity results of new PAQs
(Continued)
Adults Kurtze (2007)[37] Acc (ActiReg)
7 days HUNT2 Hard activity(Q)–EE(Acc) – Spearman r = 0.11 –
Hard activity(Q)–PAL(Acc) – Spearman r = 0.16 –
Light activity(Q)–EE(Acc) – Spearman r = 0.21 (P < 0.05) –
Light activity(Q)–PAL(Acc) – Spearman r = 0.08 –
Occupational activity(Q)–EE(Acc) – Spearman r = 0.39 (P < 0.01) –
Occupational activity(Q)–PAL(Acc) – Spearman r = 0.38 (P < 0.01) –
Adults Kurtze (2008)[38] Acc (ActiReg)
7 days HUNT1 Summary index(Q)–EE(Acc) – Spearman r = 0.03 –
Summary index(Q)–PAL(Acc) – Spearman r = 0.07 –
Summary index(Q)–MET-min/ day(Acc)
– Spearman r = 0.07 –
Adults Lowther (1999)[39]
Acc (Caltrac)
4 days SPAQ Total mins(Q)–total kcal(Acc) – r = 0.1294, corrected for
confounding: r = 0.52 (P < 0.05) –
Adults Mäder (2006)[40] Acc (ActiGraph)
7 days SHS97 Sweat episodes/week(Q)–total counts/min(Acc)
– Spearman r = 0.23 –
HEPA99 – – – –
IPAQ Total MET-min/week(Q)–total
counts/min(Acc) –
Spearman r = 0.39 (P < 0.05) –
Sitting(Q)–sitting(Acc) <100 counts/min Spearman r = 0.22 –
OIMQ Total MET-min/week(Q)–total counts/min(Acc)
– Spearman r = 0.44 (P < 0.05) –
Adults Meriwether (2006)[41]
Acc (MTI) 14 days PAAT VPA min/week(Q)–VPA min/
week(Acc) ≥
5 METs,
≥5725 counts/min
Spearman r = 0.380 (P < 0.01) –
MVPA min/week(Q)–MVPA min/ week(Acc)
≥5 METs,
≥1952 counts/min
Spearman r = 0.392 (P < 0.01) –
MPA min/week(Q)–MPA min/ week(Acc)
3-4.9 METs, 1952–5724 counts/min
Spearman r = 0.392 (P < 0.01) –
Adults Reis (2005)[42] Acc (ActiGraph)
7 days OPAQ Total hr/week(Q)–VPA(Acc) ≥5725 counts/min Spearman r =−0.02 –
Total hr/week(Q)–MPA(Acc) 1952-5724 counts/min
Spearman r = 0.12 –
Total hr/week(Q)–light activity(Acc) <1952 counts/min Spearman r = 0.22 –
Helmerho
rst
et
al.
Internationa
lJournal
of
Behavio
ral
Nutrition
and
Physical
Activity
2012,
9
:103
Page
20
of
55
http://ww
w.ijbnpa.org
/content/9
Table 4 Validity results of new PAQs
(Continued)
Sedentary(Q)–light activity(Acc) <1952 counts/min Spearman r =−0.20 –
Adults Rosenberg (2010)[43] Acc (ActiGraph)
7 days SBQ Female: total sedentary hr/week(Q)– total sedentary counts(Acc)
<100 counts/min Partial r = 0.10 (P = 0.07) –
Male: total sedentary hr/week(Q)– total sedentary counts(Acc)
<100 counts/min Partial r =−0.01 (P = 0.81) –
Adults Sobngwi (2001)[44] Acc (Caltrac)
1 day SSAAQ Female: total METs(Q)–total METs(Acc)
– r = 0.74 (P < 0.01) –
Male: total METs(Q)–total METs(Acc) – r = 0.60 (P < 0.01) –
HR (Polar) 1 day Urban female: total METs(Q)–total
activity(HR) –
r = 0.63 (P < 0.01) –
Rural female: total METs(Q)–total
activity(HR) –
r = 0.41 (P < 0.05) –
Urban male: total METs(Q)–total
activity(HR) –
r = 0.54 (P < 0.05) –
Rural male: total METs(Q)–total
activity(HR) –
r = 0.59 (P < 0.01) –
Adults Timperio (2003)[45] Acc (ActiGraph)
7 days 1WPAR Men: total min/day(Q)–total min/
day(Acc) ≥
3 METs,
≥1952 counts/min
Spearman r = 0.29 (P < 0.05) –
Women: total min/day(Q)–total
min/day(Acc) ≥
3 METs,
≥1952 counts/min
Spearman r = 0.25 (P < 0.05) –
Adults Wareham (2002)[46] HR (Polar) 4x 4 days EPAQ2 Total MET-hr/week(Q)–EE(HR) – Pearson partial r = 0.28 (P < 0.001) –
TV time(Q)–EE(HR) – Pearson partial r =−0.07 –
Adults Wareham (2003)[47] HR (Polar) 4x 4 days EPAQ-s Physical activity index(Q)–
DayPAR(HR) –
P for trend = 0.003 –
Total hr/week(Q)–DayPAR(HR) – r = 0.04 (P = 0.59) –
Adults Yore (2007)[48] Acc (ActiGraph)
7 days BRFSS PAQ VPA min/week(Q1)–VPA min/
week(Acc) ≥
5999 counts/min Pearson r = 0.52 –
VPA min/week(Q2)–VPA min/
week(Acc) ≥
5999 counts/min Pearson r = 0.54 –
VPA min/week(Q3)–VPA min/
week(Acc) ≥
5999 counts/min Pearson r = 0.63 –
MPA min/week(Q1)–MPA min/ week(Acc)
2020-5998 counts/min Pearson r = 0.27 –
MPA min/week(Q2)–MPA min/ week(Acc)
2020-5998 counts/min Pearson r = 0.20 –
2020-5998 counts/min Pearson r = 0.16 –
Helmerho
rst
et
al.
Internationa
lJournal
of
Behavio
ral
Nutrition
and
Physical
Activity
2012,
9
:103
Page
21
http://ww
w.ijbnpa.org
/content/9
Table 4 Validity results of new PAQs
(Continued)
MPA min/week(Q3)–MPA min/ week(Acc)
Elderly Yasunaga (2007)[49] Acc (Kenz Lifecorder)
1 month PAQ-EJ PAQ-EJ score(Q)–MET-min/day(Acc) – Spearman r = 0.41 (P < 0.05) –
Median Spearman r = 0.25 (youth: 0.22, adults: 0.27, elderly: 0.41)
Median Pearson r = 0.41 (youth: 0.41, adults: 0.28, elderly:–)
Q1 = first completed questionnaire, Q2 = second completed questionnaire, Q3 = third completed questionnaire, r = correlation coefficient (rho), CI = Confidence Interval (lower;upper),κ= kappa (i.e. Cohen weighted kappa unless specified otherwise), LoA = Limits of Agreement, MD = Mean Difference,–= not stated.
Acc = Accelerometry [NB: ActiGraph (Model 7164) is successor of preceding accelerometer by MTI, formerly CSA]. Accelerometer names as used in the respective papers.
Ainsworth (2000): 3 point summary index = 3 domains: sports/exercise, occupation, active living habits. 4 point summary index = all 4 domains: sports/exercise, occupation, active living habits, housework/caregiving. Craig (2003): Pooled Spearman = pooled results from data of 22 studies examining the IPAQ long form and 23 studies examining the short form.
Dwyer (2011): Levels 1–2 = stationary, level 3 = moving slowly, level 4 = moving at a medium or moderate pace, level 5 = moving at a fast pace. Economos (2010): Moderate-high METs = 3–6 METs. High METs =≥6 METs.
Fjeldsoe (2009): Total activity includes light-, moderate-, and vigorous-intensity activities. HEPA = Health Enhancing Physical Activity: brisk walking and moderate- and vigorous activities from the planned activity and transport domains.
Kurtze (2007): EE = Energy Expenditure in MJ/day. PAL = total EE divided by basal metabolic rate (BMR). Light activity = no sweating or being out of breath. Hard activity = sweating/out of breath. Kurtze (2008): EE = Energy Expenditure in MJ/day. PAL = total EE divided by basal metabolic rate (BMR).
Lowther (1999): Initial r = 0.1294, but after correction for less reliable high data (occupational walking data, extreme data for 4 participants) the correlation improved to 0.52.
Mäder (2006): IPAQ - Total MET-min/week = MET-min/week for total activity excluding sitting. OIMQ - Total MET-min/week = MET-min/week for total activity, i.e. moderate and vigorous activities.
Martinez-Gomez (2010): Counts/mov = counts adjusted by movement time over the recess time. MD = mean difference between the mean times spent at MVPA by the two instruments. Kappa = agreement between the two instruments among tertiles of total PA.
Reis (2005): ActiGraph only worn during occupational hours. Sedentary = sitting or standing activities.
Ridley (2001): CDPAQ-HC = hard copy of CDPAQ. MVPA = Moderate-to-Vigorous Physical Activity. Total compendium METs = compendium values to derive total METs due to reported problems associated with children's perception of intensity (Compendium of physical activities: classification of energy costs of human physical activities. Ainsworth BE, Haskell WL, Leon AS, Jacobs DR Jr, Montoye HJ, Sallis JF, Paffenbarger RS Jr. Med Sci Sports Exerc. 1993 Jan;25(1):71–80).
Rosenberg (2010): Partial r = partial correlation, adjusted for age, marital status, white or nonwhite ethnicity, number of children, and highest level of education.
Sobngwi (2001): Total activity by Heart Rate monitoring is defined as variability in heart rate measured as area under the minute-to-minute heart rate curve and above individual resting heart rate. Telford (2004): Validity results for total PA minutes for 5 to 6 or 10 to 12 year old children in parental proxy-reports or self-administered questionnaires.
Timperio (2003): Total activity in min/day is specified as≥3 METs.
Treuth (2003): GAQ score = MET weighted mean score of 18 more reliable, and more frequently performed, activities. Activitygram score = average intensity/min over 3 day period. Other sedentary = sedentary activities excluding TV watching. The scores are an average of the two days administrations.
Treuth (2005): Fels PAQ score = mean Fels PAQ score (total activity) of both administrations of the PAQ. Counts/min = mean counts/min. Elementary = elementary school. Middle = middle school. High = high school. Wareham (2002): Subject wore the HR monitor 4x four days across one year. EE = Energy Expenditure in kJ/hr. TV time = hours per week watching television and videos. Partial correlation coefficient is adjusted for age and sex.
Wareham (2003): Subject wore the HR monitor 4x four days across one year. Physical activity index = combined index for the four-level classification of self-reported occupational activity and four-level categorisation of time spent in cycling and other physical exercise. DayPAR = Physical Activity Ratio calculated as the ratio of daytime energy expenditure to resting energy expenditure. P for trend = P for positive trend of the association between DayPAR (measured by calibrated HR data) over four categories of physical activity (i.e. inactive, moderately inactive, moderately active, active) estimated from the EPAQ.
Welk (2007): PA bouts = number of sessions of physical activity performed during the week. Total MVPA mins = total minutes in moderate to vigorous physical activity performed during the previous day. Cut point used is Freedson age-based cut point, calculated as METs = 2.757 + (0.0015*counts per minute) - (0.0896*age[yr]) - (0.000038*counts per minute*age[yr]). Correlation = group-level correlation. No correlation coefficient specified.
Yasunaga (2007): PAQ-EJ score = MET score in MET-hr/week, calculated as number of days*time*intensity weight.
Helmerho
rst
et
al.
Internationa
lJournal
of
Behavio
ral
Nutrition
and
Physical
Activity
2012,
9
:103
Page
22
of
55
http://ww
w.ijbnpa.org
/content/9
Table 5 Descriptive characteristics of existing PAQs
Age Group
Reference Name
questionnaire
Country Domains of activity Population Primary outcome
Size Age (years) Sex Ethnicity
Youth Affuso (2011)[59] SAPAC (modified) United States Sedentary 201 11 - 15 M/F Mixed Total min/day
Youth Allor (2001)[60] PDPAR United States Moderate, hard, very hard activity
46 12 ± 0.6 F Mixed, urban METs (kcal/hr)
Youth Corder (2009)[61] YPAQ, CPAQ, CHASE, SWAPAQ
United Kingdom All domains, including school and leisure time
62 reliability, 76 validity
4 - 17 M/F Mainly white PAEE, lifestyle scores, MET-min/week
Youth Eisenmann (2002)[62]
GLTEQ United States Mild, moderate and strenuous activity in leisure time
31 10.6 ± 0.2 M/F Mixed METs
Youth Gwynn (2010)[63] MRPARQ Australia All organised and non-organised physical activities
86 10 - 12 M/F Aboriginal,
Torres Strait Islander, non-Indigenous
MET-min/day
Youth Hagströmer (2008)[56]
IPAQ-A 9 countries Sedentary, leisure, household, occupation, transportation
248 12 - 14,
15 -17
M/F European MET-min/day
Youth Huang (2009)[64] CLASS
(Chinese version)
China 31 physical activities and 14 sedentary activities over weekday