www.ijper.org
A Validated Method Development for Quantification
of Pravastatin Sodium using Diffuse Reflectance
Fourier Transform Spectroscopy
Swati Dubey1, Ravindra Pandey2, Shiv Shankar Shukla3* 1Research Scholar, Columbia Institute of Pharmacy, Raipur, CG, INDIA.
2Department of Pharmacognosy, Columbia Institute of Pharmacy, Raipur, CG, INDIA.
3Department of Pharmaceutical Analysis and Quality Control, Columbia Institute of Pharmacy, Raipur, CG, INDIA.
ABSTRACT
Objective: The plan of the proposed work is development and validation of a new,
simple and cost- effective method using Diffuse Reflectance Fourier Transform Infrared
Spectroscopy as a method of choice for analysis of Pravastatin in the solid dosage forms.
Method: Spectrum using Fourier transform infrared (DRS 8000) was analyzed after
preparing solid state sample through diluting in dry potassium bromide. The method was
validated according to the International conference on Harmonization guidelines including
linearity, accuracy, precision, robustness and selectivity. Results: A linear relationship
was found in the selected wave number 1740 -1705 cm-1denoting the hydroxyl peak in the concentration range of 5-30% w/w admitting a good correlation coefficient of 0.9978. The three marketed tablet dosage form selected for the determination of % recovery of Pravastatin was in the range of 97.38-98.14% w/w. The % relative standard deviation for day 1 precision studies of five samples was found in the acceptable range of 0.68–1.83 similarly for day 3 precision studies the range was 0.727–1.379. All the results found for the validation parameters were excellent in the proposed method.
Conclusion: The present research work depicts that Diffuse Reflectance Infrared Fourier
Transforms has a tremendous potential which can be selected as a method of choice for determination of drug content in Pravastatin.
Key words: Pravastatin Sodium, Validation, Diffuse Reflectance Infrared Fourier Transform Spectroscopy, Fourier Transform Infra Red Spectroscopy, International Conference on Harmonization Guidelines, Method Development.
DOI: 10.5530ijper.51.2s.57 Correspondence:
Dr. Shiv Shankar Shukla,
Professor, Department of Pharmaceutical Analysis and Quality Control, Columbia In-stitute of Pharmacy, Raipur, CG, INDIA.
Phone no: 9826124442 E-mail: shivpharma007@ gmail.com
INTRODUCTION
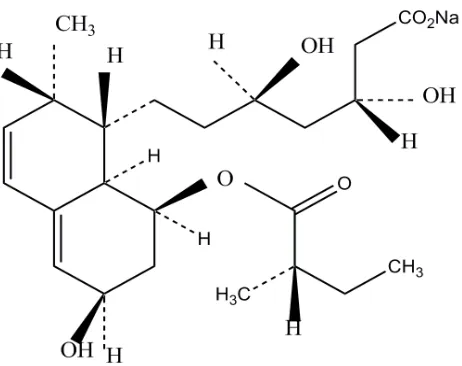
Pravastatin sodium, called chemically as 1-Naphthalene heptanoic
acid,1,2,6,7,8,8a-
hexahydro-β,δ,6-trihydroxy-2-methyl-8-(2-methyl-1-oxobutoxy)-,monosodium salt Figure 1. Pravastatin sodium that has an inhibitory action for 3 – hydroxyl 3 methyl glutaryl coenzyme A which is also known as HMG-CoA Reductase, is an anti-hypercho-lesterolemia agent. It is the rate-determining enzyme during the cholesterol synthesis and for the translation of 3-Hydroxy 3-Methyl Glutaryl – Coenzyme A to mevalonate.1,2 Pravastatin is pigeonholed as one of the most excellent because the hydroxyl group
Submission Date: 04-02-2017;
Revision Date: 18-03-2017;
Accepted Date: 30-03-2017
is attached to the decalin ring that raises the hydrophilicity parameter when compared to 3-Hydroxy 3-Methyl Glutaryl – Coenzyme A reductase inhibitors.
Multiplex advantage also known as Fellgett advantage, Jacquinot advantage. The Fellgett advantage is gained by taking multiple analog or digital signals instead of direct or successive measurement with lead to improvement of signal to noise ratio. Throughput advantage also des-ignated as Jacquinot advantage varies as wave number and depends on resolution as slit width changes. Fou-rier Transform Infrared Spectroscopy also has negligible stray light because each source wavelength is modulated by the interferometer.
It is also been revealed in pieces of literatures that some
pharmaceuticals have been quantified using Ultra-Violet Visible spectroscopy and Fourier Transform Infra Red
spectroscopy moreover by analyzing the transmittance or absorbance of the solid state pharmaceutical in potassium bromide or chloroform.3–8 As found in many compendia Fourier Transform Infrared Spectroscopy is getting more thought of the analytical scientists in the investigation and utilizing Fourier Transform Infrared Spectroscopy technique. Adding hereby that Diffuse
Reflectance Infrared Fourier Transform that was
proposed as a comparatively a profound techniques for quantitatively analyzing solid-state samples.
From the literature brought to the researcher’s interest
that Diffuse Reflectance Infrared Fourier Transform
Spectroscopy techniques have been already used for the quantitative estimation of mixtures of sulfamethoxazole polymorphs,9 simultaneous quantization of ethenzamide, isopropyl antipyrine, caffeine, and allyl isopropyl acetyl urea in tablet dosage forms.10 Hereby, Diffuse Reflec -tance Infrared Fourier Transform Spectroscopy can be seen as the perspective to provide a competent method
for quantification of solid-state pharmaceuticals.
Copious methods have been reported for development and validation for the estimation of Pravastatin in plasma counting high-performance liquid chromatography
with Ultra-Violet detection,11-13 liquid chromatography/ tandem mass spectrophotometry and hyphenated techniques (LC/MS/MS).14-20 A Simple Ultra-Violet
spectroscopic method, also first order derivative spec -troscopic method as well as Area under Curve method in addition to absorption ratio methods are reported for determination of the Pravastatin in different marketed formulations. Several chromatographic methods already exist for the determination of the Pravastatin only or in
combination with other drugs and in biological fluids
like human plasma and urine. Many Chromatographic methods like High performance liquid chromatography and Reverse phase High-Performance Liquid Chroma-tography, High-performance thin layer chromatography (High-Performance Thin Layer Chromatography) with
Ultra-Violet detection have been reported already.
The novelty of the present work is based on above literature survey that revealed that an analytical method
for the Validation and quantification of Pravastatin in
bulk and tablet dosage form (solvent free method) using Fourier Transform Infra Red Spectrophotometry is yet not available. Considering these facts and Figures the goal of the present work was to develop and validate a
sensitive, specific and reproducible Fourier Transform Infra Red method for quantification of Pravastatin in
solid-state and to assess the practicability of Diffuse
Reflectance Infrared Fourier Transform Spectroscopy
application for pharmaceuticals. The proposed Diffuse
Reflectance Infrared Fourier Transform Spectroscopy
method in the present study was performed on standard Pravastatin and three marketed tablet dosage forms, namely, (Pravachol, Lipostat, Pravalip; Label Claim 40mg Pravastatin).The objective of validation of an analytical procedure is to demonstrate that it is suitable for its intended purpose. Typical validation characteristics considered in the presented compendia are: 21,22
Linearity and Range The linearity is ability of the assay to return the values that are directly proportional to the concentration of the target analyte in the sample. The range of an analytical procedure is the interval between the upper and lower concentration (amounts) of analyte in the sample (including these concentrations) for which it has been demonstrated that the analytical procedure has a suitable level of precision, accuracy and linearity.
Precision Precision is variability of data from the rep-licate determination of the same homogeneous sample under the normal assay conditions.
Accuracy Accuracy is the acceptance between the
values found and accepted true value.
MATERIALS AND METHODS
Chemicals and Reagents. A standard sample of Pravastatin sodium, (B. No. AR No. 0301036909) obtained as a gift sample from Zydus Cadila and Potassium bromide
UVSOL (AR) from the Merck, Germany.
Fourier Transform Infra Red Instrumentation. Shimadzu IR
Affinity – 1 spectrophotometer having diffuse reflec -tance sampling interface DRS 8000 (wave number range
between 4000 and 650 cm−1has been used for record -ing Fourier Transform Infra-Red spectra, an average 45
scans for each sample with a small resolution of 4 cm−1
and Potassium bromide as background spectrum. The software used for collection, analyzis and interpretation of data was IR Solutions
calibra-tion curve. By using a suitable quantity of potassium bromide, Pravastatin sodium was diluted to get around 1000 mg and triturated to certify proper homogeneity in the sample. Apiece calibration standard was analzsed
for six replicates. The Area under curve (AUC) analogous to the hydroxy peak in the region of 1740–1705 cm−1 used in the quantification and an average six measure -ments was used to obtain a calibration curve. For all the statistical calculations and calibration curve plotting IRSolutions software for Windows 7 were used.
Method Validation. The following parameters were
validated for the developed Diffuse Reflectance Infrared
Fourier Transform Spectroscopy method.
Precision. Precision study was carried out by analyzing six
samples of five different concentrations (5-30% w/w)
of Pravastatin sodium six times on the same day (Day 1). Likewise, the intermediate precision of the method was examined by repeating studies on day 3 (Intraday Precision).
Accuracy. The accuracy of the method was performed by standard addition method by recovering the pure drug from the excipient at three different concentrations (80, 100, and 120%w/w). A known amount of Pravastatin sodium standard powder was added to preanalyzed powdered drug Pravacol equivalent to 80, 100, and 120% of label claim. A through mixing was ensured for making an appropriate dilution of 1%w/w with Potas-sium bromide in a set of six.
Linearity. Linear regression method was used for assessing the linearity in the assay method by analyzing the six
samples of five different concentrations (ppm) (5-30%
w/w) of Pravastatin in a set of six.
Analysing Marketed Tablet Formulations. For the drug content determination three diverse brands of Pravastatin sodium namely Pravachol, Lipostat, Pravalip; Label Claim 40 mg Pravastatin were selected. Accurately weighed ten tablets was used for determining their
average weight and finely powdered. 1% w/w of Pravastatin
sodium was achieved by appropriately diluting each of the tablet powder with potassium bromide .Triturating was done to ensure a thorough mixing. The analysis was made using six samples in a set of six.
RESULT AND DISCUSSION
Diffuse reflectance infrared spectroscopy has tremen -dous potentials in sampling powdered or crystalline materials in the mid-IR and near-IR spectral ranges results in a relatively long path lengths which increase the interaction of infrared light with the sample. Diffuse
Reflectance Infrared Fourier Transform Spectroscopy
also has an advantage that it can be used in the analysis
of intractable solid samples. Concentrated samples can cause higher noise for which the samples are diluted with nonabsorbing material such as potassium bromide
before sampling. Diffuse reflectance has an excellent benefit that it is free from the time-consuming process
of pressing pellets for transmission measurement. The range of 3244.27, 3064.89, 2964.59, 2873.94, 1726.29, 1705.07, 1560.41, 1398.39, 1328.95, 1186.22,
1157.29 and 1039.63 cm−1 showed the Fourier Transform
Infra Red spectrum for pure of Pravastatin. Potassium bromide was used as diluents as the low-intensity bands were slight affected. The transmittance band analogous to hydroxyl group was found in the range of 1740–1705
cm−1 for diluted sample of Pravastatin in Potassium
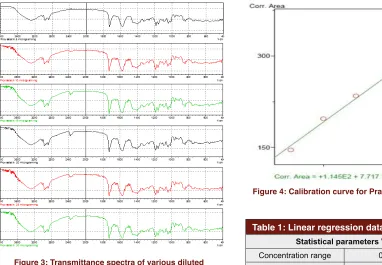
bromide within 2.0 transmittanceunit. The transmittance spectra of Pravastatin are shown in Figure 2 (overlay) and Figure 3. The calibration curve was prepared by
using the area under curve (AUC) centred in the range of 1740-1705 cm−1as shown in Figure 4. Initially, the
samples in the concentration range of 5-50% w/w were analyzed to determine the linearity. The calibration curve showed a good linearity range in 5-30%w/w Pravastatin in potassium bromide. The consequent linear regression equation was y = 38.58x + 114.5 and the R2 value for calibration curve was 0.9978 Figure 4 and Table 1. The
precision was articulated by a coefficient of variation
Figure 1: Chemical Structure of Pravastatin Sodium.
Figure 4: Calibration curve for Pravastatin (5 -30 % w/w).
Figure 3: Transmittance spectra of various diluted samples of Pravastatin.
Table 1: Linear regression data for Pravastatin
Statistical parameters Values Concentration range 05-30% w/w Regression equation y = 38.58x +114.5
Correlation coefficient 0.9978
Table 2: Intraday and Interday precision and accuracy for analysis data of Pravastatin (n = 6).
Nominal concentration (%
w/w)
Day 1 Day 3
AUC SD RSD (%) AUC SD RSD (%)
5 146.065 2.6809 1.83 149.065 1.7940 1.2175
10 197.206 1.3514 0.68 195.456 1.5256 0.7794
15 234.492 2.0973 0.887 235.482 1.7154 0.7276
20 268.438 2.3588 0.885 269.585 3.0427 1.1388
25 308.467 2.1338 0.696 310.467 2.8010 0.9122
30 342.624 3.8976 1.14 343.525 4.6997 1.3796
Table 3: Recovery data of Pravastatin in tablet (n = 6).
Tablet brand
name Label claim (mg) drug added Amount of (mg)
Total Amount recovered
(mg)
% Recovery SD RSD (%)
Pravachol
40 32 72 73.152 101.6 1.179 1.599
40 40 80 78.586 98.23 0.858 1.098
40 48 88 87.547 99.48 0.903 1.025
(%relative standard deviation). The % relative standard
deviation for day 1 precision studies of five samples was
found in the acceptable range of 0.68–1.83 similarly for day 3 precision studies the range was 0.727–1.379 Table 2. The proposed validated method was applied for the
quantification of Pravastatin in tablet dosage form.
The Fourier transform infra-red spectra for the repre-sentative samples of tablet dosage forms diluted with potassium bromide which indicates that there is no
Table 4: Assay results of tablets (n = 6).
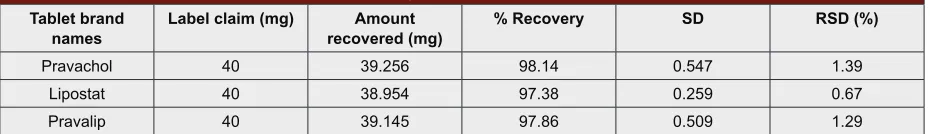
Tablet brand
names Label claim (mg) recovered (mg)Amount % Recovery SD RSD (%)
Pravachol 40 39.256 98.14 0.547 1.39
Lipostat 40 38.954 97.38 0.259 0.67
Pravalip 40 39.145 97.86 0.509 1.29
The accuracy of the Fourier Transform Infra Red method was calculated by %relative standard deviation method and it was observed within the acceptable limits
(as stated in USP not less than 90.0%and not more than
110%of stated amount of Pravastatin)
CONCLUSION
The proposed Diffuse Reflectance Infrared Fourier Transform Spectroscopy method for the quantification
of solid state pharmaceutical Pravastatin and its applica-tion in pharmaceutical sciences is accurate, precise and eco-friendly. Conventionally, Fourier Transform Infra-red Spectroscopy was used in the qualitative analysis of pharmaceuticals; but with advent of the sampling
tech-niques, Diffuse Reflectance Infrared Fourier Transform
spectroscopy may serve as a valuable technique for qualitative and quantitative analysis of pharmaceuticals in solid-state. In the present paper, we account that the % relative standard deviation for all the validation parameters was establish to be less than two, that revealed the validation of the new method and its assay results obtained by the current method are fairly agreeable with a pro that it is cost effective, solvent-free which needs simple sample preparations. When compared to other presented method the proposed method is simple, inexpensive and not using any polluting agents. Therefore
it can be concluded that the developed Diffuse Reflec -tance Infrared Spectroscopic method can be employed successfully for the routine quality control analysis of
Pravastatin as an alternate for Ultra Violet, High-Perfor -mance Liquid Chromatography and High-Perfor-mance Thin Layer Chromatography methods.
Funding There was no funding for this research work
and the work was carried out at the department of Columbia Institute of Pharmacy, Raipur.
ACKNOWLEDGEMENT
Authors acknowledge the Management and Depart-ment of Columbia Institute of Pharmacy for providing necessary facilities.
CONFLICT OF INTEREST
Authors declare that there is no conflict of interest.
ETHICAL APPROVAL
This article does not contain any study with human par-ticipants or animals performed by any of the authors.
ABBREVIATION USED
FTIR: Fourier Transform Infra red Spectroscopy;
xDRIFTS: Diffuse Reflectance Infra red Fourier Trans
-form Spectroscopy; ICH: International Conference for Harmonization.
REFERENCES
1. Melani L, Mills R, Hassman D. Efficacy and safety of ezetimibe coadministered with pravastatin in patients with primary hypercholesterolemia: a prospective, randomized, Double-blind trial. Eur Heart J. 2003;24(8):717-28. https://doi. org/10.1016/S0195-668X(02)00803-5.
2. McTavish D, Sorkin EM. Pravastatin: a review of its pharmacological properties and therapeutic potential in hypercholesterolaemia Drugs. 1991;42:65-89. https://doi.org/10.2165/00003495-199142010-00005 ; PMid:1718686.
3. Bansal R, Guleria A, Acharya PC. FT-IR method development and validation for quantitative estimation of zid Ultra Violetudine in bulk and tablet dosage form,” Drug Research. 2013;63(04):165-70. doi: 10.1055/s-0032-1333297 ; https://doi.org/10.1055/s-0032-1333297
4. Dubey S, Shukla SS, A validated method development for estimation of Simvastatin by first order derivative spectroscopy. Indian Drugs. 2014;51(11):24-7.
5. Vyas A, Shukla SS, Patel R, Pandey R, Jain V, Singh D, et al. Development and Validation of Spectrophotometric Method for Estimation of Cephalexin in Bulk and Tablet Dosage Forms. Oriental Journal of Chemistry. 2011;27(01):359-62.
6. Konoz E, Sarrafi AHM, Samadizadeh M, Boreiri S. Quantitative analysis of lorazepam in pharmaceutical formulation through Fourier Transform Infrared Spectroscopy, E-Journal of Chemistry. 2012;9(4):2232-8. https://doi. org/10.1155/2012/914974.
7. Patraa KC, Kumarb KJ, Sahooa SK, Suresha P. Rapid Fourier Transform Infrared method for estimation of sucrose in a traditional Indian polyherbal formulation. Eurasian Journal of Analytical Chemistry. 2010;5:73-80. 8. Matkovic SR, Valle GM, Briand LE. Quantitative analysis of ibuprofen
in pharmaceutical formulations through Fourier Transform Infrared spectroscopy, Latin American Applied Research. 2005;35(3):189-95. 9. Hartauer KJ, Miller ES, Guillory JK. Diffuse reflectance infrared Fourier
10. Park Y, Yoon H, Kim K, Cho J. Quantitative analysis by diffuse reflectance infrared Fourier transform and linear stepwise multiple regression analysis I - Simultaneous quantitation of ethenzamide, isopropylantipyrine, caffeine, and allyl isopropyl acetyl urea in tablet by Diffuse Reflectance Infrared Fourier Transform and linear stepwise multiple regression analysis. Archives of Pharmacal Research. 1988;11(2):99-113. https://doi.org/10.1007/ BF02857712.
11. Otter K, Mignat C. Determination of pravastatin in human plasma by high performance liquid chromatography with ultraviolet detection. J Chromatogr B: Biomed Sci Appl. 1998;708(1):235-41. https://doi.org/10.1016/S0378-4347(97)00625-7.
12. Bauer S, Mwinyia J, Stoecklea A, Gerloffa T, Roots I. Quantification of pravastatin in human plasma and urine after solid phase extraction using high performance liquid chromatography with ultraviolet detection. J Chromatogr B Analyt Technol Biomed Life Sci. 2005;818(2):257-62. https:// doi.org/10.1016/j.jchromb.2005.01.006 ; PMid:15734167.
13. Önal A, Sagirli O. Development of a Selective LC Method for the Determination of Pravastatin Sodium. Chromatogrhaphia. 2006;64(3):1-6. Doi:10.1365/ s10337-006-0843-5 https://doi.org/10.1365/s10337-006-0843-5.
14. Sparidans RW, Iusuf D, Schinkel AH, Schellens JH, Beijnen JH. Liquid chromatography-tandem mass spectrometric assay for pravastatin and two isomeric metabolites in mouse plasma and tissue homogenates. J Chromatogr B Analyt Technol Biomed Life sci. 2010;878(28):2751-9. DOI: 10.1016/j. jchromb.2010.08.015 ; https://doi.org/10.1016/j.jchromb.2010.08.015. 15. Tan ZR, Ouyang DS, Zhou G, Guo D, Chen Y, et al. A simple and sensitive
LC-MS/MS method for determination of pravastatin in human plasma. Chinese J New Drugs. 2008;17:1150-3.
16. Deng JW, Kim KB, Song IS, Shon JH, Zhou HH, et al. Determination of two HMG-CoA reductase inhibitors, pravastatin and pitavastatin, in plasma
samples using liquid chromatography-tandem mass spectrometry for pharmaceutical study. Biomed Chromatogr. 2008;22(2):131-5. https://doi. org/10.1002/bmc.905 ; PMid:17703482.
17. Jain DS, Subbaiah G, Sanyal M, Jain VK, Shrivastav P. A rapid and specific approach for direct measurement of pravastatin concentration in plasma by LC-MS/MS employing solid-phase extraction. Biomed Chromatogr. 2007;21(1):67-78. https://doi.org/10.1002/bmc.720 ; PMid:17080507. 18. Kyrklund C, Backman JT, Ne Ultra Violetonen M, Ne Ultra Violetonen PJ.
Effect of rifampicin on pravastatin pharmacokinetics in healthy subjects. Br J Clin Pharmacology. 2004;57(2):181-7. https://doi.org/10.1046/j.1365-2125.2003.01972.x PMCid:PMC1884432.
19. Kawabata K, Samata N, Urasaki Y. Quantitative determination of pravastatin and R-416, its main metabolite in human plasma, by liquid chromatography-tandem mass spectrometry. J Chromatogr B Analyt Technol Biomed Life Sci. 2005;816(1):73-9. https://doi.org/10.1016/j.jchromb.2004.11.014; PMid:15664336. 20. Mertensa B, Cahaya B, Klinkenberga R, Streel B. An automated method for the simultaneous determination of pravastatin, 3-hydroxy isomeric metabolite, pravalactone and fenofibric acid in human plasma by sensitive liquid chromatography combined with diode array and tandem mass spectrometry detection. J Chromatogr A. 2008;1189(1):493-502. DOI: 10.1016/j. chroma.2008.01.060. https://doi.org/10.1016/j.chroma.2008.01.060. 21. ICH Quality Guidelines Q2A, Text on Validation of Analytical Procedures,
Q2B, Validation of Analytical Procedures: Methodology, Geneva, Switzerland, 1996.
22. Guidelines for the Development and Validation of Near Infrared (NIR) Spectroscopic Methods, Pharmaceutical Science Group, NIR sub group, UK, 2001, http://www.pasg.org.uk/ NIR/NIR Guidelines Oct 01.pdf.`
Cite this article: Dubey S. A Validated Method Development for Quantification of Pravastatin Sodium using Diffuse Reflectance Fourier Transform Spectroscopy. Indian J of Pharmaceutical Education and Research. 2017;51(2S):115-21.
Mrs. Swati Dubey: Research Scholar at Columbia Institute of Pharmacy Raipur C.G. Authors areas of interest includes analytical method development and Impurity profiling.
Dr. Ravindra Pandey: Presently working as Professor, Department of Pharmacognosy at Columbia Institute of Pharmacy Raipur C.G. Authors areas of interest is research activities in conventional medicine system, standardization and chemical fingerprinting method development of Ayurvedic and Herbal FormulationDr. Shiv Shankar Shukla presently working as Professor, Department of Quality Assurance at Columbia Institute of Pharmacy Raipur C.G. Authors areas of interest includes standardization of herbal medicine, chemical fingerprinting method development and also working on analytical identification and isolation of molecules from herbal origin.
About Authors
SUMMARY
• The present paper accounts a Diffuse Reflectance Infrared Fourier Transform Spectroscopy method for the quantification of solid state pharmaceutical Pravastatin and its application in pharmaceutical sciences is accurate, precise and eco-friendly where that the % relative standard deviation for all the validation param -eters was establish to be less than two, that revealed the validation of the new method and its assay results obtained by the current method are fairly agreeable with a pro that it is cost effective, solvent-free which needs simple sample preparations. When compared to other presented method the proposed method is
sim-ple, inexpensive and not using any polluting agents. Spectrum using Fourier transform infrared (DRS 8000) was analyzed after preparing solid state sample through diluting in dry potassium bromide. The method was validated according to the International conference on Harmonization guidelines including linearity, accuracy, precision, robustness and selectivity. A linear relationship was found in the selected wave number 1740 -1705 cm−1denoting the hydroxyl peak in the concentration range of 5-30% w/w admitting a good cor
-relation coefficient of 0.9978. The three marketed tablet dosage form selected for the determination of % recovery of Pravastatin was in the range of 97.38-98.14% w/w. The % relative standard deviation for day 1 precision studies of five samples was found in the acceptable range of 0.68–1.83 similarly for day 3 preci
-sion studies the range was 0.727–1.379. All the results found for the validation parameters were excellent in the proposed method. The present research work assures that Diffuse Reflectance Infrared Fourier Trans -forms budding technology which can be selected as a method of choice for determination of drug content in Pravastatin.
Shiv Shankar Shukla: Presently working as Professor, Department of Quality Assurance at Columbia Institute of Pharmacy Raipur C.G. Authors areas of interest includes standardization of herbal medicine, chemical fingerprinting method development and also working on analytical identification