World Maritime University World Maritime University
The Maritime Commons: Digital Repository of the World Maritime
The Maritime Commons: Digital Repository of the World Maritime
University
University
World Maritime University Dissertations Dissertations
2000
The next generation of container ships "Malacca-max" and
The next generation of container ships "Malacca-max" and
alternative patterns of operation
alternative patterns of operation
Dawoud Elassy
WMU
Follow this and additional works at: https://commons.wmu.se/all_dissertations
Recommended Citation Recommended Citation
Elassy, Dawoud, "The next generation of container ships "Malacca-max" and alternative patterns of operation" (2000). World Maritime University Dissertations. 1106.
https://commons.wmu.se/all_dissertations/1106
non-WORLD MARITIME UNIVERSITY
Malmö, SwedenTHE NEXT GENERATION OF CONTAINER
SHIPS “MALACCA-MAX” AND
ALTERNATIVE PATTERNS OF OPERATION
By
DAWOUD ELASSY Egypt
A dissertation submitted to the World Maritime University in partial fulfilment of the requirements for the award of the degree of
MASTER OF SCIENCE in
SHIPPING MANAGEMENT
2000
DECLARATION
I certify that all material in this dissertation that is not my own work has been identified, and that no material is included for which a degree has previously been conferred on me.
The contents of this dissertation reflect my own personal views, and are not necessarily endorsed by the University.
………
………August 2000
Supervised by: Name: Tor Wergland Office: Associate Professor World Maritime University
Assessor:
Name: David J Mottram Office: Adjunct Professor,
Former Professor Shipping Management World Maritime University
Co-assessor:
Name: Charles R. Cushing
ACKNOWLEDGEMENT
I am grateful to the LORD for enabling me to complete this work.
I owe gratitude to the Arab Academy for Science and Technology and Maritime Transport for nominating me for this prestigious postgraduate programme.
I would also like to give my appreciation to Admiral Sidney Wallace for sponsoring my studies.
I express my sincere gratitude to all professors, visiting professors, lectures, librarians and the staff of the World Maritime University.
I am heavily indebted to my supervisor Professor Tor Wergland for his guidance and thoroughness in guiding and reviewing the initial draft, which made the fulfilment of this task possible.
Last but not least, a special “thank you” to my beloved wife, for her encouragement and confidence. I am also grateful to my dear son who inspired me to fulfil my mission successfully, and to my great mother to whom I owe everything.
ABSTRACT
Title of Dissertation: The Next Generation of Container Ships
Malacca-Max and Alternative Patterns of Operation
Degree: MSc
The transport industry has forever pivoted around the well-known concept of economies of scale given the size of the capital involved and the necessity to minimise, as much as possible, the unit cost. The dissertation is a study of the effect of the growing size of container ships, namely the Malacca-max, by comparing the results of operation as mentioned in previous studies with those obtained in this study when applying a different operational pattern.
The approach started with a glance at the growth of the container trade through the evolution of world trade, then the potential of container trade, present routes and related operational patterns. The economies of scale are examined by looking at the capacity of present container ships and how the largest ship has almost doubled in size compared to the first post Panamax ship from twelve years ago. In addition, how container operator companies have joined to achieve bigger and bigger volumes is considered and the future development in containerisation is presented. The challenges that exist are discussed, in particular the deep draft of such a large ship. Alternative solutions to the dredging of the Suez Canal are introduced in the light of the use of the new ports under construction in Egypt. Likewise the use of a suggested land bridge is part of the solution.
TABLE OF CONTENTS
Declaration ii
Acknowledgments iii
Abstract iv
Table of Contents v
List of Tables vii
List of Figures viii
List of Abbreviations ix
1. Introduction 1
2. Growth in container trade 3
2.1 Evolution in world trade 3
2.2 Container trade potential 4
2.3 Container trading routes 9
2.3.1 Trans-Pacific route 9
2.3.2 East Asia / Europe route 9
2.3.3 Trans-Atlantic route 9
2.3.4 The North-South route 9
2.3.5 The intra-regional route 9
2.4 Container operational patterns 11
2.4.1 End-to-end 11
2.4.2 Pendulum 11
2.4.3 Round-the-world 12
3. Economies of scale 15
3.1 Economies of scale in the container trade 15
3.2 Development in ship size 17
3.3 Limitations on economies of scale 18
3.5 Individual operators 24
3.6 Future developments in containerization 26
4. Challenges 28
4.1 Container ships of the next generation 28
4.2 Ports Capabilities 33
4.3 The Suez Canal 37
4.4 Land bridging 42
5. Suggested solutions 45
5.1 Introduction 45
5.2 Cost analysis of Malacca-max scinarios 46
5.3 Land bridge cost analysis 52
5.4 Sensitivity analysis 55
5.5 Transshipment comparison 56
6. Conclusion and recommendations 60
LIST OF TABLES
Table 2.1 Sea-born trade volumes 4
Table 2.2 Global ports throughput 6
Table 2.3 Container ships cellular fleet 7
Table 2.4 Container ships on order 7
Table 2.5 Structure of container ships fleet 1980-2000 8
Table 2.6 Main container traffic 10
Table 2.7 Evolution of routing preferences on East West trade 14
Table 3.1 Container ships cost comparison 16
Table 3.2 Liner industry consolidation 23
Table 3.3 Evolution of the alliances 24
Table 3.4 Alliances and global players February 2000 25
Table 3.5 Generation of containerization 26
Table 4.1 Comparison of container ships design 29
Table 4.2 Container ships fleet age profile 29
Table 4.3 Characteristics of Suez-max and Malacca-max container ships 30
Table 4.4 Suez Canal beam and draft 31
Table 4.5 Comparison of container ships transport costs 31
Table 4.6 Enlargement of the Suez Canal 38
Table 4.7 Suez Canal dues 39
Table 4.8 Suez Canal dues calculations 40
Table 4.9 Suez Canal traffic 40
Table 5.1 Suggested operational pattern of Malacca-max 47
Table 5.2 Economic evaluation of Malacca-max 49
Table 5.3 Cost comparison of different operational patterns 50
Table 5.4 Cost comparison of large container ships 51
Table 5.5 Cost comparison between sea and land bridge transport 55
Table 5.6 Sensitivity analysis 56
LIST OF FIGURES
Figure 4.1 East Port Said port layout 35
Figure 4.2 North Al-Sokhna port layout 36
Figure 4.3 Suez Canal Layout 41
Figure 5.1 Land bridge illustration 59
LIST OF ABBREVIATIONS
AD Anno Domini, in the year of (our) Lord (used for dates in
the Christian era as opposed to BC)
APL American President Lines
ASK North Al-Sokhna Port
Av. Average
B Beam
BC Before Christ
BOT Build Operate and Transfer
Cap. Capacity
CEO Chief Executive Officer
Cont. Container
Cw Coefficient of fineness
d Day
D. Diameter
D. Weight or DWT Dead-Weight
Displac. Displacement
E East
E. Asia East Asia
e.g. exempli gratia, for example
ECHCO Egyptian Container Handling Company
ECT Europe Combined Terminals
F.O Fuel Oil
FEU Forty foot Equivalent Unit
GDP Gross Domestic Product
GM Meta-centric Height
GT Gross Tonnage
i.e. id est, that is
ISO International Standardization Organization
Km Kilometer
Kn. Knots
Kw Kilo Watt
L. America Latin America
LBP Length Between Perpendiculars
LOA Length Over All
Lwl Length at Water Level
M Million
m. Meters
M. East Middle East
MCR Maximum Continuous Rating.
M.D.O Marine Diesel Oil
Max Maximum
Med. Mediterranean
N. America North America
N. Europe North Europe
NCB Negev Continental Bridge
Nr. Number
NT Net Tonnage
O/DK On Deck
PPT Pasir Panjang Terminal
PSD East Port Said Port
Rdm Rotterdam
RTW Round The World
S. Asia South Asia
SCA Suez Canal Authority
SCNT Suez Canal Net Tonnage
Sng Singapore
SPDC North Al-Sokhna Port Development Company
SSA Stevedoring Services of America
SUMED Suez-Mediterranean pipelines company
t. Or T. Tones
TCE Time Charter Equivalent
TEU Twenty foot Equivalent Unit
TPC Tons Per Centimeter
U/DK Under Deck
US$ or $ United States Dollar
USA United States of America
VLCC Very Large Crude Carrier
W West
Chapter 1
INTRODUCTION
The growth in container ships size so far has been unlimited. Recently a Dutch professor and student team introduced a design of a container ship that carries 18000 boxes (more than twice the capacity of present vessels), the draft of which will be 21 meters when fully laden. The ship is named Malacca-max, after the Malacca strait which is the third natural water barrier for ships (after the Panama and Suez Canals). The ship will not be able to transit the Suez Canal with this draft.
Mega carriers usually operate between the two markets of Europe and the Far East, thus transiting the Suez Canal is essential for them, However, there are some restrictions with regard to the draft and beam of vessels. The limitation of container ships size has not been realised yet, but is foreseen to take place in the near future, therefore the search for alternatives is a necessity.
Finding alternatives will have an impact on the present known operational patterns, whereas container-trading markets will remain the same. The growth in the container trade encourages the upsizing of ships whereby economies of scale play a major role. The costs can be minimised and a bigger market share is achieved, especially for global players and alliances.
This paper presents suggested solutions to enable the ship to transit the Suez Canal. The solutions include introduction of different operational patterns through the use of new ports under construction in Egypt at both ends of the Suez Canal. By using Egypt’s ideal location in the middle of main sea transport stream, no deviation will be required by ships from their main route. An impact on Egypt’s national economy will be expected and also on the industry through the use of larger ships.
One of the suggested solutions is a land bridge in Egypt linking the Mediterranean to the Red Sea, through the use of multimodal transport. A similar solution for VLCCs, which have a draft and beam restriction to pass the Suez Canal was introduced by the SUMED company for pipelines, where crude oil or products are transferred from the Red Sea to the Mediterranean sea by means of pipe lines.
A cost analysis will be presented, and the best solution recommended.
Chapter 2
GROWTH IN CONTAINER TRADE
2.1 Evolution in world trade
World trade has grown more rapidly than world production since World War II. Due to the continuous diminishing of trade barriers in recent years such trade has been accelerating. In addition, the development in technology, communications and transport has continued this acceleration.
Barriers are known to be natural and artificial, the latter is concerned with trade policy matters and the natural barriers are related to the trade transaction process, in particular transport.
The formation of a global integrated market place is the result of the development of transport technology that has led to cost reductions and improved productivity. Ever since this improvement in transport began the world trade kept growing steadily. The impact of new transport techniques and specialised shipping has been significant on world trade. In liner shipping, containerisation was introduced offering transport quality and faster transit times.
World trade has almost consistently outpaced the world GDP on account of the globalisation of trade on the one hand and a significant reduction in the cost of transportation and communication on the other. The carrying capacity of the world merchant fleet has increased with world trade, with more than 95% of world transportation being ship-borne.
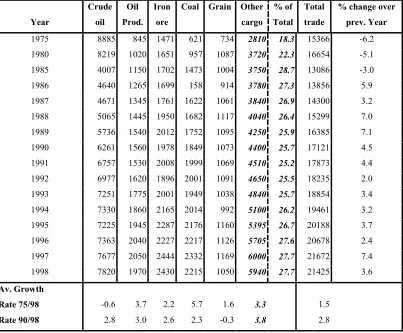
Table 2.1 Seaborne trade volume in tonne-miles
in billion tonne-miles
Crude Oil Iron Coal Grain Other % of Total % change over Year oil Prod. ore cargo Total trade prev. Year 1975 8885 845 1471 621 734 2810 18.3 15366 -6.2 1980 8219 1020 1651 957 1087 3720 22.3 16654 -5.1 1985 4007 1150 1702 1473 1004 3750 28.7 13086 -3.0 1986 4640 1265 1699 158 914 3780 27.3 13856 5.9 1987 4671 1345 1761 1622 1061 3840 26.9 14300 3.2 1988 5065 1445 1950 1682 1117 4040 26.4 15299 7.0 1989 5736 1540 2012 1752 1095 4250 25.9 16385 7.1 1990 6261 1560 1978 1849 1073 4400 25.7 17121 4.5 1991 6757 1530 2008 1999 1069 4510 25.2 17873 4.4 1992 6977 1620 1896 2001 1091 4650 25.5 18235 2.0 1993 7251 1775 2001 1949 1038 4840 25.7 18854 3.4 1994 7330 1860 2165 2014 992 5100 26.2 19461 3.2 1995 7225 1945 2287 2176 1160 5395 26.7 20188 3.7 1996 7363 2040 2227 2217 1126 5705 27.6 20678 2.4 1997 7677 2050 2444 2332 1169 6000 27.7 21672 7.4 1998 7820 1970 2430 2215 1050 5940 27.7 21425 3.6 Av. Growth
Rate 75/98 -0.6 3.7 2.2 5.7 1.6 3.3 1.5
Rate 90/98 2.8 3.0 2.6 2.3 -0.3 3.8 2.8
Source: Fearnleys Review, various issues
2.2 Container trade potential
Unitization, through the standardisation of cargo was the solution to raise productivity. This was done by liner companies investing in mechanised systems and equipment, which automated the transport process.
Containerisation started in the United States in the 1956. Containers were used by trucking and railway companies. The idea of an easily detachable single unit, which can be transferred from one transport mode to another, is known as intermodalism. Malcom McLean as an experienced trucker, had the idea of a cargo handling system that included the sea as a transport mode in addition to road and rail. The first regular service of deep-sea containers was started in the north Atlantic in 1966 by Sea-Land; a company set up by Malcom McLean.
European liner companies later set up their own container services. The development of all related activities such as standardising containers, ship building, trucks and port terminal facilities took place. By 1995 there were 9.6 million TEUs in the international container business.
The container system proved to be extremely effective with regard to cargo handling speed and time in port. In addition, the intermodality improved due to the standardisation of the unit handled.
Twenty years later major liner routes were containerised. Due to unitization liner companies started to compete and they were able to offer door to door service. A complete service from point of origin to point of destination became a part of this sector in the shipping industry. The fierce competition forced the industry to become more concentrated by consolidation and the merging of companies.
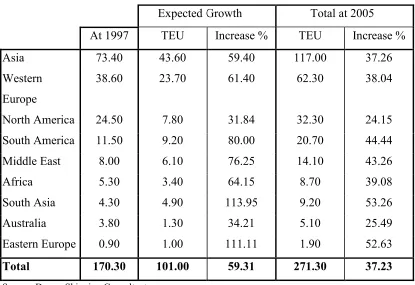
The table below illustrates these figures in detail
Table 2.2 Global Port Throughput In Million TEU
Expected Growth Total at 2005
At 1997 TEU Increase % TEU Increase %
Asia 73.40 43.60 59.40 117.00 37.26
Western Europe
38.60 23.70 61.40 62.30 38.04
North America 24.50 7.80 31.84 32.30 24.15
South America 11.50 9.20 80.00 20.70 44.44
Middle East 8.00 6.10 76.25 14.10 43.26
Africa 5.30 3.40 64.15 8.70 39.08
South Asia 4.30 4.90 113.95 9.20 53.26
Australia 3.80 1.30 34.21 5.10 25.49
Eastern Europe 0.90 1.00 111.11 1.90 52.63
Total 170.30 101.00 59.31 271.30 37.23
Source: Drewy Shipping Consultants
Container transport is the fastest growing market in maritime transport sector this growth is due to the following:
- The continued expansion of containerised shipping by developing countries.
- Increased trade in higher value goods.
- Trends towards globalisation by multinational manufacturers.
- The growth in deep-sea ship size and subsequent increase in feeder traffic and
transhipments.
On 1st January 1999, the total capacity of the container vessel fleet was about 6
million TEUs, of which cellular vessels represented 4.2 million TEUs (70%). by 1st
Table 2.3 Container Vessel Cellular Fleet
Size (Only Cellular) 1/1/1999 1/5/2000 Increase % Description Range Number TEU % of
Total
Number TEU % of Total
Number TEU
Post-Panamax >5000 52 313075 7.4 72 434367 9.5 +38.5 +38.7
Panamax 3000/4999 342 1317194 31.0 359 1390688 30.5 +5 +5.6
Sub-Panamax 2000/2999 401 1001099 23.6 419 1042374 22.9 +4.5 +4.1
Handy 1500/1999 311 525154 12.4 347 589639 13.0 +11.6 +12.3
Handy 1000/1499 494 595418 14.0 491 584474 12.8 -0.6 -1.8
Feeder-Max 750/999 184 160626 3.8 200 174164 3.8 +8.7 +8.4
Feeder-Max 500/749 334 202870 4.8 337 204156 4.5 +0.9 +0.6
Feeder 100/499 412 127768 3.0 606 132579 2.9 +47.1 +3.8
TOTAL 2530 4243204 100.0 2652 4552459 100.0 Source: compiled from Alfaliner & Y.L.G database, http://www.or.jp/shiptrends_99.htm
During the past twelve years, 1,317 container vessels over 1,000 TEUs have been
built. As at 1st January 1999, 394 were able to carry over 3,000 TEUs and 52
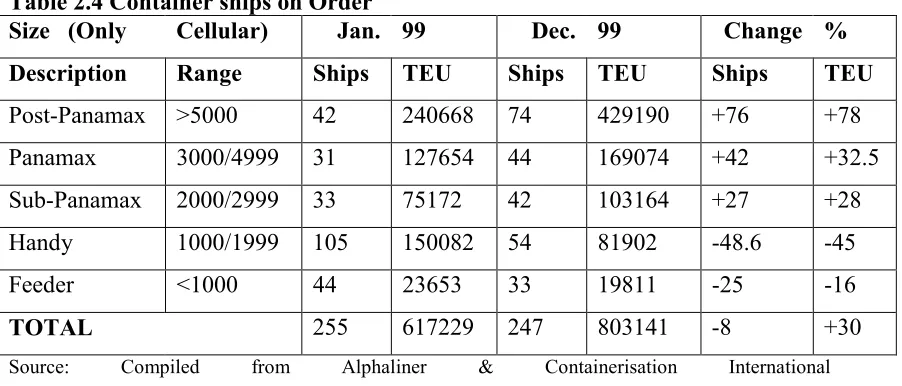
exceeded 5,000 TEUs. There were 255 cellular container vessels on order on 1st
January 1999 providing a total additional capacity of 617229 TEUs but by the end of year, the number of ships ordered had decreased by 8% while the total capacity of the new orders had jumped to 30%, meaning that the direction is towards larger sizes.
Table 2.4 Container ships on Order
Size (Only Cellular) Jan. 99 Dec. 99 Change %
Description Range Ships TEU Ships TEU Ships TEU
Post-Panamax >5000 42 240668 74 429190 +76 +78
Panamax 3000/4999 31 127654 44 169074 +42 +32.5
Sub-Panamax 2000/2999 33 75172 42 103164 +27 +28
Handy 1000/1999 105 150082 54 81902 -48.6 -45
Feeder <1000 44 23653 33 19811 -25 -16
TOTAL 255 617229 247 803141 -8 +30
These figures confirm the growth of the fleet with an amount of 803141 cellular slots under construction.
Cellular container ships are divided into segments each serving a specific part of the market achieving optimum productivity. The first three segments are feeder, feeder-max and handy-size; they are mainly concerned with the short sea and draft restricted trade. The second three segments are Sub-Panamax, Panamax and Post-Panamax all serving the longer haul and deep-sea trade.
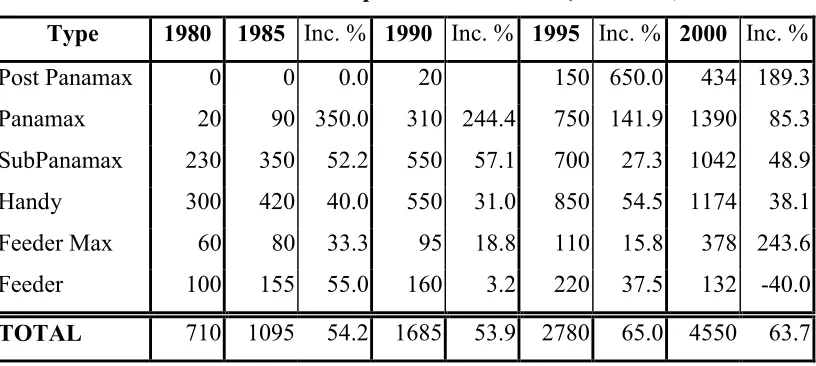
In recent months Post-Panamax tonnage dominated the order book compared with Panamax, as seen from the following table.
Table 2.5 Structure of container Ship Fleet 1980 – 2000 (TEU x 1000)
Type 1980 1985 Inc. % 1990 Inc. % 1995 Inc. % 2000 Inc. %
Post Panamax 0 0 0.0 20 150 650.0 434 189.3
Panamax 20 90 350.0 310 244.4 750 141.9 1390 85.3
SubPanamax 230 350 52.2 550 57.1 700 27.3 1042 48.9
Handy 300 420 40.0 550 31.0 850 54.5 1174 38.1
Feeder Max 60 80 33.3 95 18.8 110 15.8 378 243.6
Feeder 100 155 55.0 160 3.2 220 37.5 132 -40.0
TOTAL 710 1095 54.2 1685 53.9 2780 65.0 4550 63.7
Source: Compiled from Clarkson Research Studies & other
The decision of the owners / operators to increase their fleets with large container ships is driven by:
- the powerful economies of scale of Post-Panamax compared to Panamax vessels,
- the highly competitive pricing regimes of shipyards for large container ships,
- the growth in global operating alliances which has meant that larger cargo
2.3 Container Trading Routes
The three main stream trade routes in container trade are transpacific, transatlantic and East Asia to Europe. In addition, there are the North-South and the intra-regional routes.
2.3.1 Trans-Pacific route
The biggest deep-sea liner route is between North America and the Far East with 7.5 million TEUs of trade representing 22% of the world total. The type of container ships used on this route is Post Panamax because of the long transit time. To run a weekly service this route requires 5-6 ships.
2.3.2 East Asia / Europe route
This route links East Asia from Japan to North Europe as far as Sweden. On this route the trade amounts to 5 million TEUs.
2.3.3 Trans-Atlantic route
This links the East Coast of North America with Europe, the trade amounting to 3 million TEUs on this route.
2.3.4 The North-South route
Trade on this route is between the industrial centres of Europe, North America and the Far East and the developing countries of Latin America, Africa, or developed countries in the Far East and Australia. The ships used on these routes are the handysize of 1,600 TEUs and multi-purpose vessels, in addition to conbulkers.
This is concerned with the distribution of cargo for base port to out-ports. The major trade is intra Asia and intra Europe. Feeders and feedermax are running on these routes.
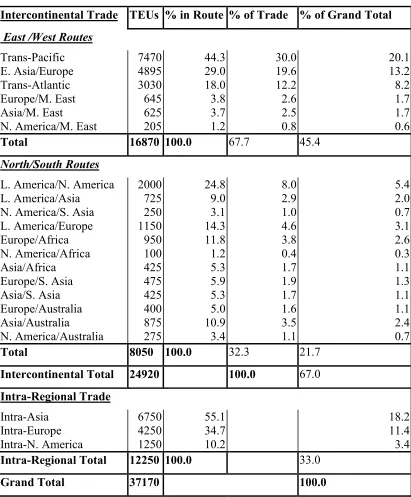
The following table illustrates main container traffic Table 2.6 Main Container Traffic in thousand TEUs
Intercontinental Trade TEUs % in Route % of Trade % of Grand Total
East /West Routes
Trans-Pacific 7470 44.3 30.0 20.1
E. Asia/Europe 4895 29.0 19.6 13.2
Trans-Atlantic 3030 18.0 12.2 8.2
Europe/M. East 645 3.8 2.6 1.7
Asia/M. East 625 3.7 2.5 1.7
N. America/M. East 205 1.2 0.8 0.6
Total 16870 100.0 67.7 45.4
North/South Routes
L. America/N. America 2000 24.8 8.0 5.4
L. America/Asia 725 9.0 2.9 2.0
N. America/S. Asia 250 3.1 1.0 0.7
L. America/Europe 1150 14.3 4.6 3.1
Europe/Africa 950 11.8 3.8 2.6
N. America/Africa 100 1.2 0.4 0.3
Asia/Africa 425 5.3 1.7 1.1
Europe/S. Asia 475 5.9 1.9 1.3
Asia/S. Asia 425 5.3 1.7 1.1
Europe/Australia 400 5.0 1.6 1.1
Asia/Australia 875 10.9 3.5 2.4
N. America/Australia 275 3.4 1.1 0.7
Total 8050 100.0 32.3 21.7
Intercontinental Total 24920 100.0 67.0
Intra-Regional Trade
Intra-Asia 6750 55.1 18.2
Intra-Europe 4250 34.7 11.4
Intra-N. America 1250 10.2 3.4
Intra-Regional Total 12250 100.0 33.0
Grand Total 37170 100.0
2.4 Container operational Patterns
The main reason behind operational patterns is the variance between different trading routes in terms of volumes of cargo, trade balance and traffic stability. The search for cost competitiveness and the deployment of different sized ships have led to new operational patterns
The operation system can be defined as a network of nodes and links. Ports are the nodes and ship routes are the links. A network is a link between 2 nodes. To take advantage of economies of flow accumulation (bus principle), most operational patterns are multi nodes; thus, by accumulating several inter-nodal flows a service can use larger ships with lower slot costs. Operators use the following major operational patterns:
End-to-end: A-B-A itinerary
The pendulum: A-B-C-B-A Itinerary
Round the world: A-B-C-D-E-…-A itinerary one-way or two-way
However, the integration of operations and the co-operation between lines has led to the combining &/different operational patterns into a service pattern.
2.4.1 End-to-end
This pattern exists between two markets. The stability and the balance in traffic in two directions are important. It can be operated on many routes, east-west or north-south, with any size. End-to-end is an easy pattern to manage. It can be made with one ship or more, but the disadvantage of it is the imbalance trade, where ships must carry empty containers. The repositioning of empty boxes increases the costs of the carriers. The other disadvantage is the need to call at a port once on the inbound voyage and again on the outbound voyage.
2.4.2 Pendulum
fulcrum. It is widely used on east-west routes and lager ships are usually deployed in this pattern. The disadvantage is that the size of vessel could be too big for one market at one end. However, the pendulum pattern serves as a partial remedy to reduce the end-port effect by devising a liner service. The opportunity for accumulation of flow in multi-trade leg pendulums is higher than a single service, thus, operators tend to employ larger ships on this pattern.
2.4.3 Round-the-world
An attempt to close the gap and convert the pendulum pattern into a continuous service round the world linking three markets in one direction. This pattern requires about 12 ships for weekly service, and the whole voyage can be made in about 80 days. The circular route in round the world service allows for more uniform and higher utilisation of ship’s space. it also allows unbalanced flows to be coped with by separation of services by direction, thus employing ships of different capacity on east bound and west bound services.
The advantages of the round the world service are found to be as follows:
• The cost advantage is substantial where this service diminishes the adverse cost
effect of trade imbalance or traffic volume disparities by combining flows from three major trades, thereby sustaining reasonably high achieved load factors despite these imbalances.
• Additional opportunities to earn revenue by way porting (double dipping)
wherein a slot is used more than once on a given leg of the voyage.
• The advantage of allowing a stronger sequence of the itinerary to subsidise a
weaker sequence.
• Considerable savings can be secured in the container inventories and logistics
The disadvantages of round the world service are found to be as follows:
• The service requires an extensive feeder network and transhipment service where
costs can be considerable. Sometimes the scale economies of large vessels are not sufficient to offset the costs of large-scale feeding and transhipment operations.
• A serious imbalance of container inventory can develop due to the difference in
cargo volume and marketing success between the traffic generating regions.
However, a new round the world service is suggested, pending on the expansion of the Panama Canal, together with agreed related service patterns. This will involve a massive conversion of end-to-end, pendulum and traditional round the world patterns into a new equatorial round the world service, which will employ even larger ships.
Furthermore there is a number of sub-systems related to the basic operational patterns. These subsystems are found to be as follows:
• Hub-spoke:
Is concerned mainly with transhipment activities. It joins the big ships with small feeders. In order to avoid longer time spent in ports by bigger ships, they can call at a few transhipment hub ports with feeders moving between hubs and other ports to cover a bigger range. The disadvantage of this pattern is the higher cost incurred due to transhipment and containers’ longer transit time.
• Double dipping:
Is a combination between 2 routes intercontinental and intra-regional, where the latter is more profitable than the former one. This is done by calling at hub ports on main lines on both ways of a round trip taking the advantage of relatively higher paid intra-regional market. Meanwhile slots will be utilised more than once and marginal costs drop significantly for larger ships than regional ships.
• Triangle:
to Australia and back to Asia again. This pattern enables the operators to overcome trade imbalance in a certain direction, thus achieving better utilisation.
The balance
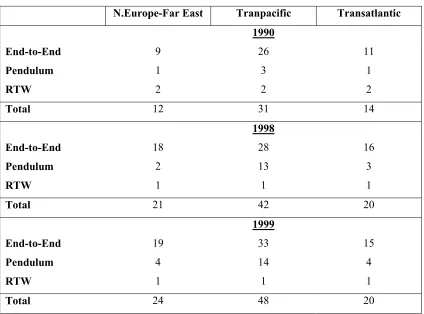
Although in the last ten years the balance preference has changed remarkably with pendulum routing, it now accounts for almost one quarter of all the main weekly east-west services compared to just 9% in 1990. The Following Table illustrates that
Table 2.7 Evolution of routing preferences on East-West trades (number of weekly services)
N.Europe-Far East Tranpacific Transatlantic
1990
End-to-End 9 26 11
Pendulum 1 3 1
RTW 2 2 2
Total 12 31 14
1998
End-to-End 18 28 16
Pendulum 2 13 3
RTW 1 1 1
Total 21 42 20
1999
End-to-End 19 33 15
Pendulum 4 14 4
RTW 1 1 1
Total 24 48 20
Chapter 3
ECONOMIES OF SCALE
3.1 Economies of Scale in the Container Trade
The increase in size of vessels has been greatest in the specialised trades where transport integration has provided the investment in ports and cargo-handling facilities needed to operate large vessels.
A substantial saving in cost could be achieved by using large vessels; the size of these savings depending on the size of vessel and the length of voyage. The aim is to move the cargo as cheaply and efficiently as possible.
Reduction of unit cost is one of the basic principles in the shipping industry. This can be done by increasing the size of the cargo on the shipping leg. Bigger ships have lower unit costs, and unit cargo handling and storage are also cheaper at high throughput volumes. As a result the container trades are under constant economic pressure to increase the size of cargo consignments.
For container shipping there are limits for the differentiation and focus especially in the main line trades. However, cost control is a constant concern and cost leadership is a worthwhile goal, thus it is associated with economies of scale, where capacity addition is now taking place the increase in size of the ships rather than any increase in number.
Based on the theory of scale economies, the size of container ships has increased continuously. For larger vessels the break-even factor will be lower due to lower unit costs that are achieved by them through economies of scale. As the unit costs of transport service decrease with the increase in ship size the earnings per unit of transport service increase (if freight rates are steady). Equally building costs do not increase in direct proportion to cargo capacity increase. Accordingly larger vessels are more economical and competitive, both in operation and in building costs.
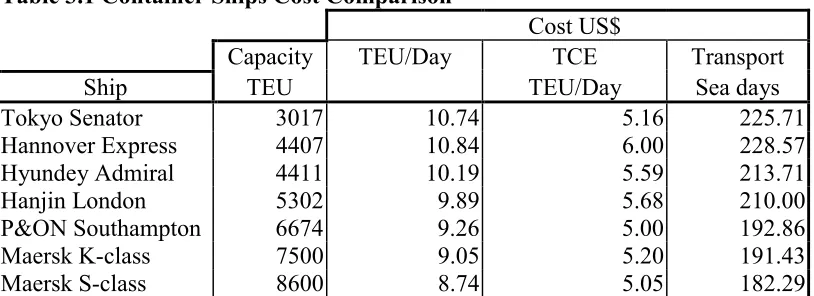
A comparison between different container ships cost shows the relation between ship size and unit cost in the following table.
Table 3.1 Container Ships Cost Comparison
Cost US$
Capacity TEU/Day TCE Transport
Ship TEU TEU/Day Sea days
Tokyo Senator 3017 10.74 5.16 225.71
Hannover Express 4407 10.84 6.00 228.57
Hyundey Admiral 4411 10.19 5.59 213.71
Hanjin London 5302 9.89 5.68 210.00
P&ON Southampton 6674 9.26 5.00 192.86
Maersk K-class 7500 9.05 5.20 191.43
Maersk S-class 8600 8.74 5.05 182.29
Source: Wijnolst N., Malacca Max, Delft University Press, the Netherlands
An evolution in the shipping industry was produced following the free market capitalist’s model. This evolution is reflected in the trade of today’s global economy as follows:
• Economies of scale
• Consolidation of industry
This evolution will continue well into the 21st century in the light of the current
political and socio-economic environment.
Out of these four trends we find that economies of scale is the one that is shaping the future of the shipping industry. The natural struggle for bigger, thus more efficient, economies is driving an internal industrial revolution – one that is already changing the size and shape of things in the commercial shipping industry. Bigger ships are being put into service today. Mega ships are causing port managers to think about the way they do business, and as a result this evolution of mega ports is being introduced to serve these mega ships.
3.2 Development in ship size
The developments of large container ships started years ago in 1980 but only recently have vessels come close to 8000 TEUs. Efforts are being aimed at an improving economy by increasing ship size. The first generation constructed in 1956s was able
to carry 700 TEUs and by the 1970s the 3rd generation was able to carry 3000 TEUs
with Panamax dimensions. In 1984 the Panamax Jumbo Econships were able to carry 4432 TEU. Due to the constant innovation in container ships design, the new Panamax design can carry approximately 4500 TEUs. Such an increase of 50% reveals the efforts made in developing of an efficient container ship.
Demand is affected by the world economy and the growth of global trade has been substantial in the period since World War II. In addition, the price of commodities, the length of haul, political events and transport costs affect demand.
In general, there is an excess of cargo carrying capacity; thus, the fleet capacity is growing faster than world trade. Between 1996 and 2000 the world container fleet was predicted to grow by 10% while growth in world trade is targeted at 6.3% which virtually guarantees excess capacity.
The current size of ships varies quite dramatically. In recent years, the barrier of the Panama Canal, which limits vessel beams to less than 110 feet, was surpassed. While several container shipping companies have chosen to build ships too large for the Panama Canal there has not been a wholesale shift in this direction. These vessels are referred to as post-Panamax and the largest can carry 8700 TEU and are limited to a few ports with sufficient infrastructure.
The Panamax vessel, which was designed to be able just to pass the locks of Panama Canal, was optimised to accommodate more cargo within the same dimensions. The scale of operation of this type of ship has significantly increased due to the growth in trade and the tough competition between liner operators. The only way to survive and compete was to cut costs continuously through the use of larger vessels which can transport containers in a cheaper and more efficient way than smaller ships. In 1980, some operators abandoned the Panamax design and the tendency was toward building even bigger ships than the Panama Canal can accommodate which were to sail only in the Pacific.
Later, other operators followed and large number of post panamax ships were built. Some operators are still operating the panamax due to the flexibility of this size which they believe is more important than the scale advantage of the bigger ships. The Maersk S-class is the largest ship so far with an official capacity of 6600 TEU (able to carry 8700 TEU depending on container weight)
3.3 Limitations on economies of scale
• ship size increase at the expense of service frequency
• longer turn around time is necessary for cargo discharge
• inefficiencies generated by inadequate cargo handling infrastructure (both pier
side and further inland) at the port further erode the benefits derived from increased size
• increased or non-competitive land transport costs
• physical limitation of port geography (inadequate channel size and depth,
insufficient pier space)
• uncertainty over future trade volumes and routes.
These substantial barriers for shipping companies represent a counter force to the realisation of economies of scale. Shipping lines do not exercise complete control over these barriers and there will always be the risks of guessing given the available information as to what an efficient solution might be.
Speed is another barrier to the ever-increasing size of container vessels as with each step up in size, the speed increases due to the correlation between the length of haul and size of vessel. Higher speed brings the cost upward dramatically. With the high proportion of fuel costs in the total cost, the operators target is to find the optimal speed.
The physical constraints of many harbours represent an impassable barrier. Many ports do not have an adequate infrastructure, such as dockside cranes and inland transportation connections, to move the volume of cargo these ships are capable of offloading. The ability of the port to handle cargo quickly and efficiently becomes a constriction point for the large vessel. Excess time spent on the dock begins to undermine economies realised by an increase in size.
3.4 Other ways to achieve economies of scale
The trend towards consolidation in the form of mergers is a recurring theme among major shipping lines. They are able to realise economies of scope and scale by merging as well as reducing certainties.
The consolidation into larger companies with bigger ships will accomplish more frequent services and bigger market share. Several companies in 1990 were formed by pooling their ships. The global alliance was formed by APL, OOCL, MOL & Ned Lloyd. In 1994, the alliance had 187 container ships with 375000 slots. The grand alliance was formed by Hapag-Lloyd, NOL, NYK and P&OCL with 182 ships and 371000 slots. In 1995 a third alliance between Maersk and Sea-Land was formed with a total of 206 ships.
Recently the merger of Maersk with Sea-Land and the American President Lines with Neptune Orient Lines had a substantial impact on the quantity and type of infrastructure that the ports they are calling at must provide. In the past two dedicated terminals would have been needed to serve two operators, where as post merger only one is needed. This reduces both the land and equipment requirement at the pier face but tends to transfer the point of constriction to the inland transport costs.
A consortium is a form of co-operation, mainly between container carriers to rationalise operations technically and commercially.
The development of liner consortia was in two stages. The first stage started in 1970 and featured vessel/space sharing and slot chartering, co-ordination of sailing schedules and port of call, a prefixed traffic quota for each carrier, harmonisation of commercial activities and maintenance of a common co-ordination office.
Heavier capital investment requirement, poorer freight rates and fiercer competition has accentuated the old problem of technical and commercial harmonisation of lines to rationalise the use of assets.
The second stage is the alliance, where liner shipping co-operation takes shape by grouping big shipping lines trading on the main world maritime routes. Alliances are a kind of consortia with the main objective based on technical agreements. Container lines with a similar scale of operation supported by feeder services are forming alliances. They are less restrictive than the first stage of consortia and they target cost cutting and improving quality of service.
The cost cutting on the sea leg seems to be more and more limited; therefore the competitive edge remains on the land-side. Members of an alliance co-operate in transport equipment and port terminal facilities that account for 70% of the cost for a typical door to door container delivery.
The volume created by the alliance members gives much more negotiating weight when discussing rates with port service and inland transport providers.
In an alliance each party gains a specific advantage from a joint operation. thus by working together these parties create a competitive advantage.
Shipper requirements have driven the development of alliances. Bigger vessels and global alliances are needed to cater for multinational companies which are producing and assembling their products in a large number of countries.
In a joint production the alliance achieves cost savings and gives its members access to more services, like terminal sharing and shore based services, without having a lot of costs. The cost reduction and the growth of revenues are the value added to a successful alliance.
Mergers and acquisitions are other forms of co-operation between carriers. Many companies change hands, some disappearing in the process. Most of the carriers acquired have been second or third tier operators.
Mergers and acquisitions have played a part in the concentration of ownership in the liner shipping industry. This was driven by the faster rate of growth of the major lines. The advantage of mergers and acquisitions over alliances is the savings in the administrative costs as well as in the operational sphere, as they are basically cost driven.
Cost saving can be made by pooling and rationalising equipment, co-ordinating container logistics and collaborating on landside activities.
The levels of co-operation where carriers have commitments differ a great deal, while the mixture of strategies differs according to the condition of each route. It can be concluded that the degrees of co-operation are as follows:
• Slot purchase
• Slot exchange
• Vessel-sharing agreement
• Joint services
• Alliances
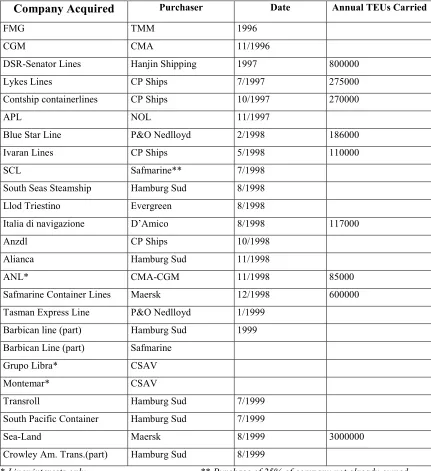
Table 3.2 Liner Industry consolidation
Company Acquired Purchaser Date Annual TEUs Carried
FMG TMM 1996
CGM CMA 11/1996
DSR-Senator Lines Hanjin Shipping 1997 800000
Lykes Lines CP Ships 7/1997 275000
Contship containerlines CP Ships 10/1997 270000
APL NOL 11/1997
Blue Star Line P&O Nedlloyd 2/1998 186000
Ivaran Lines CP Ships 5/1998 110000
SCL Safmarine** 7/1998
South Seas Steamship Hamburg Sud 8/1998
Llod Triestino Evergreen 8/1998
Italia di navigazione D’Amico 8/1998 117000
Anzdl CP Ships 10/1998
Alianca Hamburg Sud 11/1998
ANL* CMA-CGM 11/1998 85000
Safmarine Container Lines Maersk 12/1998 600000
Tasman Express Line P&O Nedlloyd 1/1999
Barbican line (part) Hamburg Sud 1999
Barbican Line (part) Safmarine
Grupo Libra* CSAV
Montemar* CSAV
Transroll Hamburg Sud 7/1999
South Pacific Container Hamburg Sud 7/1999
Sea-Land Maersk 8/1999 3000000
Crowley Am. Trans.(part) Hamburg Sud 8/1999
* Liner interests only ** Purchase of 25% of company not already owned
Table 3.3 Evolution of the Alliances
Original Grouping
Global Alliance Grand Alliance Maersk/Sea-land Hanjin/Tricon KLine/YangMing/ Hyundai(HMM) Original APL - MOL P&O - NYK Maersk/Sea-land Hanjin - DSR K Line YangMing -Line-up Nedlloyd- OOCL Happag Lloyd - NOL Senator - Cho Yang Hyundai (HMM)
Revised Grouping
New World Alliance Grand Alliance 2 Maersk/Sea-land United Alliance
K Line/YangMing /Cosco
revised APL(NOL) - MOL P&O NedLloyd - NYK Maersk/Sea-land Hanjin DSR
-UASC K Line - YangMing
Line-up Hyundai Happag Lloyd - OOCL Senator- Cho Yang Cosco
MISC
Source: Drewry Shipping Consultants Ltd
3.5 Individual operators
Despite the heavy costs involved in purchasing and operating larger container vessels, some operators prefer to operate independently rather than through co-operation with other lines. The idea behind this is to avoid the organisational complexity existing in an alliance because of too many participants.
Evergreen and the Mediterranean Shipping Company are two carriers that prefer to operate independently, believing that decision making is the key.
25
Table 3.4 Alliances and G
lobal P
layers February 2000 (TEUs/ slots in thousan
3.6 Future Developments in Containerisation
The growth in containerisation since 1956 till now has been spectacular. The volume handled and the increase in trade has been characterised from the very beginning by two factors: optimisation of ship design to carry the maximum possible number of containers and improvement in economy by increasing the size of ships. As world trade continues to grow, container trade volume follows. This growth is obvious in European and Asian ports and it will continue to grow even faster in some regions like the Baltic and China.
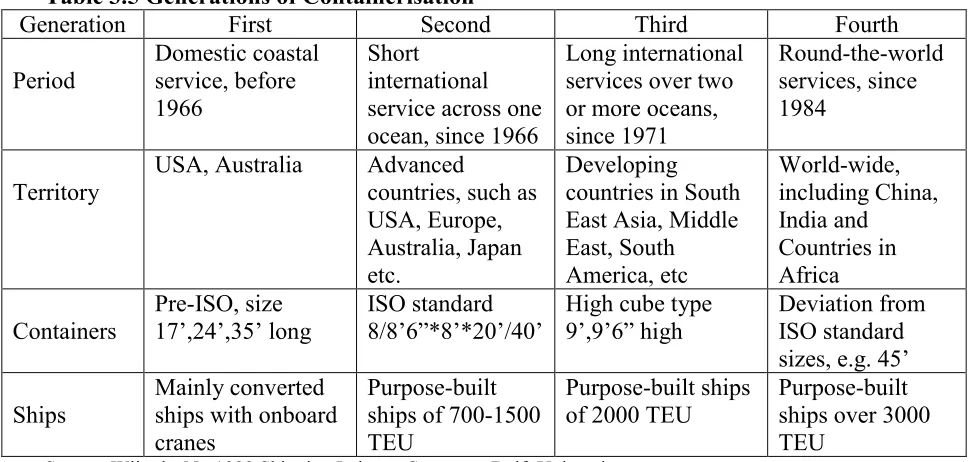
The developments of large container ships started years ago in 1980 but only recently vessels have come close to 8000 TEUs. Efforts are aimed at an improvement in economy by increasing ship size. Each generation of container ships is characterised by the factors indicated in the following table.
Table 3.5 Generations of Containerisation
Generation First Second Third Fourth
Period Domestic coastal service, before 1966 Short international service across one ocean, since 1966
Long international services over two or more oceans, since 1971
Round-the-world services, since 1984
Territory USA, Australia Advancedcountries, such as
USA, Europe, Australia, Japan etc.
Developing countries in South East Asia, Middle East, South America, etc World-wide, including China, India and Countries in Africa Containers Pre-ISO, size 17’,24’,35’ long ISO standard 8/8’6”*8’*20’/40’
High cube type 9’,9’6” high
Deviation from ISO standard sizes, e.g. 45’
Ships Mainly convertedships with onboard
cranes
Purpose-built ships of 700-1500 TEU
Purpose-built ships
of 2000 TEU Purpose-builtships over 3000
The effect of economies of scale have led to a rapid increase in ship size from feeders to post Panamax. The limits of development of the 8000, 12000 and 15000 TEU container ship are now not in the design, but come from the following aspects:
• the cargo handling facilities and logistics requirements for the ports
• the water depth in ports and port entrance
• the fluctuation in fuel prices
More efforts are being made on the cargo side as well. Commodities that used to be shipped in bulk or break-bulk form are now routinely being containerised; not only high value cargo but low value as well. This means that all market segments are heavily influenced by logistics arrangements.
The lack of port infrastructure to load and unload bulk commodities in some markets has meant the use of containers enabled them to trade. Moreover, containerisation suited the markets that can deliver smaller volumes on a regular basis rather than in bulk.
Fast container ships of 40 knots are due to start in 2002, allowing time sensitive cargo to be moved in a more efficient way. This will have an impact on the handling facilities at ports receiving such kinds of ships. Conventional handling cranes will slow the transport process but a new handling system is being developed to cope with these fast ships in order not to lose the time gained at sea by reducing time at port. The system uses a container pallet train to load and unload the ship, and can unload a fast ship of 1423 TEUs in about 4 hours instead of 30 hours by conventional handling systems.
Chapter 4
CHALLENGES
4.1 Container vessels of the next generation
The steady downward pressure on freight rates, coupled with the impending requirement for carriers to replace outdated tonnage can mean only two things:
1) Lines are constantly searching for greater economies of scale (through upsizing)
in an effort to reduce unit costs.
2) As a significant fleet replacement programme is imminent anyway, the next few
years will be when the entry of big new ships should be most expected. Older and slower ships will be scrapped in fairly large numbers over the next few years and this will pave the way for a new generation. As illustrated in the table 4.2, 12% (526113 TEUs of capacity) of the global container fleet is 20 years and older and could be retired very soon.
Ship design development went very fast after the delivery of the 1st post PANAMAX
ship took place in 1988. Thereafter the first 5000 TEU ship was delivered in 1995, the first 6000 TEU ship in 1996 and the first 6600 TEU ship in 1997 (8700 if empty containers on deck are taken into account)
A comparison in table 4.1 between an optimised Panamax container ship, the first post-Panamax container ship and the 6600 TEU container ship shows that the advantages of first Post-Panamax container ships were very limited.
Although the container ships built so far can easily pass the Suez Canal, a further size increase will reach the limit of this canal.
Canal today, which are, both in breadth and draft, for ships with a breadth of over 48.16 m and a maximum draft is 58 feet (17.67 m).
Table 4.1 Comparison of Container ship designs
Optimized Panamax First Panamax 6600 TEU
Length 294.0 m 275.2 m 347.0 m
Breadth 32.3 m 39.4m 43.0 m
Molded Depth 21.4 m 23.6 m 24.1 m
Draft 13.5 m 12.5 m 14.5 m
Deadweight 67680 t 54655 t 77000 t
Speed 23.8 kn 24.2 kn 25.0 kn
Power 36497 kw 41882 kw 55000 kw
Capacity 4422 TEU 4340 TEU 6600 TEU
Source: Wijnolst N. (1999), Shipping Industry Structure, Delft University
The following table illustrates container fleet age profile (for fully cellular vessels) Table 4.2 Container Fleet Age Profile
Fully Cellular Number ,000 TEU Fleet Ratio
Container Ships Age Profile (years) Age Profile (years) May Fleet /
Fleet Profile 25+ 20:24 15:19 10:14 5:9 0:4 25+ 20:24 15:19 10:14 5:9 0:4 2000 20 Yrs.+
100/249 66 40 14 4 6 17 10.2 6.9 2.5 0.7 1.0 3.3 24.6 70%
250/499 32 64 59 28 51 91 10.6 22.8 23.8 10.5 18.5 33.2 119.4 28%
Total Feeder 98 104 73 32 57 108 20.8 29.7 26.3 11.2 19.5 36.5 144 35%
500/749 14 33 56 18 55 144 9.2 20.3 32.6 11.4 33.2 89.1 195.8 15%
750/999 12 36 29 23 24 70 10.9 31.9 24.7 19.7 21.5 59.9 168.6 25%
Total Feedermax 26 69 85 41 79 214 20.1 52.2 57.3 31.1 54.7 149 364.4 20%
1000/1499 33 50 63 47 114 165 41.7 60.0 78.5 52.8 136.7 193.9 563.6 18%
1500/1999 6 28 33 45 74 148 10.4 47.7 58.8 79.5 125.0 244.6 566 10%
Total Handy 39 78 96 92 188 313 52.1 107.7 137.3 132.3 261.7 438.5 1129.6 14%
2000/2499 13 30 34 9 27 101 28.6 68.2 73.8 18.8 61.8 226.8 478 20%
2500/2999 2 29 26 48 20 45 6.0 79.9 70.7 130.3 55.5 126.8 469.2 18%
Total Sub-Panamax 15 59 60 57 47 146 34.6 148.1 144.5 149.1 117.3 353.6 947.2 19%
3000/3499 4 2 10 45 38 32 12.6 6.2 31.1 144.1 120.8 106.9 421.7 4%
3500/3999 6 20 37 36 23.1 75.4 137.1 136.1 371.7
4000&+(Panamax) 9 3 32 68 41.5 12.7 135.5 292.2 481.9
Total Panamax 4 2 25 68 107 136 12.6 6.2 95.7 232.2 393.4 535.2 1275.3 1%
4000/4499 5 10 1 21.7 43.9 4.5 70.1
4500/4999 9 13 42.8 63.8 106.6
5000/5499 30 157.8 157.8
5500/5999 17 94.8 94.8
6000+ 25 167.6 167.6
Total Post-Panamax 5 19 86 0 0 0 21.7 86.7 488.5 596.9
TOTAL 182 312 339 295 497 1003 140.2 343.9 461.1 577.6 933.3 2001.3 4457.4 11%
The main characteristics of the Suez-max and Malacca-Max container vessels as described in a recent study by Wijnolst, (1999) and a student team are as follows: Table 4.3 Characteristics of Suez-max and Malacca-Max container ships
Specification Suez-Max Malacca-Max
L O A (m.) 400 400
LwL (m.) 390 390
L B.P (m.) 380 380
Breadth (m.) 50 60
Draft (m.) 17.04 21
Depth (m.) 30 35
Block Coeff. 0.62 0.62
Displac. (t.) 212194 313571
D.Weight (t.) 157935 242800
Speed (knots) 25 25
Capacity (TEU) 11989 18154
Layout Forward bridge and pram-shaped stern Forward bridge and pram-shaped stern General Plan 25 blocks of 40’containers.
U/Dk 17 box wide. O/Dk 19 box wide. 3 m. wide double skin
26 blocks of 40’containers. U/Dk 20 box wide *12 tiers O/Dk 24 box wide * 8 tiers 5 m. wide double skin
Propulsion 2*5 blades propeller D.8.6 m. 2*5 blades propeller D.8.6 m. Engines 2*45768kw
Consumption/day 328 t. f.o
2*62810kw
Consumption/day 430 t. f.o Stability 12 t. Homogenous * 11989 TEU GM is 0.31m
12 t. ,, * 11723 ,, ,, 1.10m 14 t. mix * 11989 ,, ,, 1.33m 14 t. ,, * 10281 ,, ,, 2.16m
12 t. Homogenous * 18154 TEU GM is -0.84m
12 t. ,, * 17482 ,, ,, 1.00m 14 t. Mix 14/10 t. * 18154 ,, ,, 1.02m 14 t. Homogenous* 10281 ,, ,, 0.98m
Hatches Open hatch Open hatch
Source: Wijnolst N., Malacca Max, Delft University Press, the Netherlands
Cross-section in
The following table indicates the maximum allowable dimensions of vessel sizes and draft to pass Suez Canal.
Table 4.4 Suez Canal Beam and Draft
Beam Draft
Meter Feet Meter Feet
48.16 158.00 17.07 56.00
50.00 164.00 16.45 53.96
55.00 180.33 14.94 49.00
60.00 196.83 13.11 43.00
60.96 200.00 12.65 41.50
Source: Fairplay Ports guide
• Loading and Discharging Malacca-Max container ship
A new design, which boosts the loading and discharging speed, has developed a new concept capable of doing 70 moves per hour. The outreach of this crane is 74 meters. This design is made by crane builder Huisman-Itrec. The unloading is on stages as follows:
Vertically out of hold, backwards to be delivered to an automatic trolley which takes the container to the quayside to place it down on an elevator. This elevator places the container at the bottom of the crane. The crane has a small storage area underneath, which acts as a buffer to smooth the movements of containers away from the quay.
A significant cost-reduction is achieved through up scaling of ship size. A comparison between large container ships is shown in the following table:
Table 4.5 Comparison of container ships Transport Cost (deep see only)
Ship Type Av. TEU Capacity Capacity Increase Transport Cost Savings
(than Panamax) US$/TEU/Day (than Panamax)
Panamax 4000 0.0% 210 0.0%
Maersk s class 6600 65.0% 185 12.0%
Suez-max 12000 200.0% 178 15.0%
Malacca-Max 18000 350.0% 150 28.5%
A considerable saving for Malacca-Max design accounts to anywhere between 16% and 30% if compared to (Maersk S-Class) and Panamax design respectively in over all cost reductions. The transhipment costs and through transport, which constitute 80% of the total costs, are not included. However, if the cost savings are calculated over the total container transport costs, the cost savings are somewhere between 3% and 6%. Therefore, the costs savings that are made by using larger ships are not offset by higher costs on shore.
The main challenge of Malacca-Max container ships lies in three areas:
1) Commercial:
A weekly service requires a number of ships and that is means very high investment costs. The dimension of this design limits its flexibility and prohibits its employment in certain operation patterns like round the world where it cannot transit the Panama Canal.
For employment in the Europe-Far East trade, even if it can pass the Suez Canal, it will be dependent on one trade only and any economical problem (like the Asian crisis in 1998) will have a severe impact by putting freight rates under pressure.
2) Technical:
If a vessel has to be taken out of service, this will result in an expensive replacement, if any.
3) Land-side:
4.2 Ports Capabilities
Amongst the ten largest ports, which account for more than 30% of the global volumes in container, very few will be able to handle large ships due to physical constraints of the water depth. Principal options considered for handling large vessels might be dredging, offshore terminals, new deep-water ports and lightening.
The choice of one of these options depends on how much traffic a port might be willing to attract. In addition, the port should have the necessary infrastructure and enough land area, for the logistical operation and transhipment activities needed to handle these ships. For economical reasons, the deployment of Suez-max and Malacca-Max ships will be in the East-west trade, transpacific or Europe/Far East.
Even by dredging operations and using the high water of the tide effect, major container ports in North-western Europe like Hamburg, Antwerp, Felixstowe, Bremerhaven will have draft restrictions for ships with a 15m draft.
Rotterdam is the only major port in North-western Europe that will be able to accommodate such container ships of the next generation. Rotterdam is developing a new container terminal to become operational in 2003. The partners in this project are ECT and P&O Nedlloyd which have chosen the northernmost part of Maasvlakte for further terminal expansion until 2010. The site covers about 55 hectares with an 850 m quay. Water depth is 16.65 m and the capacity is about 1M TEU a year. The future expansion could be 110 hectares, with 1500 m quay, 19 m water depth and 2M TEU capacity. Recently, more dredging has taken place to enable 5500 TEU ships with 13.5 m draught to reach ECT home terminals.
a good chance for ports under construction in this area, having a strategic location, to take advantage by attracting such mega ships by considering their requirements, while under construction (in dredging and equipment). At both ends of the Suez Canal, East of Port Said Port and Suez, mega ships could be served without any deviation in their voyage in two ways:
1) Transhipment activity
2) Lightening activity
The two interrelated activities will serve large container ships of the next generation with a deep draft to achieve two goals. The first is to have more containers to be transhipped to the Mediterranean and Middle East region on both east and westbound voyages. This will give the ships more chance to utilise their huge capacity instead of carrying only containers to/from the Far East. The second is lightening the Malacca-max, which in addition, will enable it to transit the Suez Canal.
East of Port Said Port will have an initial capacity of 250000 TEU with a potential for 1 million. The construction of the new harbour has already begun by a consortium of contractors. Phase one, now well underway, consists of a 1200 m of container-handling quay, dredging the approach channel, northern and middle turning circles, and inland channel; constructing a new break water, shortcut, berthing channel and widening the canal by-pass; and constructing a 1200 m x 500 m container terminal and other general cargo/dry bulk terminal. Phase two consists of a further 1200 m of container quay wall, the construction of two Basins and expanding the container terminal.
Figure 4.1 East Port Said port lay-out
Source: Egyptian Ministry of Transport and communication
The port will be connected to the rest of the country by road and rail bridges, over the Suez Canal, set to open at the end of 2000 and early 2001 respectively. These links have an effect on the success of the port to capture a slice of some 12 million TEU per annum that is expected to be transhipped in the region in the future.
In addition, an industrial area and free zone is being developed adjacent to the port which is expected to add an incentive to attract international ship owners/operators to the new port.
channel 3325 m long, 350 m wide and 17 m deep with 2 breakwaters 960 and 770 m in length respectively and a 650 m diameter turning circle. The two Northern docks are 750 m in length, 350 m in width each and the two southern docks are 100 m in length and 350m and 250 m in width with a depth of 17 m which can be deepened in future stages.
A concession by the Egyptian government was awarded to North Al-Sokhna Port Development Company (SPDC) to manage the port with a renewable 2-year Build Operate and Transfer (BOT) agreement. The agreement requires that SPDC furnish the terminal cranes and container handling equipment, manage the port operations and promote the advantages of the port internationally. Other partners in SPDC include the Stevedoring Services of America (SSA), which specialises in designing, constructing and operating port and rail facilities, and the Egyptian Container Handling Company (ECHCO) which primarily provides terminal handling services for the fleet of American President Lines (APL) calling on Egypt from the USA and Far East, (ECHCO has a 60% stake in SPDC)
Figure 4.2 North Al-Sokhna port lay-out
4.3 The Suez Canal
The importance of the Suez Canal in the service of world trade is clearly demonstrated by the volume which passes through it. The saving in distance sailed between Europe and Asia is significant, consequently, the saving in fuel costs will have a direct effect on freight rates. Thus, the canal has an impact on the world economy.
The first canal to link the Mediterranean Sea and the Red Sea is believed to have been in 1874 BC built by Farao Senaurset III. Ever since, modification of this canal has taken place until it was filled in by the Caliph Abu-Jafar-Al-Mansour in 767 AD for strategical reasons.
On 30 November 1848 the Viceroy of Egypt issued a “Firman of Concession” to construct a canal based on the request of the French engineer Ferdinand de Lesseps. A final concession was granted in January 1856 and the constructing work on the canal begun in April 1859. The concession to operate the canal was awarded to a limited company, Compagnie Universelle du Canal Maritime de Suez, with shares to subscribers in Egypt, France and Great Britain, primarily governmental but also private investors. It took 10 years to complete the construction of the canal.
On 26 July 1956 President Nasser nationalised the Suez Canal, the previous British and French shares in the operating Company received from Egypt being compensated for on the basis of the value of their shares. An international furore followed and the Canal was closed for 165 days from 26 October 1956 to 10 April 1957.
Table 4.6 Enlargement of the Suez Canal
Year Area (Sq. m.) Max. Draft (m.) Av. Width (m.) Max Dwt (tones)
1869 310 6.76 45.86 7000
1900 460 7.8 58.97 10000
1908 680 8.53 79.72 14000
1912 720 8.53 84.41 14000
1914 870 8.84 98.42 16000
1954 1200 10.67 112.46 32000
1961 1600 11.28 141.84 45000
1964 1800 11.58 155.44 65000
1980 3700 16.16 228.96 150000
2010 280000
Source: Wijnolst N., Malacca Max, Delft University Press, the Netherlands
Due to the constant expansion of the Canal the maximum dimensions are increasing. At the moment (august 2000), the maximum allowable draft is 17.63 m. The width of the Canal is 3 times the breadth of the largest expected vessel at that draft.
The following factors are taken into account when calculating the minimum required depth of the Canal
• Maximum accepted ship’s draft
• Squat effect (maximum 1.07 m)
• Dynamic trim (maximum 0.15 m)
• Keel clearance (1 m)
• Dredging tolerance (0.91 m)
• Tidal range
• Seasonal influences
Fairplay Daily News (18 August 2000) mentioned “Egypt has given the go-ahead for the work to widen and deepen the Suez Canal which would allow the passage of VLCCs, according to news agency reports. The $441M project will allow 250,000 DWT ships with 66-foot draughts to use the canal in 2005, and by 2010, 350,000 DWT vessels of 72-foot draught will be allowed through. The expansion work will increase the width of the Suez Canal from 345 to 400 m and its depth from 22 to 25 m”.
Transit dues are calculated on the basis of Suez Canal net tonnage (the gross tonnage-enclosed spaces for machinery, equipment, crew and void spaces). Pilotage tugs (if applicable) and surcharge (for deck containers in container ships) are additional. Loaded vessels over 170.000 DWT will be escorted by two tugs. Rates of Escorting Tugboats (a Unified Canal Passenger rate of 6600 SDR is to be paid for each escorting tug. This table illustrate an overview of the dues in 1998.
Table 4.7 Suez Canal dues
Suez Canal net tonnage
First 5000 Next 5000 Next 10000 Next 20000 Next 30000 Rest of Vessel Condition Laden Ballast Laden Ballast Laden Ballast Laden Ballast Laden Ballast Laden Ballast
Vessel Type SDR/ SCNT
Crude oil 6.49 5.52 3.62 3.08 3.25 2.77 1.40 1.19 1.40 1.19 1.21 1.03 Product 6.75 5.52 3.77 3.08 3.43 2.77 1.93 1.19 1.93 1.19 1.93 1.19 LPG Carrier 6.75 5.75 3.77 3.21 3.43 2.92 2.42 2.06 2.42 2.06 2.42 2.06 Dry Bulk 7.21 6.13 4.14 3.52 2.97 2.53 1.05 0.90 1.00 0.85 1.00 0.85 Container 7.21 6.13 4.10 3.49 3.37 2.87 2.42 2.06 2.42 2.06 1.83 1.56
Source: Wijnolst N., Malacca Max, Delft University Press, the Netherlands
Table 4.8 Suez Canal Dues Calculation
Fees Malacca - Max Suez - Max Maersk s-class
in Dues in Dues in Dues in Dues in Dues in Dues in
Item SDR SDR US$ SDR US$ SDR US$
For the first 5000 SCNT 7.21 36050 49749
For the next 5000 SCNT 4.1 20500 28290
For the next 10000 SCNT 3.37 33700 46506
For the next 20000 SCNT 2.42 48400 66792
For the next 30000 SCNT 2.42 72600 100188 24200 33396
Total
For each additional SCNT 1.83 311100 429318 95160 131321 0 0
Total 430850 594573 306410 422846 162850 224733
Surcharge 14% 60319 83240 42897 59198 22799 31463
Total 491169 677813 349307 482044 185649 256196
Each escorting Tug 6600 13200 18216 13200 18216 0 0
Grand Total 504369 696029 362507 500260 185649 256196
Source: Based on Suez Canal Authority tables and circulars
The cost of a single passage of 6000 TEU vessel is about US$ 256196. This is a significant cost element for the ship-owner, but against it, a voyage between Northern Europe and the Far East would take about 6 days more if the vessel had to proceed via the Cape of Good Hope. In bunker alone the cost would be some US$40000, about an extra 1344 tons being required.
The economies of scale in shipping make it relatively cheap for larger vessels to sail around the Cape of Good Hope. Thus, lower rates are offered to them when transiting the Canal. This explains the increase in transiting net tonnage and the drop in net income.
Table 4.9 Suez Canal Traffic
Year Number Of ships Net Ton. in 1000 % of total Traffic
Container Total Container Total In number In Net ton
1994 3713 16370 108217 364487 22.7 29.7
1995 3765 15051 116276 360371 25 32.2
1996 4082 14731 130164 354974 27.8 36.7
1997 4012 14430 138839 386720 27.8 37.7
1998 4049 13471 154095 386069 30 39.9
As shown in the table in the last six years the total number of ships transiting the Canal dropped by 2880 ships (17.6%), while the net tonnage increased by 20507000 tons (5.6%) indicating that the average ship size increased. Container traffic in particular has increased both in ships’ number by 662 ships (17.8%) and in net tonnage by 60028000 tons (55.5%). The percentage of transiting container ships through the canal of all other vessels is considered high (43.7% in 1999), which reveals an increase in trading volumes on the East-West trade route.
Figure 4.3 Suez Canal Lay-out
4.4 Land Bridging
The development of land bridges is highly related to integrated transport systems. Equally containerisation is highly related to multimodal transport.
The concept of land bridge is not recent, the idea going back several hundred years when trade between Europe and Asia, by the ancient caravan trade, used the “Silk route”. Land bridge means using land transport for a part of an ocean voyage for the purpose of reducing transit time and cost.
The important land bridges in the world exists in 3 main regions in the world; North America, Russia and Middle East. Long ago, Europe used land bridges in trading with China and India. The “Silk route” was used to transport goods from Europe through ports in Turkey and by road in Asia to China. The Egyptian land bridge to transport goods from Europe was through the ports of Rossetta and Damietta on the Mediterranean Coast, then by road to Suez then by sea to India.
The economical aim of land bridging is to save both cost and transport time. Liner operators save cost in using land bridges by concentrating on calling at fewer ports which have good connections to the hinterland by road, rail or inland water modes, thus saving on cost and time by calling at fewer ports. Also they can achieve better service in reaching land-locked countries.
There are five important land bridges are:
1) North American land bridge