M E T H O D O L O G Y A R T I C L E
Open Access
A multi-animal tracker for studying
complex behaviors
Eyal Itskovits
1,2, Amir Levine
3, Ehud Cohen
3and Alon Zaslaver
1*Abstract
Background:Animals exhibit astonishingly complex behaviors. Studying the subtle features of these behaviors requires quantitative, high-throughput, and accurate systems that can cope with the often rich perplexing data.
Results:Here, we present a Multi-Animal Tracker (MAT) that provides a user-friendly, end-to-end solution for imaging, tracking, and analyzing complex behaviors of multiple animals simultaneously. At the core of the tracker is a machine learning algorithm that provides immense flexibility to image various animals (e.g., worms, flies,
zebrafish, etc.) under different experimental setups and conditions. Focusing onC. elegansworms, we demonstrate the vast advantages of using this MAT in studying complex behaviors. Beginning with chemotaxis, we show that approximately 100 animals can be tracked simultaneously, providing rich behavioral data. Interestingly, we reveal that worms’directional changes are biased, rather than random–a strategy that significantly enhances chemotaxis performance. Next, we show that worms can integrate environmental information and that directional changes mediate the enhanced chemotaxis towards richer environments. Finally, offering high-throughput and accurate tracking, we show that the system is highly suitable for longitudinal studies of aging- and proteotoxicity-associated locomotion deficits, enabling large-scale drug and genetic screens.
Conclusions:Together, our tracker provides a powerful and simple system to study complex behaviors in a quantitative, high-throughput, and accurate manner.
Keywords:Multi-animal tracking, Image analyses, Chemotaxis,C. elegans, Locomotion
Background
Animal behavior is rich and complex [1]. It spans a tre-mendously wide range of phenotypes such as sleep, mat-ing, food search, and fighting. In its early days, this fascinating field was dominated by classical field studies involving visual inspection and hand-written documen-tation. The discipline has considerably evolved and nowadays is known as “computational ethology” [2]. Technology advances are now replacing the laborious manual work and scientists employ sophisticated com-putational approaches to generate accurate quantitative understanding of the detail-rich complex behaviors.
In the last few decades, significant advances in genetic-and neural-related techniques have been achieved, genetic-and animal model systems have become popular to study complex behaviors under lab-controlled environments.
These animal models range from simple invertebrates, such as worms and flies, to mammalian models, includ-ing mice and monkeys [2].
Of particular interest is the small roundwormC. elegans [3]. Among the many advantages that this nematode offers are its short generation time, the easy and inexpensive handling, and the availability of its fully-reconstructed neural system consisting of only 302 neurons [4].C. ele-gansanimals also show remarkably complex behaviors, in-cluding mating [5], roaming and foraging [6], lethargus [7], and taxis towards various stimuli such as preferred temperature [8], magnetic fields [9], and food [10–12]. Over the years, large genetic screens have identified a vast set of mutations in genes that modulate these behavioral outputs, enabling a mechanistic insight into these com-plex behaviors [13, 14].
In addition, a growing interest is directed towards quantitative measures of aging and proteotoxicity-associated physiological decline. C. elegansis an appeal-ing model organism to study these processes as many
* Correspondence:[email protected]
1Department of Genetics, The Silberman Institute of Life Science, Edmond J.
Safra Campus, The Hebrew University of Jerusalem, Jerusalem 91904, Israel Full list of author information is available at the end of the article
human neurodegenerative diseases that result from ag-gregation of proteotoxic proteins can be recapitulated in the worms’ muscular and nervous systems [15]. These diseases are often associated with deteriorating locomo-tion abilities, culminating eventually in complete paraly-sis. It therefore becomes an important, yet extremely challenging, task to quantify minute locomotive changes in a high-throughput manner.
To study such complex behaviors, numerous tracking systems that image freely-moving animals have been de-veloped. These systems extract various fine locomotion features, such as animal posture, undulation properties, speed, and attraction or repulsion towards or away from stimulants [16–23]. To support high-throughput studies, some of these systems were designed to track multiple worms at a time. This sort of tracking is particularly challenging as accurate extraction of genuine worm en-tities from ‘noisy’background is difficult. Moreover, fre-quent animal collisions preclude extraction of long individual tracks.
Here, we present a novel Multi-Animal Tracker (MAT), an end-to-end, user-friendly solution for im-aging, tracking, and analyzing complex behaviors. At the heart of the tracker is a machine learning algorithm; thus, the tracker makes no prior assumptions regarding the size or the shape of the tracked animals and hence is compatible in studying virtually any animal of interest. We also included built-in functions that allow non-programmers to analyze and visualize the immense data. We demonstrate its high-compatibility tracking various animals, and its powerful abilities studying complex be-haviors in C. elegans animals in an accurate and high-throughput fashion.
Results
In the following sections, we demonstrate the vast uses of the novel MAT to studying complex behaviors. We begin by describing the packages included in the soft-ware suite and then provide experimental evidence, in-cluding novel gained insights, for the extensive usage of this MAT in studying chemotaxis and sensory integra-tion, as well as aging- and proteotoxicity-associated locomotion decline.
The new MAT provides an end-to-end solution for tracking animals–from video acquisition and track identification to advanced analyses
Our novel MAT includes three software modules, namely (1) video acquisition, (2) track extraction, and (3) advanced functions for analyzing complex behav-iors (Fig. 1a). All packages are based on MATLAB (MathWorks© Inc.) and a detailed guideline for in-stalling and using the different modules is provided in the accompanying Additional file 1.
The ‘AnimalsRecorder’ module allows capturing of time-lapse movies in a variety of video formats. This package circumvents the need to rely on commercial software that often interfaces with exclusive cameras and setups. The user can easily modulate various im-aging parameters such as recording duration, number of frames, and exposure time.
The main module in the software is ‘AnimalsTracker’. This module uses a machine learning algorithm to identify individual animals and extracts their continuous tracks over long temporal recordings, typically consisting thou-sands of frames. The Graphical User Interface (GUI) in this module displays several panels that allow scrolling be-tween the different frames, and visually comparing the ori-ginal image to a filtered one (Fig. 1b). This feature provides a simple and convenient mean to inspect and evaluate how well the tracker extracts the observed en-tities from their background in each frame. The user can quickly adjust the extraction sensitivity between different frames. Once satisfied with the entities extraction, the user is asked to mark individual animals in order to train the machine learning algorithm to correctly identify them.
The additional module,‘AnalysesPlugins’, contains sev-eral useful built-in analyses functions; some of these functions are basic analysis tools, but others offer ad-vanced toolkits that allow non-specialist programmers to sophisticatedly analyze the complex behavioral para-digms. These tools are further described below.
A machine learning algorithm extracts accurate tracks of multiple animals over long time periods
At the core of the tracker is a machine learning algo-rithm which provides an immense flexibility to image and track virtually any moving animal, including worms, flies, zebrafish, and mice (Fig. 1c–f, and Additional file 2: Movie S1, Additional file 3: Movie S2, Additional file 4: Movie S3, Additional file 5: Movie S4). The user is not required to explicitly provide animal features. Rather, the user‘trains’the tracker by clicking on a small number of animal entities from the assay images using a user-friendly GUI (Fig. 1b). The tracker learns the animals’ features based on the user’s picks, and uses this informa-tion to build a discriminative model between animal en-tities and background ‘noise’ (Fig. 2a). Moreover, the machine learning algorithm is insensitive to different ac-quisition parameters such as resolution, contrast, frame rate, color depth, etc. The tracker successfully distinguishes (with a configurable parameter for an approximate false negative rate,β, set to 0.01 by default, see Methods) between animals and background‘noise’that typically accumulates during long experiments (Additional file 6: Figure S1a). As few as a dozen clicks on animal entities from the first, mid, and last frames of the movie are sufficient for accur-ate extraction of animal trajectories throughout thousands
of frames. In fact, accuracy analyses show that the tracker achieves a precision of approximately 0.9 and recall of over 0.85 (Fig. 2b, see Methods for details).
A major obstacle in maintaining long tracks of individ-ual animals is the frequent collisions between them. To overcome this, we implemented a simple variation of the Kalman filter [24], which predicts the future position of the colliding animals based on previously observed mo-tility features (e.g., velocity, acceleration; see Methods for implementation). Implementing such a predictor sig-nificantly improves detection following animal collision; for example, implementing the predictor reduces the cases where none of the animal trajectories could be re-solved following collision to approximately 2% only (whereas as many as 46% of the collision events could
not be resolved if not implementing the predictor; Additional file 6: Figure S1b). Moreover, the prediction also significantly extends the tracks’length as it compen-sates in cases where animal segmentation fails to identify a genuine animal (Fig. 2c, Additional file 7: Figure S2). Overall, this allows the tracker to maintain identification of individual animals over long imaging time periods (Additional file 6: Figure S1c, Additional file 7: Figure S2, Additional file 8: Movie S5, Additional file 9: Movie S6, Additional file 10: Movie S7).
Clearly, collision events become more probable as ani-mal density increases, thereby limiting the time of effi-cient tracking. In our experimental setups (circular, 50 mm diameter field of view), we found a negative lin-ear correlation (ϱ=−0.7,P< 0.001) between the number
of worms on the experimental plate and the average dur-ation of tracking (Fig. 2d). In addition, the implemented Kalman-type predictor aids ignoring potential interfer-ence during the experiment. For example, the software discounts transient user interventions, such as manual handling of mice during the course of the experiment, and proceeds by focusing on mice tracks only (Add-itional file 5: Movie S4).
The new tracker is highly suitable for studying large-scale dynamics of chemotaxis behavior
To demonstrate the many advantages and the high suit-ability of the MAT to study complex behaviors, we
focused onC. elegans nematodes. One of the fascinating complex behaviors that these worms exhibit is chemo-taxis, in which animals navigate up a chemical gradient towards the chemical source. Very often, chemotaxis as-says are quantified by an attraction index that reflects the end position of the animal, disregarding its intricate trajectories throughout the course of the chemotactic behavior [10]. High-throughput analyses of such trajec-tories with their relation to the chemical source are im-perative to underpinning the mechanisms by which animals navigate through gradients. Our tracking system is particularly suitable for studying complex chemotactic behaviors – it extracts long behavioral tracks of dozens
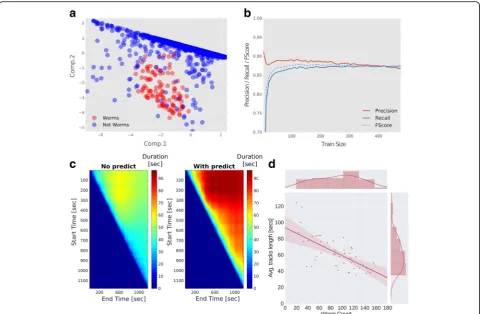
Fig. 2The tracking software successfully extracts trajectories of multiple animals at a time despite background noise.aPrincipal component analysis over all detected animal instances in a single frame shows that worm entities are faithfully segregated from background entities. For example, during long temporal recordings, drop condensation on the lid and trail marks contribute to the identification of approximately 2000 erroneous entities per frame. The number of genuine animal entities, however, remains constant (around 100) throughout the movie (see also Additional file 6: Figure S1). Thus, the software successfully learns the crucial features to detect animal entities and discards background noise.
bAccuracy of worm detection as a function of the training size. The precision (fraction of actual worms out of total entities classified as worms) reaches nearly 90%, and recall (out of all worms genuinely found on the plate, how many are indeed classified as worms) reaches approximately 85%. Fscore is the harmonic average of the two parameters (precision and recall); as few as 50 worms are sufficient to reach these accuracies (see Methods for details how these parameters were obtained).cImplementing a variant of a Kalman predictor significantly enhances track length. Shown are the lengths (in seconds) of all tracks without implementing the predictor (left), and when using the predictor (right). The y-axis and x-axis denote the start and end time, respectively, of the period the tracks lengths were averaged on. Shown are all tracks identified throughout the movie. Significant longer tracks are extracted if implementing the predictor (80 ± 0.54 [s] compared to without the predictor 58 ± 0.3 [s], in the period of the experiment that yielded the longest tracks,P< 0.001).dThere is a trade-off between the number of worms loaded on the assay plate and the average length of detected tracks. The more worms loaded the shorter are the continuously detected tracks. Up to 200 worms can be assayed simultaneously in a field of view of 4 × 4 cm if not requiring extraction of long continuous tracks
of animals at a time, and positions these trajectories relative to the stimulus source that is set as a reference point.
We used the tracking system to extract trajectories of a large number of animals tracked simultaneously during 30 minutes of chemotaxis. To study the chemotaxis per-formance quantitatively, we defined three regions of interest (ROIs, Fig. 3a), namely the start point where a drop containing over 150 worms is placed (Blue), an area circling the spot of the chemotactic cue (Red), and an area circling the control area typically spotted with the buffer solution used to dilute the chemical cue (Orange). The tracking software counts the number of worms en-tering or leaving each of these ROIs, thus providing a quick and quantitative analysis of chemotaxis kinetics that can be viewed as a temporal variation of the often used‘chemotaxis index’(Fig. 3b, c).
Presenting the rich trajectory data for multiple worms may become cumbersome given the enormous amount of data obtained by the tracking of multiple worms in a spatiotemporal manner over long time periods. To over-come this, we developed the Attraction Field (AF) view, which captures many of the intricate parameters ex-tracted throughout the course of the experiment in a single representation (Fig. 3d, f ). For this purpose, we binned the entire field of view into squares (for our reso-lution we used 35 × 25 squares), and for each square we plotted both the average direction of the worms (arrows) and the overall occupancy over time (color coded). This AF representation provides a quantitative spatial meas-ure of the chemotactic response; for example, higher chemoattractant levels yield more direct trajectories to-wards the chemoattractant from wider regions in the ex-perimental field and higher worm occupancy around the target region compared to lower levels of the chemo-attractant (Fig. 3d–f ). When combining the AF views with the ROI kinetics representation (Fig. 3f, g), these data culminate in a rich quantitative spatiotemporal rep-resentation of the chemotactic response as measured simultaneously for multiple worms over long time pe-riods. The AF and ROI analyses are supplied as built-in functions in our software analysis suite (Additional file 1).
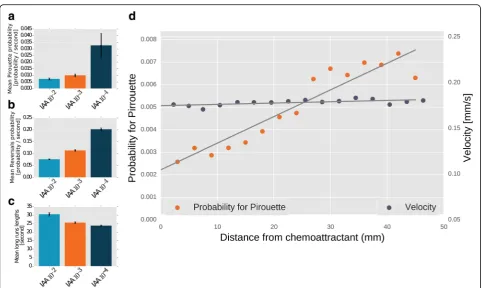
Three key movement features define chemotaxis be-havior in worms and presumably in other animals (e.g., fly larvae [25]). These include reversals/sharp turns, runs, and pirouettes that are defined as bouts of multiple sharp turns and reversals [12, 26]. As expected, these three parameters are dose dependent – the higher the chemoattractant concentration, the fewer the pirouettes and reversals and the longer the run times (Fig. 4a–c, Additional file 11: Figure S3). Interestingly, we find that an animal’s speed remains constant throughout the chemotactic behavior and is independent of the distance from the target. Conversely, the probability for a
pirouette grows linearly with the distance from the tar-get (Fig. 4d).
Worms incorporate directional mechanisms to improve chemotaxis efficiency
Surprisingly, the above experiments provided new in-sights regarding chemotaxis strategies. During chemo-taxis, worms use two main strategies, namely (1) a biased random walk (klinokinesis) where worms increase or decrease turning rates depending on whether they crawl down (dc/dt< 0) or up (dc/dt> 0) a chemical gra-dient, respectively [12]; or (2) a weathervane movement (also known as klinotaxis [27]), where worms moving perpendicular to the gradient reorient to move towards the gradient. Interestingly, Shimomura et al. [12] showed that worms’klinokinesis is not entirely composed of uni-form reorientation events, and worms that are off-course just before the pirouette tend to compensate with a larger change in their direction following the pirouette such that they are better oriented towards the source.
Our experimental results not only recapitulated these observations (Fig. 5a), but also provided novel understand-ing of this complex behavior; worms, originally directed towards the chemoattractant, tend to maintain their gen-eral direction following a pirouette (Fig. 5b, see also Methods). This, in addition to the observations made by Shimomura et al. [12], explains why both directed (–90° < BBefore< +90°) and undirected (+90° < BBefore< 270°) trajectories improve their general direction following a pirouette (Fig. 5aII, bII; Rayleigh Z-test,P< 10–5, for both directed and undirected). Directional changes that follow pirouette events show a bimodal distribution where small (ΔB≈0° rad, cos(ΔB)≈1) and large (ΔB≈± 180° rad, cos(ΔB)≈–1) changes make nearly half of the total direc-tional changes (Fig. 5aIII, bIII).
To understand the functional significance of this reorientation strategy we simulated chemotaxis of
worms adopting different criteria for choosing
directional changes following a pirouette (sampled from our experimental data, see Methods for details). Interestingly, chemotaxis performance of worms simu-lated according to the strategy detailed above was su-perior over other possible strategies as the worms reached the target significantly faster (by approxi-mately 50%, P< 10–5, Wilcoxon rank-sum test, Fig. 5c). These findings provide a novel understanding of ani-mal chemotaxis strategies, and further underscore the significant roles of pirouettes in mediating efficient chemotaxis.
Worms integrate environmental cues and enhance chemotaxis towards richer environments
Fig. 3The Multi-Animal Tracker is particularly suitable for studying complex behaviors such as chemotaxis.aAn image of the experimental chemotaxis plate. Agar plugs soaked with the attractant odorant (red circle), or the control buffer (yellow circle), are placed on the plate’s lid. Neither the attractant, nor the buffer, come in contact with the agar on the plate. Approximately 150 worms are loaded at the starting point (blue circle). The chemoattractant source, the buffer source, and the starting point form an imaginary equilateral triangle with an edge of 4 cm.bA quantitative cumulative dynamics of worm position in the chemotaxis assay over the course of approximately 15 minutes. The lines indicate the number of worms in each of the regions of interest throughout the experiment (color coded). In this experiment, nearly 180 worms were loaded on the assay plate. About two-thirds of them reached the chemoattractant during the first 15 minutes of the assay.cImages were taken at the specific time points (I–IV) throughout the assay (indicated as dashed lines inb) to illustrate chemotaxis progression in the assay plate. Shown are also the trajectories (red) as identified by the tracker software.d–gThe software suite includes a module to generate Attraction Fields (AF), a visualization designed to provide spatial representation of the chemotaxis process throughout the experiment. Shown here are AFs of two chemotaxis assays in which the isoamyl-alcohol attractant was used in 10−4(d) and 10−2(f) dilutions. The experimental field is binned to squares (35 × 25 in this case, but any binning defined by the user is possible). Arrows represent the average direction of the worms and the color code indicates the overall occupancy throughout the course of the experiment (15 minutes, ~1000 frames).e,gChemotaxis dynamics as detailed in section b. Together, these plots provide a full spatiotemporal representation of the chemotaxis behavior of multiple animals over the course of thousands of captured frames
[28, 29]. In particular, during food search, animals often face confusing cues and attending to the most reliable of them is likely to improve their chance of quickly reaching food sources [30]. For example, mul-tiple cues originating from a source may be rendered as a more reliable food source than a source emitting a single cue.
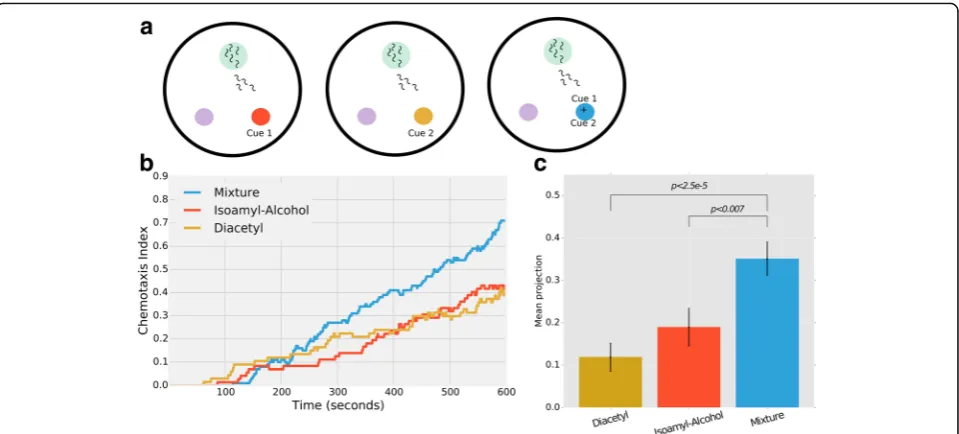
We employed our MAT system and asked whether C. elegans can integrate environmental information (i.e., at-tend to more than one cue at a time) presented as food odorant cues. To do this, we compared worm chemo-taxis towards each of two cues, isoamyl-alcohol (IAA) and diacetyl (DA), when presented independently and when combined as a single mixture (Fig. 6a). Specifically, we used the same experimental design as detailed above for the chemotaxis assays (Figs. 3, 4, and 5). We first assayed worm chemotaxis to each cue in a dose-dependent manner and chose two equipotential concen-trations (the concentration of each cue that attracts the worms to the same extent, see Methods). Both stimuli at these concentrations attract worms with the same kinet-ics (DA: β1 = 0.5 ± 3.3 × 10⁻³; IAA: β1 = 0.5 ± 2.1 × 10⁻³;
β1 denotes the coefficient of the liner regression of chemotaxis dynamics, Fig. 6b). Interestingly, worms are significantly more attracted when these cues are combined and presented as a mixture, as many more worms reach the target area with faster kinetics (Mixture:
β1 = 0.94 ± 4.1 × 10⁻³, Fig. 6b). Importantly, we halved the concentration of each stimulus in the mixture compared to its concentration when presented individually, and yet worms were significantly more attracted to the com-bination of the cues (P< 0.007 compared to IAA and P< 2.5 × 10⁻⁵ compared to DA, Fig. 6b). This suggests that worms can attend both cues concomitantly as they navigate in search of food.
We next asked which features in the chemotaxis be-havior underlie this enhanced attraction. For this, we an-alyzed the directness of the worms towards the different stimuli by quantifying the projection of their steps on the vector that connects the worm and the chemo-attractant (see Methods). We found that worms pre-sented with a mixture of cues move more directly towards the source than worms presented with each cue alone (P< 0.006, Fig. 6c). Together, these data
demonstrate that worms can integrate environmental in-formation and attend to more than one cue at a time. Furthermore, this integration is translated to behavioral
outputs manifested primarily by the ability to better re-orient the trajectory following a pirouette (Additional file 12: Figure S4).
Fig. 5Worms improve their orientation towards the target following the exit from a pirouette.a(I) Angular bearing histogram of worms oriented off-course (90° <B< 270°) immediately before initiating the pirouettes (BBefore); (II) Angular bearing histogram of the worms from (I) immediately
after the pirouettes (BAfter); (III) A histogram of the cosine of the difference in the bearings before and after a pirouettecos(BBefore–BAfter) for
worms that were initially off-course. The histogram shows two peaks (around 1 and–1) indicating that worms tend to perform either extreme (e.g., 180°) or minute (e.g., 0°) angle changes. However, the tendency to perform a pirouette with a larger angular difference in bearing is significantly more probable (P< 10–6, permutation tests, see Methods). The data is composed of 13,297 disoriented pirouette events.b(I) Angular histogram of bearings for worms oriented on-course (0° <B< 90° or−90° <B< 0°) immediately before the initiation of a pirouette (BBefore). (II) Angular
histogram of worms bearing that are on-course immediately after the pirouette (BAfter). (III) A histogram of the difference in the bearings before and
after a pirouettecos(BBefore–BAfter) for on-course worms. As in off-course worms, these initially on-course oriented worms tend to perform either
extreme or minute angle changes, but the frequency of minute changes (cos(Δangle) = 1) is significantly higher (P< 10–6, see Methods). The data is
composed of 15,368 oriented pirouette events.cSimulations of chemotaxis trajectories. We used three different strategies for choosing the exit angle from a pirouette (see Methods for details). The experimentally observed principle, where the exit angle is sampled according to the entry angle, provides an efficient chemotaxis strategy reflected by the significantly shorter time to reach the target point (P< 0.007 andP< 2.5 × 10⁻³, Wilcoxon rank-sum test for random and uniform sampling, respectively). Error bars denote SEM of the number of simulated worms in each simulation. Overall, we simulated 250 worms per strategy
Quantitative analyses of worm motility during aging and neurodegenerative-linked proteotoxicity progression Finally, we demonstrate the powerful advantages of using this novel MAT in studying fine locomotion defi-cits associated with aging and neurodegenerative-related diseases. During these processes, animal locomotion de-teriorates, culminating eventually in complete paralysis [31, 32]. It therefore becomes extremely challenging to quantify minute locomotion changes during these crit-ical periods. Moreover, due to large locomotion variabil-ity within worm populations it is critical to collect large data sets in order to obtain reliable and reproducible re-sults [33]. The MAT system overcomes these hurdles owing to its high-throughput and accurate tracking.
To quantify locomotion during aging, we used syn-chronized worm populations and measured animal mo-tility as they age. As expected, we found a steady and significant decline in animal motility that positively cor-related with age (Fig. 7a, b). Moreover, as velocity is con-siderably low in aged animals, our tracker faithfully identifies multiple worms at a time to score minimal dis-placement events at the single pixels per second reso-lution. Importantly, the significant decline in the average
animal speed was not due to possible death of a fraction of the animals (for which we may score a zero speed). To rule out this possibility, we set our tracking algo-rithm to discard worm events that showed no activity throughout the experiment. This ensured that dead ani-mals would not skew and bias the experimental results.
We next employed our tracker to study aging-associated motility impairment following external manipulations such as those used in large-scale RNAi or chemical screens. In C. elegans, knocking down the sole insulin/ IGF-1 signaling (IIS) receptor, daf-2, leads to long-lived, stress-resistant animals that maintain robust proteostasis [34–36]. Indeed, worms treated withdaf-2RNAi showed a significantly slowed deterioration in motility starting from day 6 and on (Fig. 7c). Similarly, we utilized our MAT sys-tem to quantitatively measure proteotoxicity-associated locomotion decline. For this, we tracked motility of worms expressing the aggregative peptide composed of 35 glu-tamine repeats (polyQ35) in their body wall muscles, which leads to motility impairment in a time-dependent manner [37]. As velocity declined with age, animals treated with daf-2 RNAi exhibited a significantly slower decline, indicating the protective role of inhibiting IIS in
proteotoxicity (Fig. 7d). In particular, the MAT system reli-ably detected minute motility differences (fractions of mm/sec) that ultimately reflect significant differential aging and proteotoxicity paces. Together, these results demonstrate that our MAT system is highly suitable for studying proteotoxicity- and age-related maladies in large worm populations, enabling fast, high-throughput, and ac-curate screens of mutant animals or RNAi libraries.
Discussion
Herein, we present a novel MAT that allows the tracking of multiple animals simultaneously over long time pe-riods. Importantly, this user-friendly system offers an end-to-end solution – from acquisition and recording movies, through tracking algorithms and advanced built-in analyses functions, to displaybuilt-ing the rich data built-in com-prehensive and informative plots.
A major advantage of our system over existing multi-worm trackers is that we implemented a machine
learning algorithm coupled with a Kalman-type pre-dictor [24]. These features turn the tracker into a multi-purpose system compatible with tracking various ani-mals differing in size, appearance, velocities, and other activity parameters. Indeed, we show that the software can faithfully track nematodes, flies, zebrafish, and mice (Fig. 1, Additional file 2: Movie S1, Additional file 3: Movie S2, Additional file 4: Movie S3, Additional file 5: Movie S4). Moreover, the tracker is indifferent to the ac-quisition systems (e.g., a wide variety of optical setups can be used), and it does not require adjusting parame-ters for particular environments or experimental settings (e.g., resolution, brightness, hue, etc.).
Combining machine learning algorithms together with the predictor also supports accurate detection and segmen-tation of animal entities, specifically so when background environments are ‘noisy’. For example, long temporal ex-periments are challenging as the environment is dynamic and often changes over the course of the experiment (e.g.,
Fig. 7The Multi-Animal Tracker (MAT) is compatible with accurate high-throughput measurements of aging- and neurodegenerative-associated locomo-tion decline.aSynchronized CF512 worms were grown to 1, 4, 8, and 12 days of adulthood. An agar plug soaked with 1μL of the repellent 2-nonanone (1:10 diluted in ethanol) was attached to the plate lid and worm movement was recorded 2 minutes thereafter for 1 minute. Analysis using the MAT showed constant aging-associated decline in mean speed.bSpeed distributions within worm populations were unimodal, indicating that the mean value was not biased by a subpopulation of paralyzed or dead worms. The number of speed points in both (a) and (b) that we averaged on were 30,512 for Day 1; 23,672 for Day 4; 9401 for Day 8; and 6240 for day 12.cCF512 worms were grown to days 1, 6, and 12 of adulthood on either control bacteria (EV) or ondaf-2RNAi bacteria. Repellent was added and worm movement was analyzed as in (a). Analysis using the MAT confirmed that reduced insulin/IGF-1 signaling (IIS) slows age-associated motility decline.dAM140 worms expressing the aggregative polyQ35-YFP fusion protein were grown to days 2, 5, and 8 of adulthood on either control EV ordaf-2RNAi bacteria, and speed was scored as in (a). Note that x-axis is drawn to scale with panelc. Speed declines as worms age and proteotoxicity progresses, but reduced IIS slows motility decline. Error bars denote SEM of three biological repeats for panel a and four biological repeats for panelscandd. Each biological repeat consists of 2–3 replicate plates with dozens of worms per plate. Detailed data points are provided in Additional file 13: Table S1.*P< 0.05; **P< 0.005; ***P< 0.0005
water condensation on the plate lid). Our system reaches approximately 90% detection accuracy (precision and re-call) when tracking around 100 worms simultaneously (Fig. 2 and Additional file 7: Figure S2). Furthermore, high-throughput studies that track multiple animals at a time pose an additional challenge – the greater the number of animals tracked, the higher the chances that they will collide, therefore precluding the possi-bility to track individuals over long time periods. However, implementing the predictor in our system significantly aids in resolving such collision events (Fig. 2c and Additional file 7: Figure S2).
Machine learning approaches had been previously ap-plied to tracking single worms (for example, see [38, 39]). Our approach, however, is slightly different and is particular suitable for tracking multiple animals in long-temporal ex-periments in which noise accumulates over time. We allow the user to first set a fixed thresholding parameter (as part of the training process), and then the user chooses seg-mented entities corresponding to genuine animals. Based on the features of these entities, a classifier is learned and is subsequently used to classify other segmented entities throughout the movie. Indeed, using several clicks on ani-mal entities, the user ‘trains’ the algorithm to tell apart genuine animal entities from possible background noise, thereby significantly reducing erroneously detected animals. Importantly, this learning step typically takes 1 minute, after which the algorithm automatically extracts animal en-tities from thousands of frames. If the same settings are used for subsequent experiments then the same training set can be used for their analyses. Together, the machine learn-ing algorithm and the predictor, the broad possible usage, and the ability to simultaneously track multiple animals over long time periods make this MAT into a unique and powerful system for studying animal behavior.
Various other machine-vision algorithms that support high-throughput tracking of many individual animals simultaneously are also available (i.e., in flies [40]). Simi-larly to our tracker, these systems automatically track large groups of unmarked animals. Furthermore, ma-chine learning methods were developed to support auto-matic behavioral classifiers based on animal trajectories alone, which subsequently infer higher order behavioral outputs such as social and individual behavior [41]. While our tracking system, together with its built-in analytic functions, is primarily geared to studying complex spatial navigation, it can also be used to study other complex behaviors. It will therefore be interesting to combine such machine learning post-acquisition methods to extend the repertoire of complex behaviors to be studied.
Interestingly, our initial experience with the MAT sys-tem already yielded novel insights into the intricate chemotaxis behavior. In a seminal study, Shimomura et
al. [12] demonstrated the critical role of pirouettes (a bout of successive turns) in chemotaxis, where worms entering a pirouette with an off-course angle tend to exit the pirouette better oriented towards the center of the gradient. Our tracking analyses confirmed these results and added an additional important piece to this fascinating strategy – worms that enter the pirouette on-course oriented towards the target tend to maintain this on-course trajectory following the pirouette. Together, these strategies greatly enhance an animal’s navigation abilities, enabling it to reach a target source significantly faster (as we also corrobo-rated through simulations, Fig. 5c).
In addition, we used our MAT system to show that C. elegans animals can integrate environmental cues (Fig. 6). Such integration is an important feature to predict food abundance and quality [13]. Interestingly, we found that this sensory integration is manifested in the directional changes in the pirouette events – animals crawling towards a richer target are more likely to exit the pirouette at an angle that is more directed towards the target (Additional file 12: Figure S4). In our experiment, we used two cues, DA and IAA, sensed primarily by AWA and AWC sensory neurons [42–45]. These two sensory neurons synapse on mutual down-stream interneurons (AIA, AIY) that, along with add-itional inter and command neurons, control worm locomotion [46–48], thus presumably serving the point where sensory information is integrated before dictating locomotion outputs.
We also demonstrated that the MAT system allows the study of aging and proteotoxicity-associated dis-eases. These processes are characterized by gradual locomotion decline, and quantitative accurate mea-surements are required to study this slow progression. Our system accurately captures such minute locomo-tion changes (Fig. 7). Moreover, aging and proteotoxi-city effects widely vary from animal to animal, requiring assaying large population cohorts. The novel MAT system is particularly suitable to this end as it allows accurate tracking of animal locomotion in a high-throughput manner, and can therefore serve as a powerful system for extensive laborious screens of mutants or chemical and RNAi libraries.
Conclusions
Methods The MAT
The software suite, together with its freely-available code, can be downloaded through github (https://github.com/ itskov/MultiAnimalTrackerSuite). The downloaded files also include a detailed user manual (with exemplar ana-lyzed movies) for the installation and use of the different packages in the software.
Machine learning algorithm for the identification of behaving animals
Segmentation and feature selection
To minimize tracking of erroneous objects, we utilized a supervised machine learning approach. Prior to tracking, the GUI prompts the user to mark few samples of genu-ine animal entities (these will form the training set). The GUI presents the user with a frame from the experiment video next to the same frame filtered with the Laplacian of Gaussian (LoG) filter [49, 50]. That is, the image is convolved with a matrix M LoG. In this filter, the stand-ard deviation of the Gaussian, σLoG, is used to control the preferred size of the entities to be highlighted in the image. Thus, the user is presented with a scroll bar with which it can control the size of the σLoG. Basing the filter on the standard deviation of the Gaussian, σLoG, allows the system to mark and track entities drawn from different imaging settings, and/or different model organisms. The chosen σLoG are subsequently used to segment the entities that will be then classi-fied as ‘animals’, or else considered as background, and thus discarded.
Next, the tracker extracts features from the entities se-lected by the user. We designed the tracker to extract the smallest subset of features to enable good perform-ance with a wide range of different model organisms and imaging settings. These features include the area of the entity, and the mean, median, minimum, and maximum of the entity's pixels intensity. While this small set of general features is sufficient to accurately segment ani-mal entities (all the results presented within this paper use these features only), additional features may be in-cluded at the users discretion, which will support further flexibility and efficient segmentation under various cir-cumstances. The open source code can be easily accessed and modified as necessary; the identity of the extracted features is found in the ‘extractFeatures’ method, which is in the tracker object.
The algorithm for calling or rejecting animal entities
Since users choose only ‘positive’ entities, and they are not asked to mark entities which are not animals, a trad-itional machine learning approach (as a linear separator, decision tree, etc.) could not be used. Alternatively, we
found the following described method to be superior to regression-based classification methods:
Denoting m as the number of entities marked by the user, and n as the number of features extracted by the tracker, then S is a matrix of size m × n, for which, for anyi,jentry, the value ofSijis the value of thejth feature of theithmarked entity. We also denoteΣ(of sizen × n) as the covariance matrix of the different features as esti-mated fromS. We measured the distanceDof each sam-ple in the training set,Si, from the estimated distribution of the features in the video, defined by Σ and μS= E(S), using the Mahalanobis Distance [51]:
D Sð Þ ¼i
ffiffiffiffiffiffiffiffiffiffiffiffiffiffiffiffiffiffiffiffiffiffiffiffiffiffiffiffiffiffiffiffiffiffiffiffiffiffiffiffiffiffiffiffiffiffi
Si−μs
ð ÞT⋅X−1⋅ðSi−μsÞ
q
We observed that the distribution of the distances cal-culated as above appeared to be unimodal. Thus, we for-mulated a rejection rule for new entities based on the distribution of the Mahalanobis distances of samples in the training set. Any new entity x, an n × 1 vector, was classified as an‘animal’if it held that,
D xð Þ≤Tð Þβ
Where T(β) is the value of the Mahalanobis dis-tance, which is larger than (1 – β) ×m samples in the training set. Throughout all our experiments, we set
β to be 0.96; however, this value can be easily ad-justed to control type I and type II errors in the classification.
Tracking algorithm
We used a simple tracking algorithm which matches spatially closest entities between consecutive frames (the only entities considered are entities that were labeled as animals in the previous step). We incorporated a simple variation of the Kalman filter [24] to predict the position of animals that are obscured by other entities as, for ex-ample, in the case of collisions or in ambiguity in matching entities between consecutive frames. Prior to matching an active track to a new entity found in a new frame, the tracker calculates the track's predicted pos-ition based on the animal's recent velocities and acceler-ations. In case the tracker fails to match a single entity to an active track, it will match the track to its predicted position. The tracker will maintain tracking when the animal reappears, or will discard its prediction if no ani-mal entity was found to match the track during the three subsequent frames.
Evaluating tracker accuracy
We performed several analyses to evaluate tracker accur-acy. First, we generated a‘gold standard’set of approxi-mately 500 worms that were manually identified and marked. Using this training set (which reflects the
presumably optimal human-eye tracker), we could estimate the precision of our segmentation and worm identification process. Specifically, we calculated three well-known parameters in the field of object identifica-tion, namely Precision, Recall and Fscore, all as a func-tion of different training sizes. These parameters, provided in Fig. 2b, are defined as follows:
(I) Precision: out of X entities classified as worms by
the software, how many were actual worms? Based on the machine learning algorithm alone, we find this measure to reach nearly 90% accuracy. In practice, the prediction feature adds on top of this to gain over 90% precision.
(II) Recall: out of all worms genuinely found on the
plate (based on the‘gold standard’set), how many
are indeed classified by the tracker as worms?
Figure2bshows that the tracker reaches over 85%
accuracy even when using only 50 worms for the training set.
(III) Fscore is the harmonic average of the two parameters (Precision and Recall).
In addition, we assessed the tracker performance when disabling the machine learning and the Kalman-type predictor. We find that enabling these features signifi-cantly improves animal segmentation and tracking (Fig. 2c and Additional file 6: Figure S1 and Additional file 7: Figure S2). In particular, these features are import-ant even when analyzing movies that initially seem to be ‘easy-to-analyze’with high contrast between animals and background (see analyses in Additional file 7: Figure S2 and Additional file 8: Movie S5, Additional file 9: Movie S6, Additional file 10: Movie S7).
Evaluating worm resolution following collisions To estimate the precision by which our system correctly re-solves worms after collision, we have taken a similar ap-proach as described above to evaluate tracker accuracy. We first defined collisions as events in which worms have come to a close proximity (less than 15 pixels which correspond to approximately 0.4 mm in our setup), and manually matched worm identity before and after the collision event. This is to be used as our ‘gold standard’ measure. We then ran our tracker in two modes, with and without the predictor. The results of the accuracy of predicting the correct tracks following collisions are summarized in Additional file 6: Figure S1b. As evident, applying the predictor significantly improved detection of worms after collision as only approximately 2% of the cases were not resolved (Resolved 0), whereas without implementing our predictor, 46% of the collisions were not resolved. Furthermore, in 44% of the collision cases, one worm was correctly resolved (as opposed to
16% without the predictor) and in 55% of the cases both worms were correctly resolved (as opposed to 38% with-out the predictor).
Chemotaxis assays To get a large synchronized popula-tion of young adult animals (N2, WT strain), we bleached gravid worms and plated approximately 1000 eggs on a 90-mm standard NGM plate pre-seeded with 500 μL E. coliOP 50 culture. These worms were assayed 3 days later when they reached young adulthood (YA). Before the ex-periment, the YA worms were rinsed off the growth plates and washed three times in chemotaxis buffer (1 mM CaCl2, 1 mM MgSO4, 5 mM K3O4P, pH 6.0). Chemotaxis assays were performed on Chemotaxis plates, which in-clude the same ingredients as the chemotaxis buffer with the addition of 2% agar. Importantly, worms were grown at 20 °C and behavioral assays were also performed in a temperature-controlled room at 20 °C.
We marked an equilateral triangle on the plate’s lid (90-mm round plates) with an edge length of 3 cm. We used agar chunks soaked (15μL) with the chemoattrac-tants of choice and placed them on two of the triangle vertices (Fig. 3a). On the third vertex, we placed a 5-μL Chemotaxis Buffer drop of washed worms (we first esti-mated worms’concentration in the pellet following the last wash to plate a desired number of worms). Chemo-taxis assays were then imaged using a Photometrics Micropublisher 5 MB camera, using Olympus SZ61 bin-ocular equipped with a 0.5× lens. To acquire movies we used our own in-house imaging software that is freely available with this MAT and which uses MATLAB’s image acquisition toolbox. Movies were acquired at a rate of one frame per second.
Calculating worms’ directness in relation to the chemoattractant target We quantified worm’s direct-ness towards the chemoattractant at timetby obtaining the projection of the worm’s velocity (v(t)) on the vector that connects the worm and the chemoattractant (d(t), normalized). That is, for each step of each worm, we cal-culated the following dot product:
proj tð Þ ¼<v tð Þ;d tð Þ> d tð Þ
j j
In the integration experiments we used only projec-tions of the worms that were on their way towards the chemoattractant for the first time (and ignored revisiting worms).
worm’s velocity vector and the spatial vector between the worm’s position and the peak of the chemoattractant. We used BBeforeand BAfteras the bearing immediately be-fore and immediately after a pirouette event, respectively, andΔB as BBefore–BAfter.
We defined sharp turns as succeeding movement vec-tors with an angle of > 100° between them, and used the definition suggested by Shimomura et al. [12] for a pirouette, which is a bout of sharp turns. Following the observation that run distribution can be described by the sum of two exponents [12], we chose the minimal size of a pirouette to be Tcrit= 5 sec. Any run shorter than this will be considered to be a component of a pirouette. We defined Bbefore as the average bearing for three consecutive steps prior to the pirouette, and simi-larly we defined Bafterto be the average bearing of three consecutive steps after the pirouette.
Integration of environmental cues We first looked for two chemoattractants that attract the worm in the same manner. To do so, we performed an array of chemotaxis experiments with varying chemicals and concentrations and examined motility parameters such as chemotaxis index dynamics, probability for a pirouette, and lengths of runs, etc. We chose two chemoattractants that showed the same effect on the worm’s chemotaxis: 0.75 × 10⁻⁵ DA, and 0.5 × 10⁻⁴IAA. We then created a mixture of the two chemicals such that each chemical was diluted twice in the final solution, and performed the chemotaxis assay with it. We compared chemotaxis dynamics, directness, and bearing between the single chemoattractant experiments and the mixture.
Chemotaxis simulations To study the significance of directional changes following a pirouette in light of our findings, we simulated worm courses towards an attract-ant using three different reorientation strategies, namely (1) choosing the directional change (ΔB) uniformly be-tween–180° and +180°; (2) uniformly sampling from the directional changes observed in our experiments regard-less of the specific angle in which the worm entered the pirouette; and (3) we first divided the directional changes observed in our experiments into two groups– one group contained directional changes made by worms which were initially directed towards the target (–90° < BBefore< +90°), and the other contained direc-tional changes made by off-course worms (+90° < BBefore < 270°). We next chose the directional change based on the angle of the‘simulated worm’just prior to the pirou-ette (e.g., if the worm was initially directed towards the target then the directional change was sampled from the directional change group of the directed worms). Inter-estingly, worms simulated using the third strategy
reached their target significantly faster than if simulated using the first two strategies (Fig. 5c).
For these simulations, we used a simple model consider-ing a minimal number of parameters, namely worm start point, chemoattractant position (target point), and prob-abilities for a pirouette of directed and undirected worms. The first two parameters, the start and target coordinates, were extracted directly from the chemotaxis experiments. The probability for a pirouette of directed worms was set to 0.03 per second, reflecting two pirouettes per minute, and the probability for a pirouette of undirected worms was set to be five times more probable (0.15). All the an-gular differences before and after a pirouette were directly drawn from our experimental data based on directed and undirected worm behavior. For this, we extracted from the experimental data all pirouette instances and calcu-lated angular differences before and after a pirouette and constructed a distribution curve. For simulations, we drew angular angle differences based on these distributions. Im-portantly, the simulation results were not sensitive to small changes in the parameters set.
Aging- and neurodegenerative-associated locomotion decline
To study aging- and neurodegenerative-associated loco-motion decline we prepared animals as described for the chemotaxis assays above. Briefly, for aging assays, we employed temperature-sensitive sterile worms (strain CF512) that become sterile when exposed to 25 °C dur-ing development. We synchronized animals by bleachdur-ing gravid animals and performed the motility assays on days 1, 4, 8, and 12 of adulthood. For thedaf-2RNAi ex-periments we used empty vector as control, and age-synchronized worm locomotion was measured at days 1, 6, and 12 of adulthood.
To assay locomotion in neurodegenerative-associated disease we used the AM140 strain. These worms express the aggregative peptide composed of 35 repeats of glu-tamine fused to the yellow fluorescent protein in the body wall muscles [37]. Motility was assayed at days 2, 5, and 8 of adulthood. In all these assays, the repellent 2-nonanone was added to stimulate motility. We started measuring worm locomotion 2 minutes after the addition of 2-nonanone for the duration of 1 minute.
Additional files
Additional file 1:The Zaslaver’s lab Multi-Animal Tracker (MAT) - a user manual.
(PDF 863 kb)
Additional file 2: Movie S1.The Multi-Animal Tracker can track > 100 worms at a time. (AVI 62803 kb)
Additional file 3: Movie S2.The Multi-Animal Tracker can track multiple flies at a time. (MP4 11655 kb)
Additional file 4: Movie S3.The Multi-Animal Tracker can track multiple zebrafish at a time. (MP4 39896 kb)
Additional file 5: Movie S4.The Multi-Animal Tracker can track multiple mice at a time. The machine learning algorithm, together with the Kalman predictor, filter out possible noise, such as user intervention, during the experiment. (MP4 18744kb)
Additional file 6: Figure S1.The tracker implements a machine learning algorithm and a predictor that contribute to accurate detection and precise tracking following collision. (a) In a typical long behavioral assay, condensation on the lid and trail marks left behind significantly contribute to entities discovered by the tracker. The number of these entities increases with time (red curve), but since the tracker employs a machine learning algorithm for animal identification, it ignores these erroneously detected entities, and the number of genuine animal entities remains constant throughout the experiment (blue curve). (b) The software implements a predictor that aids resolving animals following collisions. The colors/numbers correspond to the number of animals resolved following collision of two animals: 2–both animals resolved; 1–only one animal resolved; 0–none. (c) An example of six fully-extracted tracks of six individual worms during 10 minutes of tracking. Overall, approximately 100 worms were loaded on the plate, and the tracker software can often keep track of individual animals despite frequent collisions. (TIF 1660 kb) Additional file 7: Figure S2.Employing both the machine learning (ML) algorithm and the Kalman-type predictor significantly improves accurate animal detection and tracking. This is true even when analyzing a fairly easy movie with clear contrast between animals and background. We analyzed a crowded arena of swimming zebrafish in three different ways: (a) disabling both ML segmentation and the predictor; (b) applying ML segmentation but disabling the predictor; and (c) applying both ML segmentation and the predictor in the segmentation and tracking algorithm. To provide a quantitative measure for the advantage using both the ML and the predictor we calculated tracks’length (in seconds) as extracted throughout the movie. Each point (i,j) in the heat map represents the average track length between timei(y-axis) and timej (x-axis). We then identified the segments with the longest tracks in each of these three-way analyses, and averaged them: (a) 0.6 ± 0.02 [s]; (b) 1.15 ± 0.14 [s]; (c) 2.2 ± 0.3 [s]. Thus, employing both the ML and the predictor improves track length by more than three-fold. The movies corresponding to these three-way analyses are provided as Additional file 8: Movie S5, Additional file 9: Movie S6, and Additional file 10: Movie S7, corresponding to (a), (b), and (c), respectively. Note, in Additional file 8: Movie S5 (neither ML nor predictor), the many background entities that are being tracked and the tiny insect that was crawling on the left, which would have been part of the statistics unless ML was used. (TIF 979 kb)
Additional file 8: Movie S5.An exemplary movie extracting tracks of swimming zebrafish that does not implement neither the machine learning (ML) algorithms nor the Kalman predictor. Without using these features, trajectory extraction is poor despite the fact that animals are easily detected due to a high contrast with the background. (MP4 39899 kb) Additional file 9: Movie S6.An exemplary movie extracting tracks of swimming zebrafish analyzed by implementing ML algorithms only (the Kalman predictor is not used in these analyses). While segmentation and trajectory extraction is improved when compared to analyses that use neither of them, the results still fall short if compared to analyses that use both (the ML and Kalman predictor). (MP4 33474 kb)
Additional file 10: Movie S7.An exemplary movie extracting tracks of swimming zebrafish analyzed by implementing both ML algorithms and the Kalman predictor. Using both features significantly improves segmentation and trajectory extraction. (MP4 35674 kb)
Additional file 11: Figure S3.Various chemotaxis parameters are dose dependent. Histograms of (a) probability for a pirouette, (b) probability for reversal/sharp-turn, (c) run lengths (time between reversals). (TIF 670 kb)
Additional file 12: Figure S4.Worms integrate environmental cues and enhance chemotaxis towards richer environments. When presented with a mixture of cues (c,d), worms are more likely to maintain their general direction following a pirouette (ΔB <Π/2), as compared to worms presented with each of the components separately (a,b,d;P< 0.005).
We could not detect a significant increase in the probability for a larger directional change for worms that were presented with a mixture, compared to worms that were presented with single components of the mixture (P> 0.2). (TIF 943 kb)
Additional file 13: Table S1.The raw data of the individual replicates used to produce Fig. 7a, c, d. (XLSX 208 kb)
Acknowledgements
We thank Gil Lefkowitz and Michael Gliksberg for providing movies of swimming zebrafish, Sebastian Kadener and Daniella Apelblat for the fly movies, and Ami Citri and Bogna Ignatowska for the mice movies. We thank Yossi Gruenbaum, Guy Bloch, Sagiv Shifman, Ami Citri, Dana Rubinstein, Rotem Ruach, Aharon Azulay, Aharon Wayne, and the rest of our lab for critical comments.
Funding
ERC starting grant (#336803), the American Federation for Aging Research (AFAR), and the Joseph H. and Belle R. Braun funds with which AZ is a Senior Lecturer chair.
Availability of data and material
The software suite together with its freely-available code can be downloaded through github (https://github.com/itskov/MultiAnimalTrackerSuite) as well as through our website (www.zaslaverlab.com). The downloaded files also include a detailed user manual (with exemplar analyzed movies) for installing and using the different packages in the software. Additional file 12: Table S1 provides raw values for Fig. 7a, c, and d.
Authors’contributions
AZ and EI conceived the study. EI developed and implemented the software with AZ guidance. EI performed all the experiments (guided by AZ) except for the aging-associated motility assays that were performed by AL (guided by EC). AZ and EI wrote the paper with input from EC and AL. All authors read and approved the final manuscript.
Competing interests
The authors declare that they have no competing interests.
Consent for publication
Not applicable.
Ethics approval and consent to participate
Not applicable.
Publisher’s Note
Springer Nature remains neutral with regard to jurisdictional claims in published maps and institutional affiliations.
Author details
1Department of Genetics, The Silberman Institute of Life Science, Edmond J.
Safra Campus, The Hebrew University of Jerusalem, Jerusalem 91904, Israel.
2School of Computer Science and Engineering, Hebrew University, Jerusalem,
Israel.3Biochemistry and Molecular Biology, The Institute for Medical
Research Israel–Canada (IMRIC), School of Medicine, The Hebrew University of Jerusalem, Jerusalem 91120, Israel.
Received: 9 February 2017 Accepted: 6 March 2017
References
1. Tinbergen N. On aims and methods of Ethology. Anim Biol. 2005;55(4):297–321. 2. Anderson DJ, Perona P. Toward a science of computational ethology.
Neuron. 2014;84(1):18–31.
3. Brenner S. The genetics of Caenorhabditis elegans. Genetics. 1974;77(1):71–94. 4. White JG, Southgate E, Thomson JN, Brenner S. The structure of the nervous
system of the nematode Caenorhabditis elegans. Philos Trans R Soc Lond B Biol Sci. 1986;314(1165):1–340.
6. Flavell SW, Pokala N, Macosko EZ, Albrecht DR, Larsch J, Bargmann CI. Serotonin and the neuropeptide PDF initiate and extend opposing behavioral states in C. elegans. Cell. 2013;154(5):1023–35.
7. Raizen DM, Zimmerman JE, Maycock MH, Ta UD, You YJ, Sundaram MV, Pack AI. Lethargus is a Caenorhabditis elegans sleep-like state. Nature. 2008;451(7178):569–72.
8. Mori I. Genetics of chemotaxis and thermotaxis in the nematode Caenorhabditis elegans. Annu Rev Genet. 1999;33:399–422.
9. Vidal-Gadea A, Ward K, Beron C, Ghorashian N, Gokce S, Russell J, Truong N, Parikh A, Gadea O, Ben-Yakar A, et al. Magnetosensitive neurons mediate geomagnetic orientation in Caenorhabditis elegans. Elife. 2015;4. doi:10.7554/ eLife.07493.
10. Bargmann CI, Horvitz HR. Chemosensory neurons with overlapping functions direct chemotaxis to multiple chemicals in C. elegans. Neuron. 1991;7(5):729–42.
11. Bargmann CI. Chemosensation in C. elegans. WormBook. The C. elegans Research Community. 2006. doi:10.1895/wormbook.1.7.1.
12. Pierce-Shimomura JT, Morse TM, Lockery SR. The fundamental role of pirouettes in Caenorhabditis elegans chemotaxis. J Neurosci. 1999;19(21):9557–69.
13. de Bono M, Maricq AV. Neuronal substrates of complex behaviors in C. elegans. Annu Rev Neurosci. 2005;28:451–501.
14. Sengupta P, Samuel AD. Caenorhabditis elegans: a model system for systems neuroscience. Curr Opin Neurobiol. 2009;19(6):637–43. 15. Carvalhal Marques F, Volovik Y, Cohen E. The roles of cellular and
organismal aging in the development of late-onset maladies. Annu Rev Pathol. 2015;10:1–23.
16. Cronin CJ, Feng Z, Schafer WR. Automated imaging of C. elegans behavior. Methods Mol Biol. 2006;351:241–51.
17. Husson SJ, Costa WS, Schmitt C, Gottschalk A. Keeping track of worm trackers. WormBook. 2012. The C. elegans Research Community. doi:10.1895/ wormbook.1.7.1.
18. Baek JH, Cosman P, Feng Z, Silver J, Schafer WR. Using machine vision to analyze and classify Caenorhabditis elegans behavioral phenotypes quantitatively. J Neurosci Methods. 2002;118(1):9–21.
19. Yemini E, Jucikas T, Grundy LJ, Brown AE, Schafer WR. A database of Caenorhabditis elegans behavioral phenotypes. Nat Methods. 2013;10(9):877–9.
20. Ramot D, Johnson BE, Berry Jr TL, Carnell L, Goodman MB. The Parallel Worm Tracker: a platform for measuring average speed and drug-induced paralysis in nematodes. PLoS One. 2008;3(5):e2208.
21. Swierczek NA, Giles AC, Rankin CH, Kerr RA. High-throughput behavioral analysis in C. elegans. Nat Methods. 2011;8(7):592–8.
22. Yemini E, Kerr RA, Schafer WR. Tracking movement behavior of multiple worms on food. Cold Spring Harb Protoc. 2011;2011(12):1483–7.
23. Ma DK, Vozdek R, Bhatla N, Horvitz HR. CYSL-1 interacts with the O2-sensing hydroxylase EGL-9 to promote H2S-modulated hypoxia-induced behavioral plasticity in C. elegans. Neuron. 2012;73(5):925–40.
24. Salmond D. Target tracking: introduction and Kalman tracking filters. In: IEEE International Seminar Target Tracking: Algorithms and Applications. Stevenage: IET; 2001. p. 1–16.
25. Gomez-Marin A, Stephens GJ, Louis M. Active sampling and decision making in Drosophila chemotaxis. Nat Commun. 2011;2:441.
26. Pierce-Shimomura JT, Dores M, Lockery SR. Analysis of the effects of turning bias on chemotaxis in C. elegans. J Exp Biol. 2005;208(Pt 24):4727–33. 27. Iino Y, Yoshida K. Parallel use of two behavioral mechanisms for chemotaxis
in Caenorhabditis elegans. J Neurosci. 2009;29(17):5370–80.
28. Stein BE. The New Handbook of Multisensory Processes. Cambridge: MIT Press; 2012.
29. Fetsch CR, DeAngelis GC, Angelaki DE. Bridging the gap between theories of sensory cue integration and the physiology of multisensory neurons. Nat Rev Neurosci. 2013;14(6):429–42.
30. Duistermars BJ, Frye MA. Multisensory integration for odor tracking by flying Drosophila: Behavior, circuits and speculation. Commun Integr Biol. 2010;3(1):60–3.
31. Dubnikov T, Cohen E. Proteostasis collapse, inter-tissue communication, and the regulation of aging at the organismal level. Front Genet. 2015;6:80. 32. Herndon LA, Schmeissner PJ, Dudaronek JM, Brown PA, Listner KM, Sakano Y, Paupard MC, Hall DH, Driscoll M. Stochastic and genetic factors influence tissue-specific decline in ageing C. elegans. Nature. 2002;419(6909):808–14.
33. Stroustrup N, Anthony WE, Nash ZM, Gowda V, Gomez A, Lopez-Moyado IF, Apfeld J, Fontana W. The temporal scaling of Caenorhabditis elegans ageing. Nature. 2016;530(7588):103–7.
34. Kenyon CJ. The genetics of ageing. Nature. 2010;464(7288):504–12. 35. Cohen E, Bieschke J, Perciavalle RM, Kelly JW, Dillin A. Opposing activities
protect against age-onset proteotoxicity. Science. 2006;313(5793):1604–10. 36. Lithgow GJ, White TM, Melov S, Johnson TE. Thermotolerance and
extended life-span conferred by single-gene mutations and induced by thermal stress. Proc Natl Acad Sci U S A. 1995;92(16):7540–4. 37. Morley JF, Brignull HR, Weyers JJ, Morimoto RI. The threshold for
polyglutamine-expansion protein aggregation and cellular toxicity is dynamic and influenced by aging in Caenorhabditis elegans. Proc Natl Acad Sci U S A. 2002;99(16):10417–22.
38. Sznitman R, Gupta M, Hager GD, Arratia PE, Sznitman J. Multi-environment model estimation for motility analysis of Caenorhabditis elegans. PLoS One. 2010;5(7):e11631.
39. Greenblum A, Sznitman R, Fua P, Arratia PE, Sznitman J. Caenorhabditis elegans segmentation using texture-based models for motility phenotyping. IEEE Trans Biomed Eng. 2014;61(8):2278–89.
40. Branson K, Robie AA, Bender J, Perona P, Dickinson MH. High-throughput ethomics in large groups of Drosophila. Nat Methods. 2009;6(6):451–7. 41. Kabra M, Robie AA, Rivera-Alba M, Branson S, Branson K. JAABA: interactive
machine learning for automatic annotation of animal behavior. Nat Methods. 2013;10(1):64–7.
42. Bargmann CI, Hartwieg E, Horvitz HR. Odorant-selective genes and neurons mediate olfaction in C. elegans. Cell. 1993;74(3):515–27.
43. Chalasani SH, Chronis N, Tsunozaki M, Gray JM, Ramot D, Goodman MB, Bargmann CI. Dissecting a circuit for olfactory behaviour in Caenorhabditis elegans. Nature. 2007;450(7166):63–70.
44. Sengupta P, Chou JH, Bargmann CI. odr-10 encodes a seven transmembrane domain olfactory receptor required for responses to the odorant diacetyl. Cell. 1996;84(6):899–909.
45. Zaslaver A, Liani I, Shtangel O, Ginzburg S, Yee L, Sternberg PW. Hierarchical sparse coding in the sensory system of Caenorhabditis elegans. Proc Natl Acad Sci U S A. 2015;112(4):1185–9.
46. Gray JM, Hill JJ, Bargmann CI. A circuit for navigation in Caenorhabditis elegans. Proc Natl Acad Sci U S A. 2005;102(9):3184–91.
47. Piggott BJ, Liu J, Feng Z, Wescott SA, Xu XZ. The neural circuits and synaptic mechanisms underlying motor initiation in C. elegans. Cell. 2011;147(4):922–33.
48. Kocabas A, Shen CH, Guo ZV, Ramanathan S. Controlling interneuron activity in Caenorhabditis elegans to evoke chemotactic behaviour. Nature. 2012;490(7419):273–7.
49. Haralick R, Shapiro L. Computer and Robot Vision, vol. 1. Boston: Addison-Wesley Publishing Company; 1992.
50. Horn B. Robot Vision. Cambridge: MIT Press; 1986.
51. Anderson TW. Introduction to Multivariate Statistical Analysis. Hoboken: Wiley; 1958.
• We accept pre-submission inquiries
• Our selector tool helps you to find the most relevant journal • We provide round the clock customer support
• Convenient online submission • Thorough peer review
• Inclusion in PubMed and all major indexing services • Maximum visibility for your research
Submit your manuscript at www.biomedcentral.com/submit