Biological Procedures Online • Vol. 5 No. 1 • March 4, 2003 • www.biologicalprocedures.com
© 2003. Biological Procedures Online. Published in Biological Procedures Online under license from the author(s). Copying, printing, redistribution and storage permitted.
Biol. Proced. Online 2003;5(1): 63-68.
Evaluation of intra- and interspecific divergence of satellite DNA sequences by
nucleotide frequency calculation and pairwise sequence comparison
Mikio Kato
11Department of Life Sciences, Osaka Prefecture University, 1-1 Gakuencho, Sakai 599-8531, Japan.
*To whom correspondence should be addressed: Tel & Fax: +81 72 254 9746; Email: mkato@el.cias.osakafu-u.ac.jp Submitted: December 6, 2002; Revised: January 19, 2003; Accepted: February 6, 2003; Published: March 4, 2003 Indexing terms: DNA, satellite; evolution, molecular; phylogeny.
ABSTRACT
Satellite DNA sequences are known to be highly variable and to have been subjected to concerted evolution that homogenizes member sequences within species. We have analyzed the mode of evolution of satellite DNA sequences in four fishes from the genus Diplodus by calculating the nucleotide frequency of the sequence array and the phylogenetic distances between member sequences. Calculation of nucleotide frequency and pairwise sequence comparison enabled us to characterize the divergence among member sequences in this satellite DNA family. The results suggest that the evolutionary rate of satellite DNA in D. bellottii is about two-fold greater than the average of the other three fishes, and that the sequence homogenization event occurred in D. puntazzo more recently than in the others. The procedures described here are effective to characterize mode of evolution of satellite DNA.
Introduction
Tandem arrayed repetitive DNA sequences, known as satellite DNA, commonly exist in the centromeric regions of vertebrate chromosomes. Satellite DNA has evolved through the changes in copy numbers and nucleotide sequences (1 for review). Although some centromeric satellite DNA is known to participate in the construction of functional centromeres (2-6), their nucleotide sequences are highly variable. Because of their higher sequence diversity among closely related species, satellite DNA sequences are often utilized for phylogenetic and taxonomic analyses (7-11). Garrido-Ramos et al. (10) determined the nucleotide sequences of centromeric satellite members from Sparidae fishes and showed that at least two monophyletic groups exist within the family. To accomplish this, they reconstructed the phylogeny of Sparidae by comparing the consensus satellite DNA sequences of the respective species. They took this approach because the genetic
distances between repeat units in the same species were smaller than the distances between repeat units in different species. The mode of evolutionary alteration of satellite DNA sequences may vary among different species, however. Thus, in some instances the “consensus sequence” may not be most representative of member sequences. In addition, although the results of Garrido-Ramos et al. (10) suggested the evolutionary rate difference among the species, quantitative analysis on the evolutionary rate was yet unperformed.
The intraspecific sequence divergence in members of a satellite DNA family is likely to be affected by two factors: the evolutionary rate and the amount of time since the latest sequence homogenization event. Within the species, satellite DNA exhibits internal sequence variability depending on a ratio between the mutation and homogenization/fixation (12). In the present work, the interspecific phylogenetic distances and intraspecific sequence variation in Sparidae satellite DNA were re-examined to obtain more precise information about the mode of evolution of satellite DNA. We estimated the relative evolutionary rate of each species and evaluated the differences in the time after the latest event in concerted evolution.
Comparison and alignment of monomer satellite
sequences
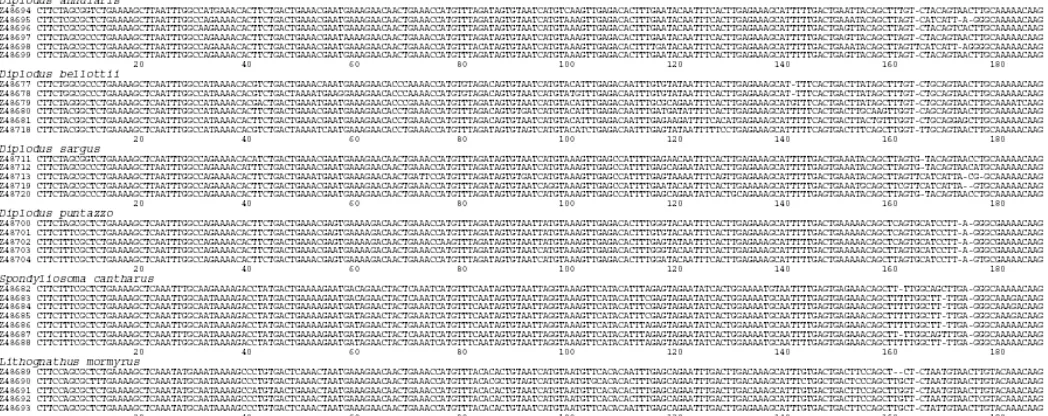
Fig. 1: Alignment of nucleotide sequences of Sparidae satellite DNA monomeric units. Dashes (-) indicate the sites of gaps. Nucleotide position 1 is located at the C residue of the HindIII restriction site. Sequence origins and accession numbers are given at the left.
(insertions and deletions), and there is insufficient homology among the DNA sequences to align interspecific members. Kato (14) proposed a monomer register in satellite DNA, obtained by examining the subrepeat organization, and the gaps appear to exist at the junctions of the registered monomers (Fig. 2).
Fig. 2: Subrepeat alignment of Percoidei satellite monomeric units. A satellite DNA member from Diplodus annularis (Z48694) exemplifies the subrepeat organization. The satellite DNA monomers are each divided into two subregions, and the potential subrepeats are aligned. The hot spot for insertion/deletion is underlined and highly variable sites (SI(k)<0.8; see Fig. 3) are double-underlined. The monomeric unit of current Sparidae satellite DNA consists of the eight subrepeats in the order EFFFFEEF as noted previously (14).
Amplification of unit length monomers might have introduced species-specific differences into this region, probably via a process of recombination, and it seems reasonable to hypothesize that the amplification, combined with the changing satellite DNA sequences, causes speciation. In that context, the species-specific regions were excluded and the regions spanning positions 1 to 159 and 177 to 187 were used for the phylogenetic analysis described below (total of 170 positions).
Sequence variation within the species
Intraspecific sequence variations were evaluated using the measure SI(k) defined as follows;
SI(k)=Σnik2 [1]
i
and SIGM, which is defined as follows;
SIGM = exp [Σ ln{SI(k)}/N] [2]
k
where nik is the relative frequency of nucleotide i (i =A, C, G, or T) at position k of the aligned sequence, N is the number of entire positions (N=170 in the present work)and SIGM is the geometric mean of SI(k) for N positions. SIGM
can be written as a function of time t (see Appendix),
SIGM =[1+3 exp(-8λt/3)]/4 [3]
where λ is the average rate of substitution per site per evolutionary time unit, and t is the time after sequence homogenization (concerted evolution). Table 1 summarizes the SIGM scores for the respective species, and Fig. 3 shows
the distribution of mean SI(k) scores for six Sparidae fishes.
Table 1: Intraspecific variation of satellite DNA
SIGM λfrom SIt calculated GM
intraspecific average of J-Cd
D. annularis 0.972 0.0143 0.0301
D. bellottii 0.897 0.0554 0.1051
D. sargus 0.942 0.0302 0.0602
D. puntazzo 0.978 0.0112 0.0221
S. cantharus 0.979 0.0106 0.0194
Kato 65
Fig. 3: Distribution of SI(k) scores in satellite DNA. The geometric means of six Sparidae fishes are calculated for each position and plotted against the nucleotide sequence.
The variable sites are clustered at the edge of subregion E and within subregion F, but rarely occur in the middle of subregion E (see Fig. 2). This may mean that subregion E conforms to a particular structural domain crucial to the functionality of satellite DNA. Warburton et al. (15) showed that the size of the recombination window within which sequence similarity is conserved is about 20 bp. Subregion E of the Sparidae satellite DNA may thus serve as a window for recombination with respect to sequence homogenization.
The average number of substitutions per site after sequence homogenization was estimated by calculating λt from the observed SIGM scores (Table 1). The λt score is a product of the
evolutionary rate and the time after the sequence homogenization event. Moreover, evolutionary distance between two DNA sequences can be evaluated using the Jukes-Cantor’s distance (J-Cd), which measures the size of 2λt (where t
is the time after the divergence of two DNA sequences). The distance J-Cd is expressed as the ratio of common nucleotides in
two aligned DNA sequences (q), and q can be written as follows (16, 17); note that the right side of equation [5] has the same form as equation [3].
J-Cd = 2λt = -3[ln{(-1+4q)/3}]/4 [4]
q =[1+3 exp(-8λt/3)]/4. [5]
The J-Cd scores were calculated for every pair of member
sequences using the program Dnadist included in PHYLIP ver. 3.5c(18); the average scores of the interspecific distances are listed in Table 2, and the intraspecific averages of J-Cd are listed
in Table 1. The estimates of λt obtained using the two procedures are in good agreement (Fig. 4), which suggests that nucleotide frequency calculation is an effective way to describe intraspecific divergence within a satellite DNA family.
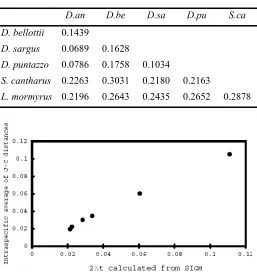
Table 2: Average scores of interspecific distances(J-Cd)
D.an D.be D.sa D.pu S.ca
D. bellottii 0.1439
D. sargus 0.0689 0.1628
D. puntazzo 0.0786 0.1758 0.1034
S. cantharus 0.2263 0.3031 0.2180 0.2163
L. mormyrus 0.2196 0.2643 0.2435 0.2652 0.2878
Fig. 4: Comparison of 2λt scores obtained using two different protocols. The 2λt scores calculated for six Sparidae fishes by pairwise sequence comparison (J-Cd, vertical axis) are plotted against those obtained by
nucleotide frequency calculation (SIGM, horizontal axis).
Interspecific and intraspecific relationships
between Sparidae satellite DNA
The evolutionary distances between two populations (interspecific divergence) can be estimated by calculating nucleotide frequency differences as described (11). It will be underestimated, however, if there is any instance of sequence homogenization at the monomeric level of the satellite DNA in the lineage. Moreover, the magnitude of the error will depend on the length of time after the sequence homogenization occurred. In the case of primate alpha-satellite DNA, the sequence homogenization events occurred at the level of higher order repeats (HORs) and not at the monomeric level. Thus the nucleotide frequency calculation within respective HORs has been successfully used to define the distances between satellite arrays and to reconstruct the phylogenetic relationships of the HORs (11). On the other hand, because sequence homogenization events may have occurred at the monomeric level in Sparidae satellite DNA, the interspecific distances between satellite DNA members should be evaluated by pairwise sequence comparison. We have used two distance measures, J-Cd (16) and Kimura’s
Sparidae fishes reconstructed using the interspecific average of
J-Cd scores.
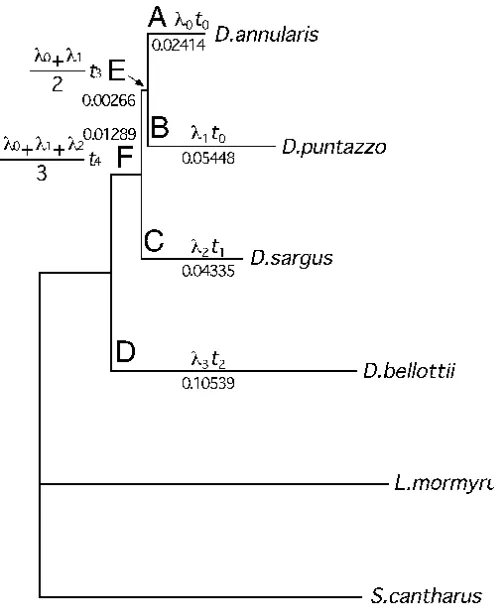
Fig. 5: Unrooted Fitch-Margoliash tree for six Sparidae fishes. The branch lengths and tree topology were computed using the program "Fitch" (18) according to the method of Fitch and Margoliash (22). Distance matrix of average J-Cd scores (Table 2) is used to reconstruct the tree. The tree was
drawn using the program "TreeView PPC" (23). Formulas yielding the branch lengths and the calculated branch length scores are shown for the respective branches.
The phylogenetic trees drawn from the two distance matrices ( J-Cd and the distance measure based on Kimura’s two parameters
model) were identical (data not shown). We found that the order of branching within the Diplodus cluster differed from that described by Garrido-Ramos et al. (10): we observed the closest relative of Diplodus annularis to be D. puntazzo, not D. sargus. In their work, a neighbor-joining tree indicated the clustering of
D. annularis and D. sargus with lower bootstrapping probability, and a UPGMA tree exhibited the same topology with higher bootstrapping probability. This situation may be caused by differences among the evolutionary rates within the genus Diplodus, and it is suggested that the evolutionary rate of
D. puntazzo is higher than those of D. sargus and D. annularis. In addition, the satellite DNA of D. bellottii has apparently evolved much faster than the others (longest branch in Fig. 5).
Evaluating evolutionary rate differences among
Diplodus
species
The length of the branch connecting the common ancestor of
Diplodus to D. bellottii is much larger than the branches connecting the common ancestor to the other Diplodus
species (Fig. 5). Taken together with the data in Table 1, this finding indicates that the evolutionary change in the nucleotide sequence occurred more frequently in D. bellottii
than in the others. Because the length of each branch in the phylogenetic tree represents a λt score and because the time after the bifurcation should be same in each case, the relative evolutionary rates of the different lineages can be estimated from the branch length. Assuming that the evolutionary rate of a common ancestor is the average of those of the descendants, the branch lengths of A to F in Fig. 5 can be written as follows;
A=λ0t0 [6]
B=λ1t0 [7]
C=λ2t1 [8]
D=λ3t2 [9]
E=(λ0+λ1) t3/2 [10]
F=(λ0+λ1+λ2)t4/3 [11]
where λn denotes the evolutionary rate of each lineage, and it is assumed that t2=t4+t1=t4+t3+t0. [12]
The branch lengths were calculated from the J-Cd scores
using the program Fitch included in PHYLIP ver. 3.5c (18); the relative values of λ and t are summarized in Table 3. The relative evolutionary rates of satellite DNA were apparently higher in D. bellottii (branch D) and D. puntazzo (branch B) than in other Diplodus species.
Table 3: Relative evolutionary rate and time for each branch.
Branch Relative evolutionary rate Relative time
A 1.00 1.00
B 2.26 1.00
C 1.68 1.07
D 3.14 1.39
E 1.63 0.07
F 1.65 0.32
Kato 67
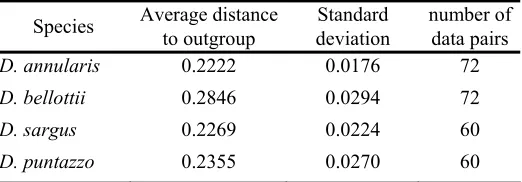
Table 4: Average distance between Diplodus and outgroup species
Species Average distance to outgroup deviation Standard number of data pairs
D. annularis 0.2222 0.0176 72
D. bellottii 0.2846 0.0294 72
D. sargus 0.2269 0.0224 60
D. puntazzo 0.2355 0.0270 60
The data show that D. bellottii has a significantly higher evolutionary rate than the other Diplodus species (p<0.001, two sample t-test with Welch’s correction), and the distance between
D. puntazzo and the outgroups tended to be larger than that between D. sarugus and the outgroups, but not significantly so (p<0.1, two sample t-test with Welch’s correction and Mann-Whitney test), as the differences in average scores were small.
Table 5 shows the relative times after sequence homogenization, which were calculated for Diplodus fishes from the relative evolutionary rates (Table 3) and intraspecific variations (Table 1).
Table 5: Relative evolutionary time after sequence homogenization
Species Relative evolutionary time after sequence homogenization
D .annularis 1.00
D. bellottii 1.11
D. sargus 1.19
D. puntazzo 0.33
The results suggest that sequence homogenization events occurred in D. puntazzo more recently than the other three
Diplodus species. The frequency with which sequence homogenization occurs may vary with fish species, although the trigger is as yet unknown. Elder and Turner (20) showed that sequence homogenization events occur very frequently in pupfish, and the homogenized segments are rapidly fixed in the respective local populations. Charlesworth et al. (21) have theorized that copy number affects the evolutionary rate of a certain family of repetitive DNA. Thus, the different evolutionary rates in Diplodus fishes might reflect differences in satellite copy number.
Conclusion
In the present work, intraspecific similarity of satellite DNA was effectively evaluated by the nucleotide frequency calculation in the populations as well as calculation of distances that estimated the number of substitution per site between two
sequences. Based on the analyses of fish satellite DNA as an example, different evolutionary rate and occurrence of sequence homogenization have been observed. The results obtained here suggested the different mode of evolution of satellite DNA in closely-related species.
Appendix
Given n1, n2, n3, n4 as the relative frequency of four
nucleotides (n1 + n2 + n3 + n4=1) at position k and at time t,
the differential equations describing nucleotide frequency are written as follows;
dn1/dt= n1(1-λ)+(1-n1)λ/3 -n1=λ/3-4λn1/3 [13]
dn2/dt= n2(1-λ)+(1-n2)λ/3 -n2=λ/3-4λn2/3 [14]
dn3/dt= n3(1-λ)+(1-n3)λ/3 -n3=λ/3-4λn3/3 [15]
dn4/dt= n4(1-λ)+(1-n4)λ/3 -n4=λ/3-4λn4/3. [16]
At the time sequence homogenization occurred (t=0), n1 was
1, and n2, n3, and n4 were zero.
Thus, the solutions of the differential equations are as follows,
n1= [1+3 exp(-4λt/3)]/4 [17]
n2= n3= n4= [1- exp(-4λt/3)]/4. [18]
SI(k) can thus be written as
SI(k)=(n1)2+(n2)2+(n3)2+(n4)2=[1+3 exp(-8λt/3)]/4. [19]
REFERENCES
1. Ugarkovic D, Plohl M. Variation in satellite DNA profiles – cause and effects. EMBO J 2002; 21:5955-5959.
2. Willard HF. Chromosome-specific organization of human alpha satellite DNA. Amer J Human Genet 1985 37:524-532.
3. Willard HF. Centromeres of mammalian chromosomes.
Trends Genet 1990;6:410-416.
4. Masumoto H, Masukata H, Muro Y, Nozaki N, Okazaki T. A human centromere antigen (CENP-B) interact with a short specific sequence in alphoid DNA, a human centromeric alphoid. J Cell Biol 1989; 109:1963-1973. 5. Zinkowski RP, Meyne J, Brinkley BR. The
centromere-kinetochore complex: a repeat subunit model. J Cell Biol 1989; 113:1091-1110.
6. Ikeno M, Masumoto H, Okazaki T. Distribution of CENP-B boxes reflected in CREST centromere antigenic sites on long-range α-satellite DNA arrays of human chromosome 21. Human Mol Genet 1994; 3:1245-1257.
human than in the great apes. EMBO J 1992; 11:2367-2372. 8. Franck JPC, Kornfield I, Wright JM. The utility of SATA satellite DNA sequences for inferring phylogenetic relationships among the three major genera of Tilapiine Ciclid fishes. Mol Phylogenet Evol 1994; 3:10-16.
9. Garrido-Ramos MA, Jamilena M, Lozano R, Rejon CR, Rejon MR. The EcoRI centromeric satellite DNA of the Sparidae family (Pisces, Perciformes) contains a sequence motive common to other vertebrate centromeric satellite DNA. Cytogenet Cell Genet 1995; 71:345-351.
10. Garrido-Ramos MA, de la Herran R, Jamilena M, Lozano R, Rejon CR, Rejon MR. Evolution of centromeric satellite DNA and its use in phylogenetic studies of the Sparidae family (Pisces, Perciformes). Mol Phylogenet Evol 1999; 12: 200-204.
11. Kato M, Kato A, Shimizu N. A method for evaluating phylogenetic relationship of α-satellite DNA suprachromosomal family by nucleotide frequency calculation. Mol Phylogenet Evol 1999; 13:329-335.
12. Dover GA. Molecular drive in multigene families: how biological novelties arise, spread and are assimilated.
Trends Genet 1986; 2:159-165.
13. Kato M, Ozeki M, Kikuchi A, Kanbe T. Phylogenetic relationship and mode of evolution of yeast DNA topoisomerase II gene in the pathogenic Candida species.
Gene 2001; 272:275-281.
14. Kato M. Structural bistability of repetitive DNA elements featuring CA/TG dinucleotide steps and mode of evolution of satellite DNA. Eur J Biochem 1999; 265: 204-209.
15. Warburton PE, Waye JS, Willard HF. Nonrandom localization of recombination events in human alpha satellite repeat unit variants: Implications for higher order structural characteristics within centromeric heterochromatin. Mol Cell Biol 1993; 13:6520-6529. 16. Jukes TH, Cantor CR. Evolution of protein molecules.
In Mammalian Protein Metabolism (Munro, H. N. ed.), pp. 21-132. Academic Press, New York, 1969.
17. Nei M. Molecular Evolutionary Genetics. Columbia University Press, New York, 1987.
18. Felsenstein J. PHYLIP (Phylogeny Inference Package) version 3.5c, Distributed by the author, Department of Genetics, University of Washington, Seattle, 1993. 19. Kimura M. A simple method for estimating evolutionary
rates of base substitutions through comparative studies of nucleotide sequences. J Mol Evol 1980;16:111-120. 20. Elder Jr JF, Turner BJ. Concerted evolution at the
population level: pupfish HindIII satellite DNA sequences. Proc Natl Acad Sci USA 1994;91:994-998. 21. Charlesworth B, Sniegowski P, Stephan W. The
evolutionary dynamics of repetitive DNA in eukaryotes.
Nature 1994; 371:215-220.
22. Fitch WM, Margoliash E. Construction of phylogenetic trees. Science 1967; 155:279-284.