ISSN 2324-805X E-ISSN 2324-8068 Published by Redfame Publishing URL: http://jets.redfame.com
Investigation of the Experiment Design Skills of Biology and Science
Teachers and Preservice Teachers
Yeter Şimşekli
Correspondence: Yeter Şimşekli, Department of Mathematics and Science Education, Uludağ University, Bursa, Turkey.
Received: July 24, 2018 Accepted: August 14, 2018 Online Published: August 22, 2018
doi:10.11114/jets.v6i9.3564 URL: https://doi.org/10.11114/jets.v6i9.3564
Abstract
In this study, it was aimed to examine the experiment design skills of Biology and Science teachers and preservice teachers. For this purpose, 85 Biology and 80 Science teachers and preservices given information about laboratory approaches, experiment types and science process skills were asked to design an experiment about germination. In the reports of the experiments designed by the teachers and the presevice teachers, they were expected to give information about the factors affecting germination, write the problem, determine the hypotheses and the variables, plan their experiments and reach a conclusion. In the analysis of the reports, the sets of data digitized by forming a graded scoring scale were analyzed by benefiting from SPSS package program and their experiment design levels were analyzed based on their fields, being a teacher or a preservice teacher and gender. From the obtained data, it was determined that the number of those who designed an experiment was very low and although there were significant differences between the Biology and the Science teachers and preservice teachers in terms of designing an experiment according to many criteria, there was a difference only in one criterium according to gender.
Keywords: experiment design skill, biology education, science education, germination experiment, teacher, preservice teacher
1. Introduction
Experiment is the most basic tool used to obtain scientific knowledge. As it is in other disciplines, experiment is the method of testing the correctness of a piece of knowledge in the Biology and Science Education as well. The most important feature of Physical and Living Sciences is their attaching importance to experiment, observation, exploration, developing students' skills of asking questions, researching and providing possibilities of hypothesizing and interpreting appearing results (Balagun & Odubunni, 1991).
The secondary Science education and subsequently high school Biology education curricula necessitate using experiments so as to facilitate students' understanding subjects. For this reason, experiments are one of the important components of the Science and Biology education (Erten, 1991; Ocak, Kıvrak and Özay, 2005; Ayas, Çepni and Akdeniz, 1994). Besides providing students with the possibility of concretizing the knowledge which they learn in Science and Biology lessons, experiments contribute to students' learning the scientific method and developing their science process and psychomotor skills (Çalış and Şimşekli, 2011).
In the administration of new curricula giving particulat importance to experimental studies, teachers' competencies of designing experiments and scientific process skills used in experiments have gained importance. Demirci (1993) was of the opinion that experimental method can be carried out by well-educated teachers.
In our country, the use of experiment in the Biology and Science education has not reached the desired level. Among the factors causing the low number of experiments in the Biology and Science education are not only the substructure problem, that is to say, absence of appropriate laboratories at schools and students' having insufficient levels of attitudes and skills related to laboratory practices but also teachers' finding themselves incompetent (Yılayaz, Turan and Bahşi 2009; Yeşilyurt and Gül 2008; Yıldız, Aydoğdu, Akpınar and Ergin , 2010; Atıcı and Bora, 2004; Ocak et al., 2005; Öztaş and Özay 2004).
reaching their goals. After all, they will increase the use of experiments in the process of teaching subjects.
In our country, teachers have many reservations about the use of laboratory environment and doing experiments in the teaching of Biology and Science subjects (Atıcı and Bora, 2004; Öztaş and Özay 2004; Altunoğlu and Atav, 2005; Uluçınar Sağır and Aslan, 2009; Yılayaz et al., 2009). Revealing the reasons underlying these reservations may contribute to teachers' laboratory skills. One of these reservations is teachers' finding themselves insufficient. Determination of subjects and levels at which teachers find themselves insufficient may contribute to the solution of the problem.
The purpose of the study was to determine the experiment design skills of the Biology and Science teachers and preservice teachers in relation to the phenomenon of germination taught at each level of education. Moreover, it was also aimed to determine if there were differences between the experiment design skills of the Biology and the Science teaching areas, the teachers and the preservice teachers and the female and the male students. For this purpose, it was aimed to find answers to the following questions.
What are the levels of Biology and Science teachers and preservice teachers’ of experimental designing skills?
Is there a relationship between the experiment design skills of the Biology and the Science teachers and preservice teachers and their fields of education?
Is there a relationship between the experiment design skills of the Biology and the Science teachers and preservice teachers and their educational statuses?
Is there a relationship between the experiment design skills of the Biology and the Science teachers and preservice teachers and their genders?
2. Method
The study was administered to the Biology teachers and preservice teachers given information about laboratory approaches, experiment types and scientific process skills during the course of "Teaching Technologies and Material Design" and the Science teachers and preservice teachers during the courses of "Design and Development of Science Experiments" and "Special Teaching Methods". The participants were made necessary explanations prior to the study and told that the results to be obtained from the study would not affect their course grades.
2.1 Research Model
In the study, the descriptive model was used. In the descriptive model, it is aimed to describe an existing situation and the research subject tried to describe without any change within its own conditions (Karasar 2005).
2.2 Study Group
In the study, the convenience sampling method was used. The sample was composed of 15 Science teachers (master students have approximately 2 years professional experience) taking the course of "Design and Development of Science Experiments", 65 Science preservice teachers taking the course of "Special Teaching Methods" (total: 80) and 10 Biology teachers and 75 Biology preservice teachers (total: 85) taking the course of "Teaching Technologies and Material Development" as a part of formation program in the fall semester. Study was performed with 134 female and 31 male participants. (Table 1).
Table 1. The distribution of the study group according to the field of education, educational status and gender
Practice Groups Number of participants Educational Status Gender
Teacher Preservice Teacher Female Male
n % n % n % n % n %
Biology 85 51.5 10 11.8 75 88.2 73 85.9 12 14.1
Science 80 48.5 15 18.7 65 81.3 61 76.2 19 23.8
Total 165 100 25 15.2 140 84.8 134 81.2 31 18.8
2.3 Data Collection Tools
In the study, the Biology teachers and preservice teachers in the course of “Teaching Technologies and Material Development” and the Science teachers and preservice teachers in the courses of “Design and Development of Science Experiments” and the “Special Teaching Methods” were asked to design an experiment about the subject of germination and write these in reports. The fact that the subject of germination is taught commonly at observation dimension at preschool institutions and primary schools in our country and that the factors affecting germination (water, temperature and oxygen) are included in the secondary education curricula had an effect on the preference of this subject. The designs of the teachers and preservice teachers composed the data of the study.
2.4 Data Analysis
They were expected to give information about the factors having effects on the event of germination (water, temperature, and oxygen), state problems, hypotheses and variables (dependent, independent and controlled), plan their experiments and reach a conclusion in their reports. In the analysis process, the sets of data obtained from the experiment reports were digitized by forming a graded scoring scale (App. 1). The graded scoring scale (rubrics) are the scoring scales developed with the aim of using in the analysis of learning products (Mertler, 2001). In the analysis of the data, the spss statistical program was used. Related to the experiment design skills of the Biology and the Science teachers and preservice teachers, the frequency and the percentage values were calculated by two independent instructors; moreover, it was investigated if there were any relationships between their experiment design levels and fields of education, educational statuses and genders as well.
3. Results
As a result of the analysis of the data obtained from the experiment reports of the Biology and the Science teachers and preservice teachers, the frequency and the percentage values related to their experiment design skills and the relationships between their fields of education, educational statuses and genders and their experiment design skills were shown in this section. The frequency and the percentage values related to the experiment design skills of the Biology and the Science teachers and preservice teachers were shown in Table 2.
Table 2. The frequency and the percentage values related to the experiment design skills of the Biology and the Science teachers and preservice teachers
Experiment design skills F %
Those who could not design an experiment 13 7.9
Those who designed a single experiment (observation) 112 67.9 Those who tested one variable with two experiments 17 10.3 Those who tested two variables with three experiments 13 7.9 Those who tested three variables with four experiments 10 6.0
Total 165 100
When Table 2 was examined, it was observed that 7.9% of the teachers and the preservice teachers could not design a setting, 67.9% of them made an observation with a single setting, 10.3% of them tested one variable with two settings (one is control), 7.9% of them tested two variables, 6% of them designed a controlled experiment in a way to test three variables which were effective in the event of germination.
In order to understand if there was a significant difference between the experiment design skills of the teachers and the preservice teachers according to the variable of field of education (Biology and Science), the independent sample t-test was applied and the findings were shown in Table 3.
Table 3. The independent groups t-test results of the scores obtained from the Biology and the Science groups' experiment reports according to their fields of education
Headings Field n X S sd t P
Writing the water factor Biology 85 0.99 0.108 123.5 1.055 0.294
Science 80 0.96 0.191
Writing the temperature factor
Biology 85 0.38 0.487 163 -4.381 0.000*
Science 80 0.70 0.461
Writing the oxygen factor Biology 85 0.07 0.258 117 -5.694 0.000*
Science 80 0.43 0.497
Writing a problem statement
Biology 85 0.14 0.350 140.2 -5.659 0.000*
Science 80 0.53 0.503
Writing a hypothesis Biology 85 0.01 0.108 96.1 -2.690 0.008*
Science 80 0.11 0.318
Writing the independent variable
Biology 85 0.19 0.393 151.4 -6.109 0.000*
Science 80 0.61 0.490
Writing the dependent variable
Biology 85 0.19 0.393 151 -5.908 0.000*
Science 80 0.60 0.493
Writing the constant variables
Biology 85 0.07 0.258 131.2 -2.636 0.009*
Science 80 0.21 0.412
Designing an experiment Biology 85 1.07 0.704 133.9 -4.209 0.000*
Science 80 1.68 1.088
Writing a conclusion Biology 85 0.22 0.419 159.1 -1.113 0.268
Science 80 0.30 0.461
*
p<0.05
[t(123.5)=0.294, p>0.05]. This result showed that the difference between the Biology and the Science groups' mean scores was not significant.
The mean scores of those who stated that temperature was an effective factor in germination were 0.38 in the Biology group and 0.70 in the Science group and when the difference between the scores was tested at the significance level of 0.05 via t-test, the t value was found as -4.381 [t(163)= 0.000, p<0.05]. The mean scores of those who stated that oxygen was an effective factor in the event of germination were 0.07 in the Biology group and 0.43 in the Science group and when the difference between the scores was tested at the significance level of 0.05 via t-test, the t value was found as -5.694 [t(117)=0.000, p<0.05]. The mean scores of those who stated a problem statement in their experiment reports were 0.14 in the Biology group and 0.53 in the Science group and when the difference between the scores was tested at the significance level of 0.05 via t-test, the t value was found as -5.659 [t(140.2)=0.000, p<0.05]. The mean scores of those who stated a hypothesis in their experiment reports were 0.01 in the Biology group and 0.11 in the Science group and when the difference between the scores was tested at the significance level of 0.05 via t-test, the t value was found as -2.690 [t(96.1)=0.008, p<0.05]. The mean scores of those who stated the independent variable in their experiment reports were 0.19 in the Biology group and 0.61 in the Science group and when the difference between the scores was tested at the significance level of 0.05 via t-test, the t value was found as -6.109 [t(151.4)=0.000, p<0.05]. The mean scores of those who stated the dependent variable in their experiment reports were 0.19 in the Biology group and 0.60 in the Science group and when the difference between the scores was tested at the significance level of 0.05 via t-test, the t value was found as -5.908 [t(151)=0.000, p<0.05]. The mean scores of those who stated the constant variables in their experiment reports were 0.07 in the Biology group and 0.21 in the Science group and when the difference between the scores was tested at the significance level of 0.05 via t-test, the t value was found as -2.636 [t(131.2)=0.009, p<0.05]. The mean scores of those who wrote how the experiment was done in their reports were 1.07 in the Biology group and 1.68 in the Science group and when the difference between the scores was tested at the significance level of 0.05 with t test, the t value was found as -4.209 [t(133.9)=0.000, p<0.05]. The results related to the headings of “writing the temperature factor”, “writing the oxygen factor”, “writing a problem statement”, “writing a hypothesis”, “writing the variables” and “designing an experiment” show the presence of a significant difference between the arithmetic means of the Biology and the Science groups. In other words, there is a significant difference between the mean scores obtained from the Biology and the Science groups' reports belonging to these headings in favor of the Science group.
The mean score of the Biology group reporting the conclusions of their experiments was 0.22 and that of the Science group was 0.30 and when the difference between the scores was tested at the significance level of 0.05 via t-test, the t value was found as -1.113 [t(159.1)=0.268, p>0.05]. According to this result, it can be stated that there was not a significant difference between the mean scores of the Biology and the Science groups reporting the conclusions of their experiments.
The results of the independent groups t-test employed to see if there was a significant difference between the Biology and the Science groups' experiment design skills according to the variable of educational status were shown in Table 4.
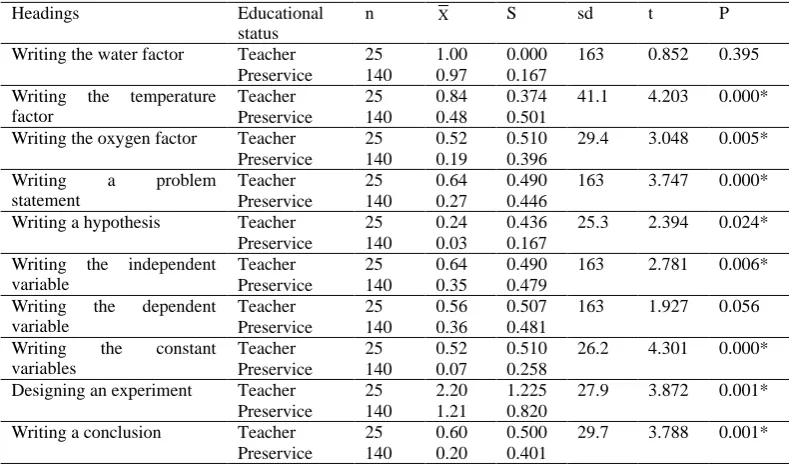
Table 4. The independent groups t-test results of the scores obtained from the Biology and the Science groups' experiment reports according to their educational status
Headings Educational
status
n X S sd t P
Writing the water factor Teacher 25 1.00 0.000 163 0.852 0.395 Preservice 140 0.97 0.167
Writing the temperature factor
Teacher 25 0.84 0.374 41.1 4.203 0.000* Preservice 140 0.48 0.501
Writing the oxygen factor Teacher 25 0.52 0.510 29.4 3.048 0.005* Preservice 140 0.19 0.396
Writing a problem statement
Teacher 25 0.64 0.490 163 3.747 0.000*
Preservice 140 0.27 0.446
Writing a hypothesis Teacher 25 0.24 0.436 25.3 2.394 0.024* Preservice 140 0.03 0.167
Writing the independent variable
Teacher 25 0.64 0.490 163 2.781 0.006*
Preservice 140 0.35 0.479 Writing the dependent
variable
Teacher 25 0.56 0.507 163 1.927 0.056
Preservice 140 0.36 0.481 Writing the constant
variables
Teacher 25 0.52 0.510 26.2 4.301 0.000* Preservice 140 0.07 0.258
Designing an experiment Teacher 25 2.20 1.225 27.9 3.872 0.001* Preservice 140 1.21 0.820
Writing a conclusion Teacher 25 0.60 0.500 29.7 3.788 0.001* Preservice 140 0.20 0.401
*
When Table 4 was examined, it was found that the mean score of the teachers stating that water was an effective factor in the event of germination was 1.00 and that of the preservice teachers was 0.97 and when the difference between the scores was tested at the significance level of 0.05, the t value was found as 0.852 [t(163)=0.395, p>0.05]. This result showed that the difference between the arithmetic mean of the teachers and that of the preservice teachers was not significant.
When the mean scores of those who stated that temperature was an effective factor in the event of germination were looked in, it was found that the mean score of the teachers was 0.84 and that of the preservice teachers was 0.48 and when the difference between the scores was tested at the significance level of 0.05 via t-test, the t value was found as 4.203 [t(41.1)=0.000, p<0.05]. The mean scores of those who stated that oxygen was an effective factor in the event of germination were found as 0.52 for the teachers and 0.19 for the preservice teachers and when the difference between the scores was tested at the significance level of 0.05 via t-test, the t value was found as 3.048 [t(29.4)=0.005, p<0.05]. The mean scores of those who stated a problem statement in their experiment reports were found as 0.64 for the teachers and 0.27 for the preservice teachers and when the difference between the scores was tested at the significance level of 0.05 via t-test, the t value was found as 3.747 [t(163)=0.000, p<0.05]. The mean scores of those who stated a hypothesis in their experiment reports were found as 0.24 for the teachers and 0.03 for the preservice teachers and when the difference between the scores was tested at the significance level of 0.05 via t-test, the t value was found as 2.394 [t(25,3)=0.024, p<0.05]. The mean scores of those who stated the independent variable in their experiment reports were found as 0.64 for the teachers and 0.35 for the preservice teachers and when the difference between the scores was tested at the significance level of 0.05 via t-test, the t value was found as 2.781 [t(163)=0.006, p<0.05]. These results show that the difference between the arithmetic means of the teachers and the preservice teachers in relation to the headings of "writing the temperature factor", "writing the oxygen factor", "writing a problem statement", "writing a hypothesis" and "writing the independent variable" is significant. In other words, there is a significant difference between the mean scores of the teachers and the preservice teachers in relation to these headings in favor of the teachers.
The mean scores of those who stated the dependent variable in their experiment reports were found as 0.56 for the teachers and 0.36 for the preservice teachers and when the difference between the scores was tested at the significance level of 0.05 via t-test, the t value was found as 1.927 [t(163)=0.056, p>0.05]. This result shows that the difference between the arithmetic means of the teachers and the preservice teachers is not significant. In other words, there is not a significant difference between the mean scores of the teachers and the preservice teachers who stated the dependent variable in their experiment reports.
The mean scores of those who stated the constant variable in their experiment reports were found as 0.52 for the teachers and 0.07 for the preservice teachers and when the difference between the scores was tested at the significance level of 0.05 via t-test, the t value was found as 4.301 [t(26.2)=0.000, p<0.05]. The mean scores of those who wrote about how they did their experiments in their reports were 2.20 for the teachers and 1.21 for the preservice teachers and when the difference between the scores was tested at the significance level of 0.05 via t-test, the t value was found as 3.872 [t(27.9)=0.001, p<0.05]. The mean scores of those who wrote the conclusions of their experiments in their reports were 0.60 for the teachers and 0.20 for the preservice teachers and when the difference between the scores was tested at the significance level of 0.05 via t-test, the t value was found as 3.788 [t(29.7)=0.001, p>0.05]. These results show that the difference between the arithmetic means of the teachers and the preservice teachers in relation to the headings of "writing the constant variables", "experiment design" and "writing a conclusion". In other words, there is a significant difference between the mean scores of the teachers and the preservice teachers in relation to these headings in favor of the teachers.
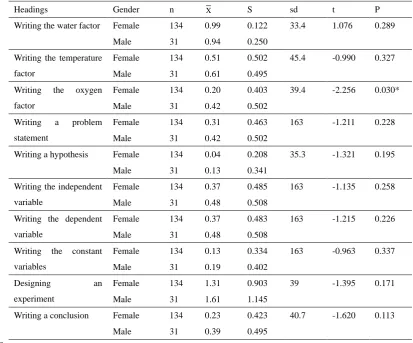
Table 5. The independent groups t-test results of the scores obtained from the Biology and the Science groups' experiment reports according to the variable of gender
Headings Gender n X S sd t P
Writing the water factor Female 134 0.99 0.122 33.4 1.076 0.289
Male 31 0.94 0.250
Writing the temperature factor
Female 134 0.51 0.502 45.4 -0.990 0.327
Male 31 0.61 0.495
Writing the oxygen factor
Female 134 0.20 0.403 39.4 -2.256 0.030*
Male 31 0.42 0.502
Writing a problem statement
Female 134 0.31 0.463 163 -1.211 0.228
Male 31 0.42 0.502
Writing a hypothesis Female 134 0.04 0.208 35.3 -1.321 0.195
Male 31 0.13 0.341
Writing the independent variable
Female 134 0.37 0.485 163 -1.135 0.258
Male 31 0.48 0.508
Writing the dependent variable
Female 134 0.37 0.483 163 -1.215 0.226
Male 31 0.48 0.508
Writing the constant variables
Female 134 0.13 0.334 163 -0.963 0.337
Male 31 0.19 0.402
Designing an
experiment
Female 134 1.31 0.903 39 -1.395 0.171
Male 31 1.61 1.145
Writing a conclusion Female 134 0.23 0.423 40.7 -1.620 0.113
Male 31 0.39 0.495
*
p<0.05
When Table 5 was examined, it was observed that the mean scores of those who stated that water was an effective factor in the event of germination were 0.99 for the female group and 0.94 for the male group and when the difference between the scores was tested at the significance level of 0.05 via t-test, the t value was found as 1.076 [t(33.4)=0.289, p>0.05]. The mean scores of those who stated that temperature was an effective factor in the event of germination were 0.51 for the female group and 0.61 for the male group and when the difference between the scores was tested at the significance level of 0.05 via t-test, the t value was found as 0.990 [t(45.4)=0.327, p>0.05]. These results show that the difference between the genders in terms of the mean scores related to the headings of "writing the water factor" and "writing the temperature factor" is not significant.
The mean scores of those who stated that oxygen was an effective factor in the event of germination were 0.20 for the female group and 0.42 for the male group and when the difference between the scores was tested at the significance level of 0.05 via t-test, the t value was found as 2.256 [t(39.4)=0.030, p<0.05]. This result shows the presence of a significant difference between the scores of the female group and those of the male group in relation to their opinions about that oxygen is an effective factor in the event of germination.
group and 0.19 for the male group and when the difference between the scores was tested at the significance level of 0.05 via t-test, the t value was found as 0.963 [t(163)=0.337, p>0.05]. The mean scores of those who wrote how they did the experiment in their experiment reports were 1.31 for the female group and 1.61 for the male group and when the difference between the scores was tested at the significance level of 0.05 via t-test, the t value was found as 1.395 [t(39)=0.171, p>0.05]. The mean scores of those who wrote the conclusion of their experiment in their experiment reports were 0.23 for the female group and 0.39 for the male group and when the difference between the scores was tested at the significance level of 0.05 via t-test, the t value was found as 1.620 [t(40.7)=0.113, p>0.05]. These results show that the difference between the means of the scores of both genders in relation to the headings of "writing a problem statement", "writing a hypothesis", "writing the variables", "experiment design" and "writing a conclusion" is not significant. In other words, there is not a significant difference between the female group and the male group in relation to this heading.
4. Discussion
In this study, the experiment design skills of the Biology and the Science teachers and preservice teachers were investigated and their relationships with such variables as the field of education, educational status and gender were examined. It was determined that 75.8% of the Biology and the Science teachers and preservice teachers did not design a controlled experiment and 18.2% designed a controlled experiment but their experiment designs did not cover all the factors. That the percentage of those who designed a complete experiment was 6 is attracting attention. These results show parallelism to those which were obtained from similar studies (Atıcı and Bora, 2004; Öztaş and Özay, 2004; Demir and Şahin, 2015).
According to the findings obtained from the study, it can be stated that although there is a significant relationship between the experiment design skills of the Biology and the Science teachers and preservice teachers and their fields of education and educational statuses, there is not a significant relationship between their experiment design skills and their genders. According to the field of education, apart from the headings of "writing the water factor" and "writing a conclusion", there is a statistically significant difference between the mean of the scores of the Biology group and that of the scores of the Science group in all the headings ("writing the temperature factor", "writing the oxygen factor", "writing a problem statement", "writing a hypothesis", "writing the variables", "experiment design") in favor of the Science teachers. This might be attributed to the fact that the Biology group focused more on the conclusion in the experiments which they made in the learning process but the Science group focused more on the process in their experiments. Another important point attracting attention is that the Biology group were more incompetent than the Science group in terms of theoretical knowledge. It is also attracting attention that both groups were rather incompetent at writing hypotheses. These results show parallelism to those which were obtained from the study by Demir and Şahin (2015).
According to the educational status, it was observed that there was a statistically significant difference between the scores of the teachers and the preservice teachers related to the headings of "writing the temperature factor", "writing the oxygen factor", "writing the problem statement", "writing a hypothesis", "writing the independent and the constant variables", "experiment design" and "writing a conclusion" in favor of the teachers. However, a significant difference was not determined between the score means related to the headings of "writing the water factor" and "writing the dependent variable". It can be stated that teachers' being more experienced than the preservice teachers might have led to this difference. That newly-graduated teachers are more eager to use the laboratory was also found by Ekici (2002) and Yıldız et al., (2010).
According to the variable of gender, it was observed that there was a statistically significant difference between the means of the scores of the female group and the male group only related to the heading of "writing the oxygen factor". From here, it can be concluded that gender did not create a statistically significant difference on the experiment design skill. These results show parallelism to the study by Ekici (2002). However, when the means belonging to the scores were examined, it was observed that the female students had lower means compared to the male ones in all the components.
it was found that both groups were not sufficient at "writing a problem statement", "writing a hypothesis", "writing the variables", "experiment design" and "writing a conclusion".
It is very important that teachers should develop their experiment design skills (Erten, 1991; Ocak et al., 2005; Altunoğlu and Atav, 2005). For this reason, studies aiming to determine the main reasons of the problems of Biology and Science teachers and preservice teachers’ relation to laboratory use and experiment design should be given priority. Moreover, for the success of the Biology and Science Education programs, some programs aiming to increase knowledge and skills of teachers and preservice teachers can be developed as well.
References
Altunoğlu, B. D., & Atav, E. (2005). Teacher expectations for a more efficient Biology instruction. Hacettepe University Journal of Education, (28), 19-28.
Atıcı, T., & Bora, N. (2004). Suggestions and evaluation of teaching methods that are used for biology education in secondary education. Afyon Kocatepe Üniversitesi Sosyal Bilimler Dergisi, 6(2), 51-64.
Ayas, A., Çepni, S., & Akdeniz, A. R. (1994). Fen bilimleri eğitiminde laboratuvarın yeri ve önemi (II): Laboratuvar uygulamalarında amaçlar ve yaklaşımlar. Çağdaş Eğitim, (19), 7-12.
Balagun, T. A., & Odubunni, O. (1991). The effect of lecture teaching methods on cognitive achievement in integrated science. Journal Research in Science Teaching, 28, 213-224. https://doi.org/10.1002/tea.3660280303
Çalış, S., & Şimşekli, Y. ( 2011). The effect of some variables on the primary school students’ attitudes towards science and technology laboratory applications. Prof.Dr. Assen Zlatarof University Academic Journal, 7(4), 122-128. Demir, S., & Şahin, F. (2015). Capacity of the science teacher candidates to create open-ended experiments. The
Journal of Academic Social Science Studies, (33), 433-442. https://doi.org/10.9761/JASSS2809
Demirci, B. (1993). Çağdaş fen bilimleri eğitimi ve eğitimcileri. Hacettepe University Journal of Education, 9, 155-157.
Ekici, G. (2002). The attitude scale of Biology teachers toward laboratory lesson. Hacettepe University Journal of Education, (22), 62-66.
Erten, S. (1991). Die Bedeutung und probleme des biologiepraktikums (Unpublished master’s thesis). Gazi Üniversity,
Ankara, Turkey.
Karasar, N. (2005). Bilimsel araştırma yöntemleri. Ankara: Nobel Yayın Dağıtım.
Mertler, C. A. (2001). Designing scoring rubrics for your classroom. Practical Assessment, Research & Evaluation, 7(25), 1-8.
Ocak, İ., Kıvrak, E., & Özay, E. (2005). A search of importance of Biology laboratory’ usage and difficulties that occur during Biology laboratory’ usage as respect of Biology teachers (Erzurum province sample). Erzincan Eğitim Fakültesi Dergisi, 7(2), 65-75.
Öztaş, H., & Özay, E. (2004). Problems Biology teachers encounter in Biology teaching. Gazi Üniversitesi Kastamonu Eğitim Dergisi, 12(1), 69-77.
Uluçınar, S. Ş., & Aslan, O. (2009). The examination of preservice science teachers’ self efficacy beliefs with respect to different variables. e-Journal of New World Sciences Academy, 4(2), 465-475.
Yeşilyurt, S., & Gül, Ş. (2008). The expectations of Biology teachers and students for a more efficient Biology instruction in the secondary schools. Kastamonu Eğitim Dergisi, 16(1), 145-162.
Yılayaz, Ö., Turan, M., & Bahşi, M. (2009). The functions of science laboratory in primary schools. e-Journal of New World Sciences Academy, 4(2), 595-603.
App. 1. Graded scoring scale of experiment reports
Definitions Grade
Theoretical knowledge
Mentioned that water is an important factor for germination 1 Did not mention that water is an important factor for germination 0 Mentioned that temperature is an important factor for germination 1 Did not mention that temperature is an important factor for germination 0 Mentioned that oxygen is an important factor for germination 1 Did not mention that oxygen is an important factor for germination 0
Problem, Hypothesis and Variables
Wrote a problem statement 1
Did not write a problem statement 0
Wrote the hypothesis correctly 1
Did not write the hypothesis correctly 0
Wrote the independent variable 1
Did not write the independent variable 0
Wrote the dependent variable 1
Did not write the dependent variable 0
Wrote the fixed variable 1
Did not write the fixed variable 0
Description of the experiment
Defined three factors affecting the germination (used four setups) 4 Defined two factors affecting the germination (used three setups) 3 Defined one factor affecting the germination (used two setups) 2 No control group was used (explained with one setup in observational dimension) 1
Did not explain how to conduct the experiment 0
Conclusion
Wrote the conclusion of the experiment correctly 1 Did not write the conclusion of the experiment correctly or wrote an incorrect conclusion 0
Copyrights
Copyright for this article is retained by the author(s), with first publication rights granted to the journal.