Journal of Applied Linguistics and Language Research Volume 2, Issue 8, 2015, pp. 230-242
Available online at www.jallr.com ISSN: 2376-760X
* Correspondence: Hamed Gahemi, Email: [email protected] © 2015 Journal of Applied Linguistics and Language Research
The Relationship among Perfectionism, Motivation and
Self-Efficacy of EFL Learners
Hamed Gahemi *
Department of English, Neyshabur Branch, Islamic Azad University, Neyshabur, Iran
Samira Damirchiloo
Department of English, Neyshabur Branch, Islamic Azad University, Neyshabur, Iran
Abstract
The purpose of the present study was to investigate the relationship among perfectionism, motivation and self-efficacy of EFL learners. Among the 132 participants, 87 were female and 45 were male with different majors in high school. There were three questionnaires in this study; The Almost Perfect Scale - Revised, The Academic Motivation Scale and The General Self-Efficacy Scale. Regarding the first research hypothesis, the results showed that there was a significance correlation between perfectionism and efficacy. As perfectionism increases, efficacy of the participants increases, too. Concerning the second hypothesis, it is revealed that there is a significance correlation between motivation and efficacy. As for hypotheses three and four, it was shown that there was a strong and positive relationship among the variables. The largest number of significant correlations in this study went to the correlations between perfectionism and other variables whereas the correlation between perfectionism and self-efficacy was low. In addition, in most cases, the correlations among perfectionism and motivation and other variables were positive and high.
Keywords: perfectionism, motivation, self-efficacy, educational policies, professional development
INTRODUCTION
experience all-or-none thinking, where they believe they are a failure if not all of their goals are completed without any mistakes - they have inflexible notions of what constitutes success and failure. They often experience a fear of making mistakes, and measure their self-worth in terms of productivity and accomplishment. Failure to achieve their goals results in a lack of personal worth (Hewitt, Flett, & Weber; Broday, 1988; Brophy, 2005; Ellis, 2002; Frost & Marten, 1990; Shafran, Cooper &Fairburn, 2002). The fear of failure, of not being perfect and of not being able to live up to the expectations of themselves and others, can cause overwhelming feelings that lead to procrastination as an avoidance tactic - this allows the individual to avoid a less than perfect performance (Frost & Marten, 1990). Perfectionists also fear disapproval by others, and believe that if they let others see their flaws they will not be accepted. They commonly believe that others achieve success with minimal effort or stress, while they feel they have to work hard without obtaining success (Frost & Marten, 1990). Taken together, these irrational beliefs can lead to the experience of negative emotions, such as shame, guilt and embarrassment (Tangney, 2002).
High-efficacy learners are willing to take risks, believe more in their capabilities, and put additional effort on teaching tasks to be more effective, while low-efficacy learners believe that they cannot change anything or produce positive learning outcomes, and they question their instructional capabilities.This, in turn, causes stress, and long-term exposure to stress causes burnout. Moreover, since a school is a social network of relations among students, teachers and administrators, teachers’ sense of efficacy might also affect their sense of collective efficacy (Goddard & Goddard, 2001; Kurz& Knight, 2004).
People working in face-to-face professions have to interact more than people working in other professions, and this requires spending more time and being more involved with their clients. They have to solve their clients’ problems and while doing that, they may experience “feelings of anger, embarrassment, fear, or despair” (Maslach& Jackson, 1981, p. 99). However, Maslach and Jackson (1981) argue that it is not always possible to find fast and effective solutions to these problems, which causes frustration.
as something to be mastered, rather than avoided. They will show strong commitment to their activities and recover quickly from setbacks.
Conversely, people who are low in self-efficacy typically will avoid challenging tasks, believing they are not capable to perform such tasks and will focus on negative outcomes. It would seem likely then that people with low levels of self-efficacy are more likely to procrastinate than those who are highly efficacious, as procrastinators often have problems setting goals for themselves. Active procrastinators will be more similar to non-procrastinators in terms of self-efficacy beliefs (Chu & Choi, 2005).
The efficacy of learners’ motivation in workplace is of great importance. Instructional experience of researchers shows that some principals of pre-school centers, try more in their activities to do their best and have better instructional performance, so that environmental incentives have less effect on their behaviors, while instructional performance of some their principals are closely related to the outer or environmental factors and incentives. On the other hand, perfectionism dimensions and coping strategies got too less attention as two interpersonal variables in relationship with motivation. Over the last decade, there has been an increasing interest in the relationship between motivation and self-efficacy. Studies on this relationship demonstrate that motivation and self-efficacy could be related, and that a low sense of efficacy could cause demotivation (Brouwers&Tomic, 2000, Brouwers&Tomic, 2002; Schwarzer & Hallum, 2008). Moreover, Bandura (1995) claims that a low sense of efficacy causes learners to feel that academic demands are stressful, which may lead to a decrease in their commitment to teaching and an avoidance of problems in an escapist pattern. This effect, in turn, increases their level of demotivation. The studies done before shows that there is a relationship between the aforementioned variable, but there has been little studies regarding specifically perfectionism and the variables in this study.
In a new and different setting, the present study aimed to cast additional light on the relationship between perfectionism and motivation and self-efficacy. And also, the study was done on just English learners; the learners that has little exposure to the language that they learn.
SIGNIFICANCE OF THE STUDY
Due to a lack of research in what we are going to study in this research, the present study contributed to the field by exploring learners’ motivation experiences, perfectionism and perceptions of self-efficacy, and the relationship among them. Thus, the investigation of these variables could provide valuable data, especially for EFL teachers and administrators in similar settings. Moreover, it could form a baseline for further research that focuses on how self-efficacy and perfectionism and motivation achievement are related in different educational settings, especially in Iran.
could help develop an understanding of EFL teachers working conditions in schools and their needs and expectations, a research field that needs to be explored.
Finally, in light of the results, administrators could develop specific interventions and modify the current educational policies to organize more professional development activities to increase the level of self-efficacy and perfectionism at the same time, if necessary. This could also boost teaching efficacy and create a higher level of student success.
RESEARCH QUESTIONS AND HYPOTHESES
The purpose of this study was to investigate the relationship among relationship among perfectionism, motivation and self-efficacy of EFL learners in Tabadkan District, Mashhad. Based on the aforementioned facts, the present study tried to answer the following research questions.
Q1. Is there any relationship between perfectionism and self-efficacy of EFL learners? Q2. Is there any relationship between motivation and self-efficacy of EFL learners? Q3. Is there any relationship between perfectionism and motivation of EFL learners? Q4. Is there any difference among perfectionism and self-efficacy and motivation? Considering the above research questions, the researcher posed four hypotheses.
H1. There is not any relationship between perfectionism and self-efficacy of EFL learners. H2. There is not any relationship between motivation and self-efficacy of EFL learners. H3. There is not any relationship between perfectionism and motivation of EFL learners. H4. There is not any difference among perfectionism and self-efficacy and motivation. METHOD
Participants
This study was run in Ministry of Education in Khorasan-e-Razavi, Mashhad and was conducted in the 2014-2015 academic year. 132 high school learners participated in the study. Among the 132 participants, 87 were female and 45were male with different majors in high school. Their age ranged between 15 and 18 years old.
Instrumentation
Perfectionism
The Almost Perfect Scale - Revised (Slaney, Mobley, Trippi, Ashby & Johnson, 1996) is a 23-item scale used to assess attitudes people have towards themselves, their performance and towards others. It measures the adaptive and maladaptive aspects of perfectionism. Participants were asked to respond to items such as “I set very high standards for myself” using a Likert-type scale from “1 - Strongly disagree” to “7 - Strongly Agree”. The Scale consists of three subscales - High Standards, Discrepancy and Order - which were attained by totaling scores for particular items. The High Standards and Order reflect adaptive perfectionism and the Discrepancy subscale reflects maladaptive aspects of perfectionism. Scores ranged from 11-77 for adaptive perfectionism and from 12-84 for maladaptive perfectionism, with higher scores indicating higher perfectionism. Slaney and his colleagues (2001) reported internal consistency coefficients for the APS-R ranging from .82 to .93 and good concurrent and construct validity (Chu & Choi, 2005). The scale was reported to have a construct validity established by factor analysis and reliability of 0.89.
Table 1. Perfectionism Reliability Statistics
Cronbach’s Alpha N of Items
.89 23
Motivation
The Academic Motivation Scale (AMS-C 28) College Version (Vallerand, Pelletier, Blais, Briere, Senecal&Vallieres, 1992) is a 28-item scale used to look at the reasons why people go to college. The Scale consists of three subscales - Intrinsic Motivation, Extrinsic Motivation and Amotivation – which are attained by totaling scores for particular items. Participants were asked to indicate to what extent each of the items on the Scale corresponded to the reason they go to college using a Likert-type scale from “1 – Does not correspond at all” to “7 – Corresponds exactly”.
An example of an item on the Scale that participants had to respond to was “For the pleasure that I experience when I read interesting authors”. This would represent intrinsic motivation. Scores ranged from 4 – 28 for amotivation and from 12 – 84 for intrinsic and extrinsic motivation, with higher scores indicating higher motivation. Vallerand, et al. (1992) demonstrated adequate levels of reliability and factorial validity. Internal consistency of the subscales ranged from .83 to .86. The scale was reported to have a construct validity established by factor analysis and reliability of 0.82.
Table2. Motivation Reliability Statistics
Cronbach’s Alpha N
.82 28
Self-Efficacy
with daily hassles as well as adaptation after experiencing all kinds of stressful life events. Participants were asked to respond to items such as “I am confident that I could deal efficiently with unexpected events” using a Likert-type scale from “1 - Not true at all” to “4 - Exactly true”. The responses for each of the ten items were summed to give a total score. The range was from 10 to 40, with a higher score indicating higher self-efficacy. Scholz, Gutiérrez Doña, Sud and Schwarzer (2002) have demonstrated that the GSE Scale is reliable, homogenous and unidimensional across 25 nations with an internal consistency coefficient of .86. The scale was reported to have a construct validity established by factor analysis and reliability of 0.94.
Table 3. Self-Efficacy Reliability Statistics
Cronbach’s Alpha N
.94 10
Procedure
After choosing the targeted participants, the questionnaires were given to them and the data for the analysis of the study was gathered. After collecting the data from the three questionnaires, the relationship among them was investigated.
Design of the Study
There were three variables in this study; perfectionism, motivation and learner’s efficacy. Perfectionism was independent variable and motivation and learner’s self-efficacy were dependent ones. This study was an ex-post facto design.
Data Analysis
In this study, to show the relationship among each of the questionnaires, correlations and regressions were applied.
RESULTS
Descriptive Statistics in Males and Females
Gender frequency of the participants is presented in the following table. Out of 132 participants of this study, 45 of them were males and 87 of them were females, that equals to 34.1 percent and 34.1 percent for the males and females, respectively.
Table 4. Gender Frequency
Frequency Percent Valid Percent Cumulative Percent Valid
Female 87 65.9 65.9 65.9
Male 45 34.1 34.1 100.0
Total 132 100.0 100.0
Table 5. Descriptive Statistics Concerning the Three Variables
Perfectionism Motivation Efficacy
N Valid 132 132 132
Missing 0 0 0
Mean 95.31 119.10 25.60
Median 90.00 120.00 25.50
Mode 95.00a 123.00a 24.00a
Std. Deviation 26.72 31.25 5.56
Variance 714.21 976.82 30.95
According to Table 5, the mean of the participants’ perfectionism, motivation and efficacy equaled 95.31, 119.10 and 25.60 respectively. The median equaled 90, 120 and 25.50. Standard deviation in each of the variables (perfectionism, motivation and efficacy) equaled to be 26.72, 31.25 and 5.56, respectively. Below, the histograms regarding each of the variables are presented.
In relation to perfectionism, participants were categorized as low, medium, and high. Table 6. Descriptive Statistics on Categorization of Perfectionism
Frequency Percent Valid Percent Cumulative Percent
Valid Low 18 13.6 13.6 13.6
Medium 77 58.3 58.3 72.0
High 37 28.0 28.0 100.0
Total 132 100.0 100.0
As Table 6 shows, out of 132 participants in perfectionism group, 18 of them were low, 77 of them were medium and 37 of them were high in perfectionism.
Participants were also classified according to their levels of motivation. Regarding the motivation, the following descriptive results were found.
Table 7. Descriptive Statistics on Categorization of Motivation
Frequency Percent Valid Percent Cumulative Percent
Valid Low 16 12.1 12.1 12.1
Medium 81 61.4 61.4 73.5
High 35 26.5 26.5 100.0
Total 132 100.0 100.0
According to Table 7, out of 132 participants, 16 were low, 81 were medium, and 35 were high in motivation. Below is the histogram in relation to motivation.
Table 8. Descriptive Statistics on Categorization of Efficacy
Frequency Percent Valid Percent Cumulative Percent
Valid Low 26 19.7 19.7 19.7
Medium 77 58.3 58.3 78.0
High 29 22.0 22.0 100.0
Total 132 100.0 100.0
Similar analyses were run in relation to efficacy. According to Table 8, out of 132 participants in efficacy group, 26 of them were low, 77 of them were medium and 29 of them were high in efficacy.
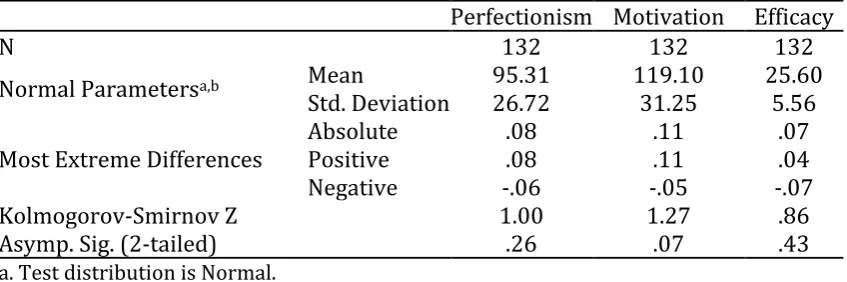
Kolmogorov-Smirnov Test of the Normality of the Data
Table shows the normality of all the variables (perfectionism, motivation, and efficacy). According to this table, the value of the test for the perfectionism equaled to 0.61 for the male participants and the obtained level of the significance is 0.85 and the value of the test for motivation equaled to 0.73 and the obtained level of significance is 0.65, and the value of the test for the efficacy equaled to 0.75 for the male participants and the obtained level of the significance is 0.61 which in all the data, the value is greater than 0.05. So, perfectionism, motivation and self- efficacy are all normal variables.
Table 9. Kolmogorov-Smirnov Test for All the Variables
Perfectionism Motivation Efficacy
N 132 132 132
Normal Parametersa,b Mean 95.31 119.10 25.60
Std. Deviation 26.72 31.25 5.56 Most Extreme Differences Absolute Positive .08 .08 .11 .11 .07 .04
Negative -.06 -.05 -.07
Kolmogorov-Smirnov Z 1.00 1.27 .86
Asymp. Sig. (2-tailed) .26 .07 .43
a. Test distribution is Normal. b. Calculated from data.
Testing the Research Hypotheses
In this section the results related to the research hypotheses are presented.
Regarding the first hypothesis; that is, there is not any significant relationship between perfectionism and efficacy, the following analyses were run.
Table 10. Correlation for Perfectionism and Efficacy
Perfectionism Self-Efficacy Perfectionism Pearson Correlation 1 .80**
Sig. (2-tailed) .00
N 132 132
Self-Efficacy Pearson Correlation .80** 1
Sig. (2-tailed) .00
N 132 132
**.Correlation is significant at the 0.01 level (2-tailed).
Table 10 shows the correlation between perfectionism and efficacy. According to this table, the correlation is 0.80 and the obtained level of the significance was found to be 0.00, which is less than 0.05. As a result, the null hypothesis is rejected. This means that there is a significance correlation between perfectionism and efficacy. As perfectionism increases, efficacy of the participants increases, too.
Regarding the second research hypothesis; that is, there is not any significant relationship between motivation and efficacy, the Pearson Correlation analysis was run. Table 11 shows the correlation analysis for motivation and efficacy.
Table 11. Correlation for Motivation and Efficacy
Motivation Self-Efficacy Motivation Pearson Correlation 1 .74**
Sig. (2-tailed) .00
N 132 132
Self-Efficacy Pearson Correlation .74** 1
Sig. (2-tailed) .00
N 132 132
**.Correlation is significant at the 0.01 level (2-tailed).
According to Table 11, the correlation is 0.74 and the P-value is 0.00. As a result, the null hypothesis is rejected. This means that there is a significance correlation between motivation and efficacy. If one of them increases, the other will also increase.
Table 12. Correlation for Perfectionism and Motivation Perfectionism Motivation Perfectionism Pearson Correlation 1 .61**
Sig. (2-tailed) .00
N 132 132
Motivation Pearson Correlation .61** 1
Sig. (2-tailed) .00
N 132 132
**.Correlation is significant at the 0.01 level (2-tailed).
According to the table above, the correlation is 0.61 and the obtained level of the significance was found to be 0.00, which is less than 0.05. As a result, the null hypothesis is rejected. This means that there is a significance correlation between perfectionism and motivation. As perfectionism increases, participants’ motivation increases, too.
In relation to research hypothesis 4, the correlation among perfectionism and motivation and efficacy was tested. In order to test the last hypothesis, considering perfectionism and motivation as independent variables and efficacy as dependent variable, regression test was run.
Table 13. Model Summary
Model R R Square Adjusted R Square Std. Error of the Estimate
1 .86a .75 .74 2.79
a.Predictors: (Constant), Perfectionism, Motivation
According to Table 13, the correlation between the aforementioned variables equaled to be 0.86 and R Square equaled 0.75. For further statistics, an ANOVA was run, too.
Table 14. ANOVA
According to this table, the F was found to be 195.41 with the P-value of 0.00 which is less than 0.05. As a result, it can be concluded that the regression was meaningful.
Table 15. Coefficientsa
Model
Unstandardized Coefficients Standardized Coefficients
t Sig.
B Std. Error Beta
(Constant) 5.98 1.03 5.79 .00
Motivation .07 .01 .39 7.16 .00
Perfectionism .11 .01 .56 10.13 .00
Dependent Variable: Self Efficacy
Model Sum of Squares Df Mean Square F Sig.
1 Regression 3049.08 2 1524.54 195.41 .00a
Residual 1006.43 129 7.80
Total 4055.51 131
Table 15 depicts perfectionism and motivation regression coefficients on efficacy. Perfectionism and motivation’s regression coefficient equaled 0.11 and 0.07 respectively. And the P-value equaled 0.00 which is less than 0.05. As a result, independent variables (perfectionism and motivation) have significant effect on efficacy (Y = 5.98 + 0.07 x 1 + 0.11 x 2).
The current study investigated the relationship among perfectionism, motivation and self-efficacy of EFL learners. The present study enjoyed a correlational design and consists of three separate questionnaires. Before the administering questionnaires, participants were roughly homogeneous in term of their overall characteristics.
Then, the participant were asked to fill out the three questionnaires that perfectionism was considered as an important underlying factor that in one way or another effects on the kind of decision whether or not a person has willingness to be perfect or not.
Finally, Pearson Correlation and an ANOVA were conducted to examine the probable relationship among the teachers’ perfectionism, motivation and self-efficacy. At the end, the statistical analyses of data revealed that there was a statistically significant relationship between participants’ perfectionism, motivation and self-efficacy.
DISCUSSION AND CONCLUSION
Based on the results of this study that were discussed in the previous chapter, there were strong even though significant correlations between the three variables; self-efficacy, perfectionism and motivation. Moreover, on a study on the relationship between efficacy and motivation among ELT teachers, Cagle (1998) found a strong negative relationship between efficacy and motivation. This may be due to the fact that learners of this study, who had high levels of self-efficacy, had high motivation.
These results of this study are not to some extent in line with the findings of Cagle (1998) who found no significant correlations between self-efficacy efficacy and interpersonal rapport of the learners, even though not very congruent with Cagle’s (1998) findings which showed high correlations between efficacy and interpersonal rapport and intellectual excitement, these are the two components related to learners in general.The largest number of significant correlations in this study went to the correlations between perfectionism and other variables whereas the correlation of perfectionism and self-efficacy showed only a number of low correlations with each other. In addition, in most cases, the correlations among perfectionism and motivation and other variables were positive and high.
There has been a clear-cut relationship between the three variables of this study so far. Thus, the current study can add to the literature on perfectionism, motivation and self-efficacy. Based on the findings of this study, one can conclude that there is a relationship between these variables two by two.
The findings of this study can be useful if we want to help teachers develop and improve their efficacy and their perfectionism. The present study can, therefore, help researchers and teacher educators recognize the relationship in their classes. Consideration of individual differences is a must for any language teachers.
The subsequent suggestions arising from this study are presented with the hope that other researchers will find them interesting enough to pursue in the future, as a research starts where another has ended and ends where another starts.
1) In order to obtain more generalizable results, this research can be replicated among different samples not necessarily the same level or age.
2) Other age groups can be investigated too.
3) Other studies can be carried out to investigate the effects of the variables and not necessarily investigating the relationships among them that were not measured focally in the present study.
4) Since the present study focused on Iranian participants, similar studies could be done with other nationalities.
5) A study can be done to see whether specifically learner’s age has any significant effect or not.
REFERENCES
Bandura, A. (1995). Self-efficacy.In A. S. R. Manstead& M. Hewstone (Eds.), Blackwell encyclopedia of social psychology (pp. 453-454). Oxford: Blackwell.
Broday, S.F. (1988). Perfectionism and Millon Basic Personality Patterns. Psychological Reports, 63, 791-794.
Brophy, J. (1996). Working with perfectionist students. ERIC Clearinghouse. Retrieved from: http://www.vtaide.com/png/ERIC/Perfectionist-Students.htm
Brouwers, A., &Tomic, W. (2002). Teacher burnout, perceived self-efficacy in classroom management, and student disruptive behavior in secondary education. Curriculum and Teaching, 14, 7–26.
Brouwers, A., &Tomic, W. (2000). A longitudinal study of teacher burnout and perceived self-efficacy in classroom management. Teaching and Teacher Education,16, 239– 253.
Chu, A. H. ,& Choi, J. N. (2005). Rethinking procrastination: Positive effects of “active” procrastination on attitudes and performance. Journal of Social Psychology. Retrieved from HighBeam database.
Ellis, A. (2002). The Role of Irrational Beliefs in Perfectionism. In G.L. Flett & P.L. Hewitt, (Eds.). Perfectionism: Theory, Research and Treatment (pp. 217-229). Washington, DC: American Psychological Association.
Frost, R.O., & Marten, P.A. (1990). Perfectionism and Evaluative Threat. Cognitive Therapy and Research, 14, (6), 559-572.
Goddard, R. D., & Goddard, Y. L. (2001). A multilevel analysis of the relationship between teacher and collective efficacy in urban schools. Teacher and Teacher Education, 17, 807-818.
Hewitt, P.L., Flett, G.L., & Weber, C. (1994).Dimensions of Perfectionism and Suicide Ideation. Cognitive Therapy and Research, 18, (5), 439-459.
Kurz, T. & Knight, S. (2004). An exploration of the relationship among teacher efficacy, collective teacher efficacy, and goal consensus. Learning Environments Research,
7(2), 111-128.
Maslach, C., & Jackson, S.E. (1981).The measurement of experienced burnout. Journal of Occupational Behavior, 2, 99-113.
Shafran, R., Cooper, Z., & Fairburn, C.G. (2002). Clinical Perfectionism: A Cognitive-Behavioural Analysis. Behavior Research and Therapy, 40, 773-791.
Scholz, U., Gutiérrez-Doña, B., Sud, S., &Schwarzer, R. (2002). Is general self-efficacy a universal construct? Psychometric findings from 25 countries. European Journal of Psychological Assessment, 18, 242–251.
Schwarzer, R., & Jerusalem, M. (1995). Generalized Self-Efficacy scale. In J. Weinman, S. Wright, & M. Johnston, Measures in health psychology: A user’s portfolio. Causal
and control beliefs (pp. 35-37). Windsor, UK: NFER-NELSON.
Schwarzer, R., &Hallum, S. (2008). Perceived teacher self- efficacy as a predictor of job stress and burnout: Mediation analyses. Applied Psychology, 57(s1), 152-171. Slaney, R. B., Mobley, M., Trippi, J., Ashby, J. S., & Johnson, D. G. (1996). The Almost Perfect
Scale–Revised. Unpublished manuscript. The Pennsylvania State University,
University Park.
Tangney, J.P. (2002). Perfectionism and the Self-Conscious Emotions: Shame, Guilt, Embarrassment, and Pride. In G.L. Flett& P.L. Hewitt, (Eds.). Perfectionism: Theory, Research and Treatment. P 199-215. Washington, DC: American Psychological Association.