Issues
ISSN: 2146-4138
available at http: www.econjournals.com
International Journal of Economics and Financial Issues, 2016, 6(4), 1650-1656.
A Panel Data Analysis of Capital Structure Determinants: An
Empirical Study of Non-Financial Firms in Oman
Dharmendra Singh*
Department of Business and Economics, Modern College of Business and Science, Oman. *Email: [email protected]
ABSTRACT
The aim of this research paper is to examine the firm-specific determinants of the capital structure for non-financing companies of Oman. Based on the existing literature and theories of capital structure, the probable determinants of capital structure are identified. The analysis is performed using panel data techniques; fixed and random effects, for a sample of 61 companies listed on the Muscat Securities Market during 2011-2015. The results suggest that tangibility, profitability and liquidity are having negative relationship with the leverage, whereas firm size and growth opportunity are positively related to the leverage. Non-debt tax shields do not appear to be significantly related to leverage of Omani firms. Pecking order theory is most successful in explaining the determinants of capital structure of the Omani companies. The results of this paper suggest that findings are consistent with the capital structure studies on other developed and developing countries. The study has important policy implications for the finance managers of the firms in Oman.
Keywords: Leverage, Determinants, Capital Structure, Oman
JEL Classification: G30
1. INTRODUCTION
The selection of capital structure has been one of the most vital
and significant strategic financial decisions of the firms. After the seminal work of Modigliani and Miller (1958), there has been a
consistent and focused debate on the relevance of capital structure
and the factors which determine the capital structure of a firm. The capital structure i.e. the combination of debt and equity is a crucial decision for all the firms as it affects the cost of capital and also the financial risk on it. By increasing the amount of
debt capital the cost of capital decreases but this cheap capital
to the firm also brings in financial risk and reduces the flexibility
of changing capital structure further. Therefore, one of the most fundamental questions of research has been whether there exists
a unique combination of debt and equity capital which maximizes the firm value, known as the optimal capital structure and if so, then what factors could influence a firm’s capital structure.
There have been some theories on the financing pattern of the firms and research done to verify the existence of optimal capital structure. The trade-off theory was developed by Modigliani and Miller in 1963 after that Jensen and Meckling in 1976 developed
another theory on capital structure based on the agency problem titled as the agency theory. After the agency theory, pecking order theory was developed by Myers and Majluf in 1984. There were many studies conducted on testing the validity of capital structure theories but they also failed to get a concrete outcome. Shyam-Sunder and Myers (1999) reject the trade-off theory and conclude that the pecking order model has much greater explanatory power, Fama and French (2002) find that both theories can explain some aspects of a company’s financing behavior, and neither can be rejected or uniformly accepted. In the past, many researchers have worked on the determination of optimal capital structure, but they were not successful in their efforts. The majority of the
research has been the determination of the factors affecting the
capital structure and the firm both firm-specific and economic.
There is no consensus on the determinants of the capital structure
of the firms, or whether firms have an optimal capital structure.
The aim of this study is to carry out an empirical research, using panel data methodology, to determine the firm-specific factors affecting the capital structure decisions of finance firms in Oman. Only non-financial firms are considered for the analysis as non-financial firms have
to the literature on capital structure in several ways. First, the majority of studies are based on the developed market; meager research has been done on developing nations particularly nations like Oman. The capital market of Oman is not that much developed and vast like developed nations and other developing nations like India. Reach to capital market affects the financing pattern of firms or its capital structure. Secondly, the economy is mainly oil dependent thirdly bankruptcy cost and laws are different and also the tax structure is different as compared to other countries. All these factors make Oman a different country, and that is why this paper will certainly
add value to the existing literature.
The present study attempts to fill in the gap on capital structure evidence from Oman, by re-visiting the issues of capital structure decisions in a developing and not much-researched country like Oman. The remainder of this paper is organized as follows: The
second section provides the review of literature and theories on
capital structure decisions of the firms; the third section discuss about firm specific determinants of capital structure; the fourth section talks about sample data and the research model, the fifth section provides results of empirical analysis, and the last section provides the concluding remarks.
2. THEORETICAL REVIEW
The theory of capital structure developed by Modigliani and Miller (1958), confirmed that under certain assumptions, value of the firm is independent of its capital structure. After the seminal work
of Modigliani and Miller, capital structure research has focused
on the relevance of financial decisions with the relaxation of the assumptions given by Modigliani and Miller. Capital structure
theories have been extended to incorporate additional factors,
such as taxes, bankruptcy cost, agency costs, and asymmetric
information issues.
2.1. Trade-off Theory
The theory of trade-off was developed by Kraus and Litzenberger (1973). As mentioned in Amidu (2007), trade-off theory explains that corporate should consider a reasonable debt and equity ratio to maximize firm value as debt is a cheap source of financing. This theory suggests that manager should strike a balance between
the tax savings from increase in debt capital with the increase
in probability of financial distress. Beattie et al. (2004), in the trade-off theory, companies are said to operate with a target capital structure at which the costs and benefits of issuing debt are balanced. Thus, the trade-off theory established a theoretical framework for explaining the term “optimal capital structure” of the firms.
2.2. Pecking Order Theory
As an alternative to the trade-off model, the pecking order theory of capital structure suggests that firms prefer internal financing. Pecking order theory is the consequence of asymmetric information between firm insiders and outsiders (Myers, 1984). Pecking theory suggests that firms prefer to use inside generated funds, i.e., retained earnings over external finance and only when internal funds are not sufficient to finance the growth; firms may go for external financing.
Therefore, highly profitable firms that make high profits are anticipated to use lower debt capital than those that are not very profitable. Beattie et al. (2004), according to this model there is
no concept of target capital structure.
2.3. Agency Cost Theory
In another perspective, Jensen and Meckling (1976) developed the study of Modigliani and Miller (1963) and presented the theory of agency costs. According to Jensen and Meckeling (1976), there is an optimal combination of equity and debt at which the agency cost will be at its minimum. Agency cost is the monitoring and control cost on managers (agents of shareholders), which is because of conflict of interest between shareholders and managers. According to Moosa and Li (2012), an optimal capital structure can be determined by minimizing the agency cost. The managers might act in a different way under different capital structure (Qiu and La, 2010). The increase in leverage increases interest payments which in turn can reduce the agency problem, as the managers will try to operate the firm with full efficiency to meet the interest obligation because they worried about losing their job (Abdul Jamal et al., 2013).
3. DETERMINANTS OF CAPITAL
STRUCTURE
The dependent variable in the study is the degree of leverage of the company. The existing literature has different explanation for the level of in deftness’. MM theory recommends a capital structure to be defined regarding the market value of debt and equity. However, market value measurement is difficult and not adopted by many researchers (Myers, 1977). Rajan and Zingales (1995), Xu (2012) and Serrasqueiro and Rogão (2009) identify the debt by the ratio of total liabilities to total assets. Gaud et al. (2005), in the research on non-financial companies, adopted the ratio of total liabilities over total equity as a proxy of leverage. In the present study, total debt ratio (total debt divided by total assets) as a proxy for the capital structure has been used for listed firms of Oman.
3.1. Tangibility (TANG)
The presence of tangible assets affects the capital structure of a
company and its value in the event of bankruptcy. As compared to intangible assets, tangible assets don’t lose their value in the event of bankruptcy. The trade-off theory states that there is a positive
relationship between measures of leverage and the proportion of
tangible assets in a firm. However, the agency model predicts a
negative relationship between the proportion of tangible assets
and leverage. According to the theory of pecking order, firms with not many tangible assets are more sensitive to informational asymmetries. All these firms will prefer debt financing rather than equity when the external finance is required.
Companies having a higher percentage of tangible assets are less
prone to bankruptcy risk as tangible assets can be converted into cash without significant loss in value (Md-Yusuf et al., 2013). Literature has mixed results on the relationship of TANG of assets with firm’s leverage. According to Rajan and Zingales (1995), TANG of assets has a positive relationship with the firm’s leverage. The results of Chen (2003), Mukherjee and Mahakud (2012) and Chiang et al. (2010) also confirm the positive relationship between a firm’s leverage and the TANG of its assets. On the other hand, for example, Huang and Song (2002), Smith (2012) and Bayrakdaroğlu et al. (2013) observed a negative association between TANG and leverage. In the present study percentage of total fixed assets to total assets has been used to measure TANG of the firm.
3.2. Profitability (PROF)
PROF plays an important role in leverage decisions as profits
lead to retained earnings and other reserves which are used as
an alternative source of financing. From the framework of the pecking-order theory, companies with higher profits have a lesser need for external financing and therefore must have a lower leverage. Again with PROF, there is a lack of consistency between capital structure theories available. Trade-off theory predicts that companies with higher PROF usually have higher leverage to
shield income from taxes.
Again, the empirical evidence on the issue is mixed. Authors like Titman and Wessels (1988), Harris and Raviv (1991), Rajan and Zingales (1995), Qiu and La (2010), (Booth et al., 2001) and Noulas and Genimakis (2011) reported a significant negative relationship between the PROF and leverage. While Jensen et al. (1992), Ooi (1999), and Mallikarjunappa and Goveas (2007) find a positive relationship between leverage and PROF. Following Titman and Wessels (1988) and De Jong et al. (2008), present study defines PROF as earnings before interest and taxes divided by total assets.
3.3. Size
Firm size (SIZE) is one of the most commonly used determinants of the capital structure of a company. The size of a company affects the ability and reach of the company in obtaining easy and low-cost debt financing (Sayilgan et al., 2006). According to the trade-off model, bigger firms are likely to have a higher debt capital as generally they have a better credit rating as compared to small companies. Bigger firms have an advantage over smaller firms in accessing credit markets and better-negotiating power at the time of borrowing (Wiwattanakantang, 1999). However, the pecking order theory states that size and debt level has a negative relationship. Large companies have more stability, less volatility in cash flow and can exploit economies of scale (Gaud et al., 2005).
In the literature two variables have been used to represent the
company size first “logarithm of sales” and second “logarithm of total assets.” In the present study logarithm of total assets is used as a proxy of company size assets (Padron et al., 2005).
3.4. Growth Opportunity
There is a divergent view on the relationship between capital
structure and growth opportunities (GRO) of companies. The
trade-off theory suggests that leverage and growth opportunity has a negative relationship. However, the pecking order theory states that relationship between growth opportunity and leverage
can be positive, as companies having higher growth would go for
debt capital rather than equity capital when the internal funding is not sufficient. The empirical evidence on the relationship between leverage and GRO are also not clear. Authors like, Rajan and Zingales (1995), Chen et al., (1997), Abbad and Zaluki (2012), discover a negative relationship between GRO and leverage. On the other hand, Bevan and Danbolt (2001), Ameer (2013) discover
a positive relationship between growth and leverage.
In the literature, the growth opportunity has been measured by different ways; authors like Rajan and Zingales (1995), Gaud et al. (2005) and Sbeiti (2010) have used the market to book ratio as a proxy of growth opportunity. Titman and Wessels (1988) measured growth opportunity as the percentage change in total assets. In the present study percentage change in the total assets is used as a measure of growth opportunity.
3.5. Liquidity (LIQ)
LIQ in assets is an ease of converting assets into cash without affecting its value. According to the theory of Pecking order firms with high liquid assets will borrow less. However, according to trade-off theory, the companies with a higher amount of
liquid assets are supposed to borrow more because of their
repaying capacity. Therefore, trade-off theory suggests a positive relationship between LIQ and leverage whereas; the pecking order theory suggests a negative relationship. If a negative relation is found, this means firm prefers to follow internal financing rather than external financing. Studies like Deesomsak et al. (2004), Viviani (2008) were consistent with results of pecking order theory. In the present study current ratio i.e., ratio of current assets over current liability is used to measure LIQ.
3.6. Non-debt Tax Shield (NDTS)
Tax shield is a saving on tax which increases with the increase in debt percentage in the capital structure. NDTS is the tax reduction
due to depreciation, amortization, and long-term deferred expenses. According to DeAngelo and Masulis (1980), NDTS are the alternate of the tax shields on debt financing. Therefore, firms with higher NDTSs are predictable to use less debt in their
capital structure. Wald (1999), Viviani (2008) and Deesomsak et al. (2004) have reported a significant negative relationship between debt capital and NDTSs. Whereas, Bradley et al. (1984), Bauer (2004) have reported a negative relationship between leverage and NDTS. So, for this variable empirical findings are not in one direction. In the present study, NDTS is represented by the ratio of corporate income tax to operating profit.
4. DATA AND RESEARCH METHODOLOGY
The objective of this research is to examine the relevance offirmspecific factors like size of the firm, growth in fixed assets, PROF, LIQ, NDTSs, TANG in the determination of the capital
structure of companies in the services and industrial sector listed
securities market was used to run the analysis. The dependent variable (leverage) and the independent variables mentioned above were selected by the available literature and theories on the subject.
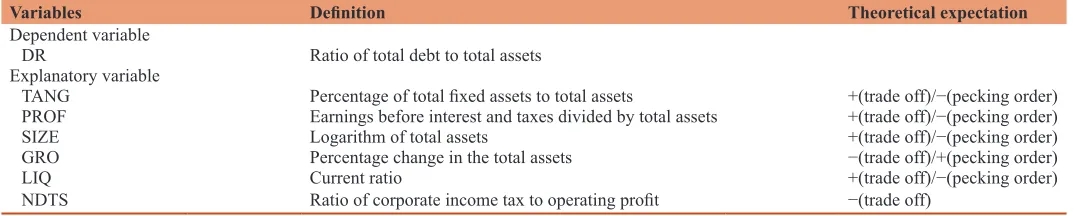
The sample of this study covers 36 out of 44 industrial companies and 25 out of 36 listed service companies by the data availability for the 5 years from 2011 to 2015. The debtequity ratio is different for financial sector companies like banks and other finance companies. Therefore, only non-finance companies were considered for the study. The financial data about the companies was obtained from Handbook of companies published by Muscat Securities Market, 2016. All the variables considered were estimated from the year-end audited financial statements of the companies. Table 1 presents
the definition and expected relationship of all the variables with
leverage.
4.1. Panel Data Analysis
To analyze the effect of firm-specific determinants on the capital structure of the firm panel data analysis is employed. Choice of panel data analysis is always preferable as it is better than cross section and time series analysis. Compared to time series and cross-section analysis, panel data analysis can give better results with small data size. That’s because, the cross observations
collected throughout a period are combined, thus, the number of
observations increases (Sun and Parikh, 2001). Panel data analysis is more efficient as with this technique collinearity among the
predictor variables is reduced and there is a gain in degrees of
freedom. Panel data analysis weakens the interaction between the variables as a resulting in more reliable parameters (Hsiao, 1999). Thus, the analysis makes use of the data which has both time dimension and cross section dimension. The study applies both the methods of panel data; fixed effect and random effect. Finally, the better model was selected by applying Hausman test. The description of the two models fixed effects and the random effects are given by equation (1) and (2) respectively:
DRjt = β0j + β1TANGjt + β2PROFjt + β3SIZEjt + β4GROjt
+ β5LIQjt + β6NDTSjt + μjt (1)
DRjt = β0 + β1TANGjt + β2PROFjt + β3SIZEjt
+ β4GROjt + β5LIQjt + β6NDTSjt + ɛjt + μjt (2)
where DRjt is the measure of leverage of firm j in year t; β0 is a
common y-intercept; TANG, PROF, SIZE, GRO, LIQ, NDTS represent the firm-specific determinants of leverage; ɛjt is the
stochastic error term of firm j at time t; β0j is the y-intercept of firm
j and μjt is the error term of firm j at time t. β1 to β6 are coefficients of the concerned explanatory variables.
5. EMPIRICAL RESULTS
This section presents the various estimation results and the
empirical findings. First, fixed effect model was run on the panel data of 61 companies followed by random effect model using
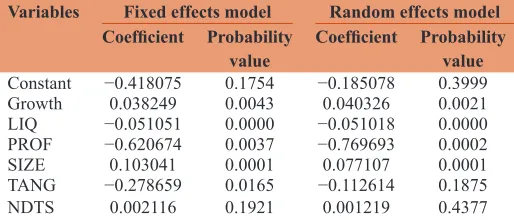
reviews. The results of the two models are presented in Table 2.
According to fixed effect model, out of the explanatory variables selected for the study, the growth rate in total assets, PROF, and LIQ, the size of the company and TANG of assets are the significant determinants of capital structure at 5%. However with random effects model only four out of theses five variables are significant.
To decide between fixed or random effects, the Hausman test was used. The Hausman test selects a more efficient model against a less efficient model by comparing fixed with random effects. The outcome of Hausman test are presented in Table 3, where the null
hypothesis is that the preferred model is random effects and for the alternative hypothesis preferred model is fixed effects.
The above output reveals that fixed effect is to be used, since probability 0.0153 is not larger than 0.05. Since Hausman
specification test has supported fixed effects model so the
further analysis will be based on fixed effect model only. In the present study, PROF is the most dominant determinant of capital structure in this study, with the coefficient value of −0.621. That means the relationship between PROF and leverage is negative which supports Pecking order theory. The result is also consistent with studies of Titman and Wessels (1988), Harris and Raviv (1991), Rajan and Zingales (1995), Qiu and La (2010), (Booth et al., 2001), Noulas and Genimakis (2011), Bayrakdaroğlu et al. (2013).
TANG has proved to be the second most dominant determinant of capital structure in Oman. Like PROF, the TANG of firm’s assets is also negatively related to the capital structure of Omani firms. Theoretically, results are consistent with the agency model
which predicts a negative relationship between the proportion of
tangible assets and leverage. However, results are contrary to the trade-off and Pecking order theory. The logic may explain the reason behind this negative relationship that firms with a higher proportion of fixed assets have greater profit potential and depend on more on internal financing. Overall the results are consistent
Table 1: Definition of variables
Variables Definition Theoretical expectation
Dependent variable
DR Ratio of total debt to total assets
Explanatory variable
TANG Percentage of total fixed assets to total assets +(trade off)/−(pecking order)
PROF Earnings before interest and taxes divided by total assets +(trade off)/−(pecking order)
SIZE Logarithm of total assets +(trade off)/−(pecking order)
GRO Percentage change in the total assets −(trade off)/+(pecking order)
LIQ Current ratio +(trade off)/−(pecking order)
NDTS Ratio of corporate income tax to operating profit −(trade off)
with Huang and Song (2002), Smith (2012) and Bayrakdaroğlu et al. (2013), Cornelli et al (1996), Booth et al (2001), Sbeiti (2010), Nivorozhkin (2002) as they all have suggested a negative relationship between TANG and leverage.
Size is another significant determinant of capital structure for Omani companies. The relationship of size with capital structure is consistent with the theory of trade-off which believes a positive relationship of size and leverage. The earlier studies consistent with this results are Jin Xu (2012), Gaud et al., (2005) and Graham et al., (1998). According to Graham et al., (1998) large size of the company helps them to negotiate in a better manner, and that is why they have cheap and easy access to the debt market.
The relationship between growth rate and leverage is positive
and significant for the sample companies. The present findings support pecking order theory and its notion that companies having higher growth would prefer debt finance rather than equity finance when the internal funding is not sufficient. The present study also supports the results of Jensen (1986) on the theory of agency costs
to recommend that the companies with higher growth rates have
higher leverage to minimize agency costs between managers and shareholders as debt capital is used to control managers. Results are consistent with Bevan and Danbolt (2001), Sayilgan et al. (2006), Ameer (2013) find a positive relationship between growth
and leverage.
Another significant independent variable in this study is LIQ, having a negative relationship with leverage. The study supports the pecking order theory which suggests a negative relationship. The negative relationship confirms that companies with high LIQ
in Oman are preferring usage of internal funds rather than external
debt financing. However, trade-off theory confers that firms with high LIQ can easily go for debt finance as it is easy for them to payoff interest on time (Abdul Jamal et al., 2013). In the existing literature, authors like Deesomsak et al. (2004), Mat Kila and Wan Mansor (2008), Sbeiti (2010), and Hossain and Ali (2012) had the same result on LIQ.
6. CONCLUSION
In this study, an attempt was made to investigate the determinants of capital structure of 61 non-financing firms listed on the Muscat Securities market, Oman during 2011-2015. The investigation is performed using panel data techniques, namely, fixed effects, and random effects. This study has employed the debt ratio as a dependent variable. According to the results of empirical analysis, PROF, TANG, and LIQ are negatively associated with the leverage. These results are consistent with the study of Hossain and Ali (2012) conducted on Bangladesh, Sbeiti (2010) study conducted on GCC firms and Qiu and La (2010) study conducted on Australian firms. The findings on PROF and LIQ are also consistent with the pecking order theory. However, in the case of TANG, results are contrary to the trade-off and Pecking order theory, are consistent with the agency model.
The SIZE and growth rate are positively related to leverage of firms in Oman, which is consistent with Forte et al. (2013), a study conducted on Brazilian firms. The relationship of SIZE with capital structure is consistent with the theory of trade-off theory. Whereas, in the case of growth rate, findings support pecking order theory
and its notion that companies having higher growth would prefer
debt finance rather than equity finance when the internal funding is not sufficient. Moreover, a significant negative impact of LIQ on the debt ratio indicates that firms that have high LIQ ratio tend to have lesser leverage as they are in a position to generate high cash inflows which can be used to finance investments. This association of LIQ with leverage confirms to the prediction of pecking order theory. The findings also confirm some earlier studies such as Viviani (2008), Sheikh and Wang (2011), and Abdullah (2005). Contrary to the theoretical expectations, NDTS resulted as an insignificant variable for the sample firms. NDTS is a positive and significant determinant of capital structure in non-tax Arab economies; however, for firms operating in countries that have a tax system we find that NDTS is not significant (Barakat and Rao, 2003). Therefore, for NDTS, the behavior Omani firms are
similar to tax economies.
Through this study, it has been proved that pecking order theory
is most successful in explaining the determinants of capital
structure of the Omani companies. Hence, it could be concluded that implementation of pecking order theory is more appropriate to companies in Oman. However, trade-off theory and agency cost
cannot be rejected because of the right prediction of the positive
sign of SIZE variable and negative prediction of TANG. The results of this paper suggest that most of the firm-specific determinants of
capital structures are same as in other developed and developing
countries. The study has important policy implications for the finance managers of the firms in Oman. The finance managers should consider these determinants as a benchmark in decision making related to capital structure.
REFERENCES
Abbad, K.B., Zaluki, N.A. (2012), The determinants of capital structure of Qatari listed companies. International Journal of Academic Research Table 2: Determinants of capital structure in Oman
Variables Fixed effects model Random effects model
Coefficient Probability
value Coefficient Probability value
Constant −0.418075 0.1754 −0.185078 0.3999
Growth 0.038249 0.0043 0.040326 0.0021
LIQ −0.051051 0.0000 −0.051018 0.0000
PROF −0.620674 0.0037 −0.769693 0.0002
SIZE 0.103041 0.0001 0.077107 0.0001
TANG −0.278659 0.0165 −0.112614 0.1875
NDTS 0.002116 0.1921 0.001219 0.4377
Source: Author’s self-estimation. NDTS: Non-debt tax shield, TANG: Tangibility, PROF: Profitability, LIQ: Liquidity
Table 3: Result of Hausman test
Chi-square statistic Probability
17.342435 0.0153
in Accounting, Finance and Management Sciences, 2, 93-108. Abdul Jamal, A.A., Geetha, C., Mohidin, R., Abdul Karim, M.R., Lim,
T.S., Chang, V. (2013), Capital structure decisions: Evidence from large capitalized companies in Malaysia. Interdisciplinary Journal of Contemporary Research in Business, 5(5), 30-49.
Abdullah, M. (2005), Capital structure and debt maturity: Evidence from listed companies in Saudi Arabia. Journal of Business and
Economics, 11, 15-33.
Ameer, R. (2013), Financial liberalization and firms’ capital structure adjustments evidence from Southeast Asia and South America. Journal of Economics and Finance, 37(1), 1-32.
Amidu, M. (2007), Determinants of capital structure of banks in Ghana: An empirical approach. Baltic Journal of Management, 2, 67-79. Barakat, M., Rao, R.P. (2003), The Role of Taxes in Capital Structure:
Evidence from Taxed and Non-taxed Arab Economies (Munich Personal RePEc Archive - MPRA Paper No. 25472). Munich: University Library of Munich.
Bauer, P. (2004), Determinants of capital structure: Empirical evidence from the Czech Republic. Czech Journal of Economics and Finance, 54(2), 2-21.
Bayrakdaroğlu, A., Ege, I., Yazıcı, N. (2013), A panel data analysis of capital structure determinants: Empirical results from Turkish capital market. International Journal of Economics and Finance, 5(4), 131-140.
Beattie V., Goodacre A., Thomson S.J. (2004), Diversity and determinants of corporate financing decisions: survey evidence. Working Paper, University of Stirling.
Bevan, A.A., Danbolt, J. (2001), On the Determinants and Dynamics of UK Capital Structure, Working Paper Series, Department of Accounting & Finance University of Glasgow. p1-37.
Booth, L., Aivazian, V., Demirguc-Kunt, A., Maksimovic, V. (2001),
Capital structures in developing countries. The Journal of Finance,
56, 87-130.
Bradley, M., Jarrell, G.A., Kim, E.H. (1984), On the existence of an optimal capital structure: Theory and evidence. Journal of Finance, 39, 857-878.
Chen, C.J.P., Cheng, C.S.A., Jia, H., Jason, K. (1997), An investigation of
the relationship between international activities and capital structure.
Journal of International Business Studies, 28, 547-563.
Chen, J.J. (2003), Determinants of capital structure of Chinese-listed companies. Journal of Business Research, 57, 1341-1351.
Chiang, Y.H., Cheng, E.W.L., Lam, P.T.I. (2010), Epistemology of capital structure decisions by building contractors in Hong Kong. Construction Innovation, 10, 329-345.
Cornelli, F., Portes, R., Schaffer, M. (1996), The Capital Structure of Firms in Central and Eastern Europe. CEPR Discussion Paper, 1392. p1-35.
De Jong, A.D., Kabir, R., Nguyen, T.T. (2008), Capital structure around the world: The roles of the firm - And country-specific determinants. Journal of Banking and Finance, 32(9), 1954-1969.
DeAngelo, H., Masulis, R.W. (1980), Optimal capital structure under
corporate and personal taxation. Journal of Financial Economics,
8, 3-29.
Deesomsak, R., Paudyal, K., Pescetto, G. (2004), The determinants of capital structure: Evidence from the Asia Pacific region. Journal of Multinational Financial Management, 14, 387-405.
Fama, E.F., French, K.R. (2002), Testing trade-off and pecking order predictions about dividends and debt. The Review of Financial Studies, 15(1), 1-33.
Forte, D., Barros, L.A., Nakamura, W.T. (2013), Determinants of capital structure of small and medium-sized Brazilian enterprises. Brazilian Administration Review, 10, 347-369.
Gaud, P., Jani, E., Hoesli, M., Bender, A. (2005), The capital structure of swiss companies: An empirical analysis using dynamic panel data.
European Financial Management, 11(1).
Graham, J.R., Lemmon, M.L., Schallheim, J.S. (1998), Debt, leases, taxes, and the endogeneity of corporate tax status. The Journal of Finance, 53(1), 131-162.
Harris, M., Raviv, A. (1991), The theory of capital structure. Journal of Finance, 46(1), 297-355.
Hossain, M.F., Ali, A.M. (2012), Impact of firm-specific factors on capital structure decision: An empirical study of Bangladeshi companies. International Journal of Business Research and Management, 3(4),
163-182.
Hsiao, C. (1999), Analysis of Panel Data. Cambridge: Cambridge University Pres.
Huang, S.G.H., Song, F.M. (2002), The Determinants of Capital Structure: Evidence from China. HIEBS (Hong Kong Institute of Economics and Business Strategy) Working Paper. Available from: http://www. dx.doi.org/10.2139/ssrn.320088.
Jensen, M. (1986), Agency cost-free cash flow, corporate finance, and takeovers. American Economic Review, 76(2), 323-329.
Jensen, M., Solberg, D., Zorn, T. (1992), Simultaneous determination of
insider ownership, debt, and dividend policies. Journal of Financial
and Quantitative Analysis, 27, 247-261.
Jensen, M.C., Meckling, W.H. (1976), Theory of the firm: Managerial behavior, agency costs and ownership structure. Journal of Financial Economics, 3(4), 305-360.
Kraus, A., Litzenberger, R.H. (1973), A state-preference model of optimal financial leverage. Journal of Finance, 33, 911-922.
Mallikarjunappa, T., Goveas, C. (2007), Factors determining the capital
structure of pharmaceutical companies in India. The Icfai Journal
of Applied Finance, 13, 56-72.
Mat Kila, S., Wan Mansor, W. (2008), Capital structure and firm characteristics: Some evidence from Malaysian companies. Journals of Applied Finance, 15(7), 19-25.
Md-Yusuf, M., Mohamad Yunus, F., Md-Supaat, N.F.L. (2013), Determinants of capital structure in Malaysia electrical and electronic sector. World Academy of Science, Engineering, and Technology, 78. Available from:
http://www.waset.org/journals/waset/v78/v78-156.pdf.
Modigliani, F., Miller, M.H. (1958), The cost of capital, corporation finance, and the theory of investment. American Economic Review, 48(3), 261-297.
Modigliani, F., Miller, M.H. (1963), Corporate income taxes and cost of capital: A correction. American Economic Review, 53, 443-453. Moosa, I., Li, L. (2012), Firm-specific factors as determinants of capital
structure: Evidence from Indonesia. Review of Pacific Basin Financial Markets and Policies, 15(2), 1150007-11500024. Mukherjee, S., Mahakud, J. (2012), Are trade–off theory and pecking
order theories of capital structure mutually exclusive. Journal of Management Research, 12, 41-55.
Myers, S. (1977), Determinants of corporate borrowing. Journal of Financial Economics, 5, 147-175.
Myers, S.C. (1984), The capital structure puzzle. The Journal of Finance, 39(3), 575-592.
Myers, S.C., Majluf, N.S. (1984), Corporate financing and investment decisions when firms have information that investors do not have. Journal of Financial Economics, 13(2), 187-221.
Nivorozhkin, E. (2002), Capital structures in emerging stock markets: The case of hungary. The Developing Economies, XL(2), 87-166. Noulas, N., Genimakis, G. (2011), The determinants of capital structure
choice: Evidence from Greek listed companies. Applied Financial Economics, 21, 379-387.
Ooi, J. (1999), The determinants of capital structure: Evidence on UK property companies. Journal of Property Investment and Finance, 17(5), 464-480.
Martel, V., Sales, L.J. (2005), Determinant factors of leverage: An empirical analysis of Spanish corporations. Journal of Risk Finance, 6(1), 60-68.
Qiu, M., La, B. (2010), Firm characteristics as determinants of capital structures in Australia. International Journal of the Economics of Business, 17, 277-287.
Rajan, R.G., Zingales, L. (1995), What do we know about capital
structure? Some evidence from international data. The Journal of
Finance, 50(5), 1421-1460.
Sayilgan, G., Karabacak, H., Kucukkocaoglu, G. (2006), The firm-specific determinants of corporate capital structure: Evidence from Turkish
panel data. Investment Management and Financial Innovations, 3,
125-137.
Sbeiti, W. (2010), The determinants of capital structure: Evidence from the GCC countries. International Research Journal of Finance and Economics, 47, 54-79.
Serrasqueiro, Z.M., Rogao, M.C. (2009), Capital structure of listed Portuguese companies: Determinants of debt adjustment. Review of Accounting and Finance Journal, 8(1), 54-75.
Sheikh, N.A., Wang, Z. (2011), Determinants of capital structure: An empirical study of firms in manufacturing industry of Pakistan. Managerial Finance, 37, 117-133.
Shyam-Sunder, L., Myers, S. (1999), Testing static trade-off against pecking order models of capital structure. Journal of Financial Economics, 51(2), 219-244.
Smith, G.P. (2012), Capital structure determinants for tax-exempt organizations: Evidence from the UK. Financial Accountability and Management, 28(2), 143-163.
Sun, H., Parikh, A. (2001), Exports, inward foreign direct investment (FDI) and regional economic growth in China. Regional Studies, 35(3), 187-196.
Titman, S., Wessels, R. (1988), The determinants of capital structure
choice. Journal of Finance, 43, 1-18.
Viviani, J. (2008), Capital structure determinants: An empirical study of French companies in the wine industry. International Journal of Wine Business Research, 20(2), 171-194.
Wald, J.K. (1999), How firm characteristics affect capital structure: An international comparison. Journal of Financial Research, 22(2), 161-187.
Wiwattanakantang, Y. (1999), An empirical study on the determinants of capital structure of Thai firms. Pacific-basin finance. Journal, 7(3-4), 371-403.