doi:10.3926/jiem.2009.v2n2.p360-386 ©© JIEM, 2009 – 2(2): 360-386 - ISSN: 2013-0953
Vehicle-based interactive management with multi-agent
approach
Yee Ming Chen, Bo-Yuan Wang
Department of Industrial Engineering and Management, Yuan Ze University
(TAIWAN, ROC)
[email protected]; [email protected]
Received May 2009 Accepted September 2009
Abstract: Under the energy crisis and global warming, mass transportation becomes more
important than before. The disadvantages of mass transportation, plus the high flexibility
and efficiency of taxi and with the revolution of technology, electric-taxi is the better
transportation choice for metropolis. On the other hand, among the many taxi service
types, dial-a-ride (DAR) service system is the better way for passenger and taxi. However
the electricity replenishing of electric-taxi is the biggest shortage and constraint for DAR
operation system. In order to more effectively manage the electric-taxi DAR operation
system and the lots of disadvantages of physical system and observe the behaviors and
interactions of simulation system, multi-agent simulation technique is the most suitable
simulation technique. Finally, we use virtual data as the input of simulation system and
analyze the simulation result. We successfully obtain two performance measures: average
waiting time and service rate. Result shows the average waiting time is only 3.93 seconds
and the service rate (total transport passenger number / total passenger number) is
37.073%. So these two performance measures can support us to make management
decisions. The multiagent oriented model put forward in this article is the subject of an
application intended in the long term to supervise the user information system of an urban
transport network.
doi:10.3926/jiem.2009.v2n2.p360-386 ©© JIEM, 2009 – 2(2): 360-386 - ISSN: 2013-0953
1 Introduction
To resist global warming, mass transportation plays an important role in metropolis (Government of Hong Kong, 2005). Public can travel by taking mass transportation rather than driving a car. In this way, public can reduce the CO2 generation and air pollution (GreenPartyTaiwan, 2007). In order to reduce the operation cost of mass transportation, Transportation Company has to abandon the flexibility and efficiency (Wu, 2006). However taxi just compensates the disadvantages of mass transportation, because it has the features of high flexibility and efficiency (GreenPartyTaiwan, 2007). So far, most of passengers stand beside road and wait for a taxi. In this condition, there are three disadvantages. First, passenger doesn’t know how long he/she has to wait until a taxi passes by. Secondly, passenger is not sure the coming taxi is free or not. Thirdly, taxi needs to go around and look for passenger. Hence the operation utility is too low so that causes the energy waste (Wu, 2005). Contrary, dial-a-ride (DAR) system is a good solution to solve this problem. In DAR system, passengers use wireless communication tool (mobile phone) to call for a pick-up and delivery service-to-service center (control center). Then, service center assigns an idle taxi to perform the task. Using this kind of service system, passenger doesn’t need to wait longer than before. And taxi driver can save the taxi energy. Hence, Dial-a-ride system is very important in taxi operation system (Wu, 2005). On the other hand, with the technological revolution of power, electric-taxi comes with the tide of fashion (Taiwan Environmental Information Center, 2009; BigSolar, 2005). Electric taxi means a taxi is driven by electricity. It has two advantages. First, for the earth, electric taxi can reduce the air pollution and global warming, because it can’t emit CO2 (the electric taxi we talk about is driven by pure electricity. The pure electricity means that it doesn’t emit CO2 and its source doesn’t involve any organic compound of carbon, like hydrogen-battery. For hydrogen-battery itself, its waste is “water” so it indeed can reduce the emission of CO2. (iCo2l, 2008)). Secondly, for taxi driver, electric-taxi can reduce the fuel cost, especially for oil, due to the cost of replenishing electricity is lower than gas or gasoline. Hence electric taxi is an important transportation for metropolises.
doi:10.3926/jiem.2009.v2n2.p360-386 ©© JIEM, 2009 – 2(2): 360-386 - ISSN: 2013-0953
replenish its’ electricity in the electric station. During the replenishing period, electric-taxi can’t do any task and passenger still waits for service. Under this condition, that will cause the reduction of taxi company’s revenue and passenger satisfaction (GreenPartyTaiwan, 2007). However, revenue and passenger satisfaction are the most important performance measures for Taxi Company. So Electric-taxi Company has to propose some management policies to deal with the electric replenishing problem (Galus et al., 2009). Hence how to manage the electric-taxi DAR operation system becomes a very important problem with management policies (GreenPartyTaiwan, 2007; Taiwan Environmental Information Center, 2009).
In order to manage the electric-taxi DAR operation system, we have to construct an electric-taxi DAR operation simulation system. There is a lack in multi-agent transportation simulation, such as allowing cars move based on shortest path and dispatching operations. In fact, the traffic jams management is considerable for electric-taxi DAR operation system (Ezzedine et al., 2005; Kok & Lucassen, 2007; Lansdowne, 2006; Cubillos et al., 2008). So this paper takes into account the shortages of existing methods to reinforce our multi-agent simulation. On the other hand, due to the impracticable and costly weaknesses of physical system (Ali, 2006), multi-agent simulation technique is the most suitable simulation technique for our research.
The main purposes of this study are as follows: First purpose is to provide a series of management policies to manage the electric-taxi DAR operation system and analyze the phenomenon of simulation. Second purpose is to compensate the shortages of existing methods to reinforce our multi-agent simulation. The main contribution of this paper is that we successfully obtain the performance measures (average waiting time and service rate) to support the decision making for manager.
doi:10.3926/jiem.2009.v2n2.p360-386 ©© JIEM, 2009 – 2(2): 360-386 - ISSN: 2013-0953
2 Literature review
Characteristics Ezzedine et al. (2 005) Lansdow n e (20 0 6)
Kok & Lucas
se n (2 007) Cubillos e t al. (2 008) Seow et al. ( 2 008) Gal u s e t al . (2 0 0 9 ) Our proposed me thod
Being generic * * * * * * *
Being agent-based
simulation * * * * * * *
Multiple (people) to
multiple (cars) simulation * * * * * * *
Taking into account the
energy wasting of cars * *
Taking into account the
change of cars’ velocity * *
Information management
decentralization * * * * *
Hybrid information management (Combining centralization and decentralization)
* *
Taking into account traffic
jam * * *
The traffic jam management (such as allowing cars move that excludes the road which is under traffic jam)
* *
Allowing cars move based
on shortest path * * *
Table 1. “Criteria distinguishing our method from those existing in literature review”.
According to the literature review, this paper lists ten main characteristics (see Table 1). And these characteristics are considerable for vehicle DAR operation system (Cubillos et al., 2008). Moreover, we distinguish our method from those existing methods in literature review. Obviously, these existing methods are incomplete in vehicle DAR operation system. So these shortages can be the improvements of our electric-taxi DAR operation simulation.
3 Electric-taxi DAR operation system
doi:10.3926/jiem.2009.v2n2.p360-386 ©© JIEM, 2009 – 2(2): 360-386 - ISSN: 2013-0953
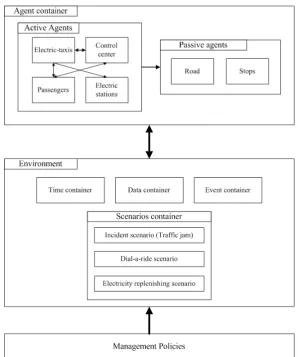
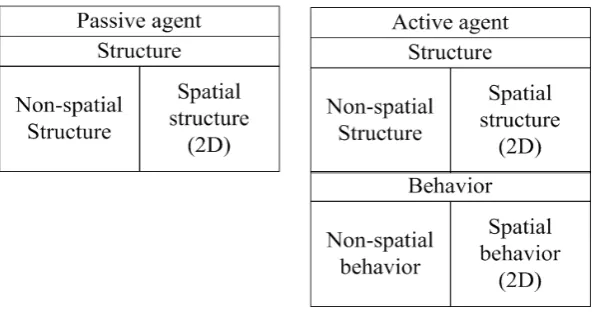
structures and behaviors. Second type is passive agents those only have their structures.
Figure 1. “The framework of electric-taxi DAR operation system”.
The specification of each type of agent is as follows:
Passive Agents (PA): This category of agents represents entities (agents) that have a structure, without a behavior. Usually, a large part of the elements contained in the simulation environment belongs to this category. For example, road is a passive agent, its x and y coordinates belong to spatial structure. And, its id and color belong to non-spatial structure.
doi:10.3926/jiem.2009.v2n2.p360-386 ©© JIEM, 2009 – 2(2): 360-386 - ISSN: 2013-0953
(spatial and non-spatial behaviors). For example, electric taxi is an active agent. Its x and y coordinates belong to spatial structure. Its id and color belong to non-spatial structure. Its moving behavior belongs to spatial behavior. Its information transmitting belongs to non-spatial behavior.
Figure 2. “Passive Agents and Active agents”.
The second part is environment. Environment is composed of time container, data container, event container and scenario container. Time container includes all of the related information and variables. Data container contains all of the related information and variables to support data analysis. Event container has many events to be the triggers of every possible action of each agent. We also design three kinds of scenarios in the scenario container (Figure 1): Incident management (traffic jam), dial-a-ride management and electricity replenishing management. These three kinds of scenarios constitute the underlying scenario of electric taxi DAR operation system. The details of these three kinds of scenarios will be specified in sub-section 3.2. In our data analysis, we want to know how the performance (average waiting time) is via scenario simulation. And then we will make a recommendation and conclusion.
doi:10.3926/jiem.2009.v2n2.p360-386 ©© JIEM, 2009 – 2(2): 360-386 - ISSN: 2013-0953
3.1 The framework of active agents
Following, we will describe the framework of active agent and define each function within the framework of active agent. Through this section, we can construct the framework of each kind of active agent clearly. Although we can’t clearly realize the exact actions, attributes and duties what the agents will have through this framework immediately. However it can convert the abstract structure of each active agent the active agent into a concrete framework. And in this way, we can extract the actions, attributes and duties what the agents will have through this framework further.
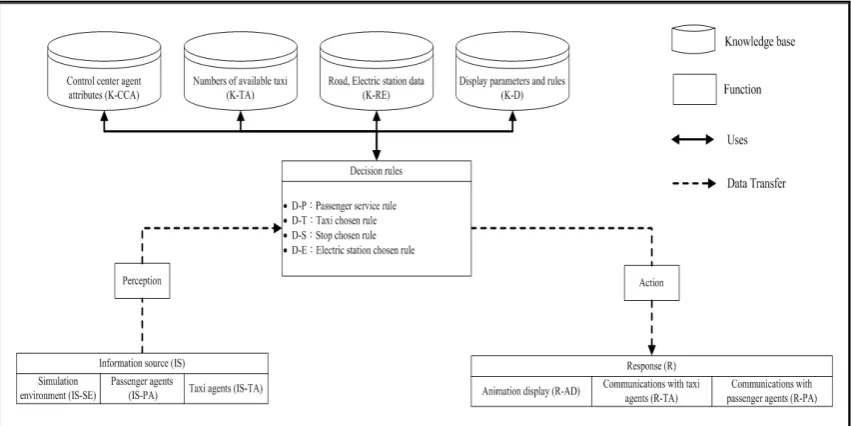
The functions within the framework of active agent:
K: Knowledge base of agent. The knowledge base of agent can help agent make decision more precisely. Some agents have their own knowledge base. Knowledge base consists of a lot of information. Information comes from different kinds of agents. For example, the information of control center comes from passenger and electric taxi. This information makes up the knowledge base of control center. The difference of knowledge base comes from roles (electric taxi, passenger or control center) not types (passive agent or active agent). Different role may have different knowledge base.
IS: Information source. Information source means where the information comes from.
R: Response. Response means the object of action.
D: Decision rules. Decision means the alternatives, mechanisms or algorithm to help agent make proper actions or decisions.
doi:10.3926/jiem.2009.v2n2.p360-386 ©© JIEM, 2009 – 2(2): 360-386 - ISSN: 2013-0953
Figure 3. “The framework of Control Center agent”.
The first and foremost, we specify the framework of active agent through CCA. In figure 3, for perception, we use IS-TA to represent that Control Center agent perceives the information (IS) where comes from Electric-taxi agents (TA). For knowledge base, we use K-TA to represent that Control Center agent owns the knowledge (K) about Electric-taxi agents (TA). For decision rules, we use D-T to represent that Control Center agent owns the decision rule (D) about Electric-taxi agents (T). For action, we use R-TA to represent that Control Center agent responses (R) to Electric-taxi agents (TA). The rest can be deduced by analogy. Following, we specify the framework of each type of agent.
doi:10.3926/jiem.2009.v2n2.p360-386 ©© JIEM, 2009 – 2(2): 360-386 - ISSN: 2013-0953
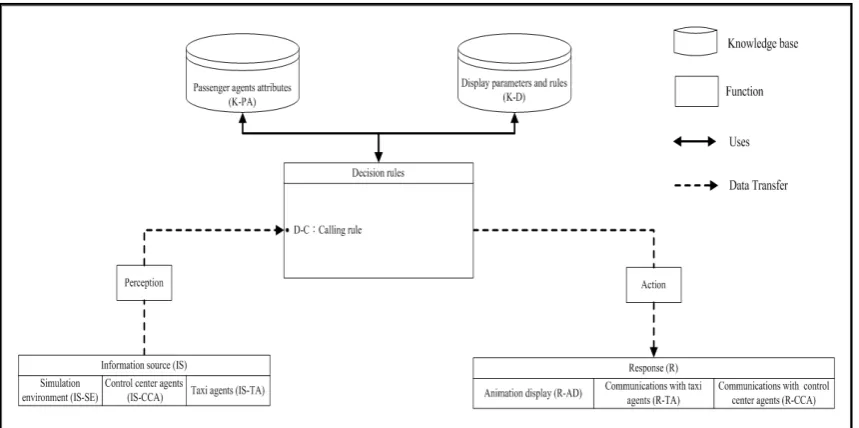
For passenger agents, Electric-taxi agents and Electric station agents, we just describe the difference of PA, TA and EA respectively. Next, we describe the difference of framework of PA to Control Center agent. In figure 4, for perception, PA doesn’t include the information source of PA but PA contains the information source of Control Center agent. For knowledge base, PA doesn’t include the knowledge base of control center, electric-taxi, road and electric station but PA contains the knowledge base of its’ attributes. For decision rules, PA only has a decision rule of calling. For action, PA doesn’t include the response to the Passenger agents but PA contains the response to the Control Center agent.
Figure 4. “The framework of Passenger agent”.
We also describe the difference of framework of TA to Control Center agent. In figure 5, for perception, TA contains the information source of Control Center agent. For knowledge base, TA doesn’t include the knowledge base of control center but TA contains the knowledge base of its’ attributes. For decision rules, TA contains shortest path searching rule, avoid traffic jam rule, electric station chosen rule, replenishing electric rule and stop chosen rule. And only the stop chosen rule is repeated with control center. For action, TA contains the response to the Control Center agent.
doi:10.3926/jiem.2009.v2n2.p360-386 ©© JIEM, 2009 – 2(2): 360-386 - ISSN: 2013-0953
parameters. For decision rules, EA only contains service rule. For action, EA only contains the response to the electric-taxi agent and displayed on the screen via display parameters.
Figure 5. “The framework of Electric-taxi agent”.
Figure 6. “The framework of Electric station agent”.
doi:10.3926/jiem.2009.v2n2.p360-386 ©© JIEM, 2009 – 2(2): 360-386 - ISSN: 2013-0953
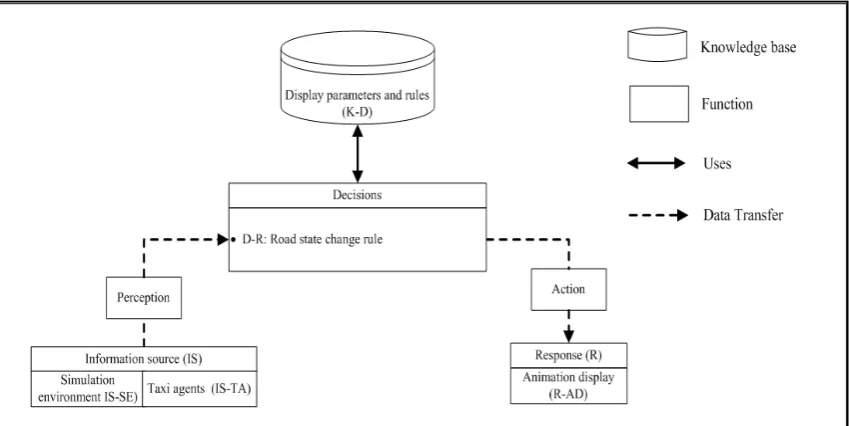
and simulation environment. For knowledge base, RA only contains the knowledge base of display parameters. For decision rules, RA only contains road state change rule. For action, RA only contains the response of displaying on the screen via display parameters.
Figure 7. “The framework of Road agent”.
Figure 8. “The framework of Stop agent”.
doi:10.3926/jiem.2009.v2n2.p360-386 ©© JIEM, 2009 – 2(2): 360-386 - ISSN: 2013-0953
environment. For knowledge base, SA only contains the knowledge base of display parameters. For decision rules, SA only contains stop position transferring rule. For action, SA only contains the response of displaying on the screen via display parameters.
3.2 The interaction processes diagram of scenario
As mentioned above, scenario container has three kinds of scenarios. In this sub-section, we specify the interaction process of each scenario. The three scenarios interaction processes are: (1) dial-a-ride scenario; (2) incident (traffic jam) scenario; and (3) electricity replenishing scenario. The detail of each scenario is described as follows.
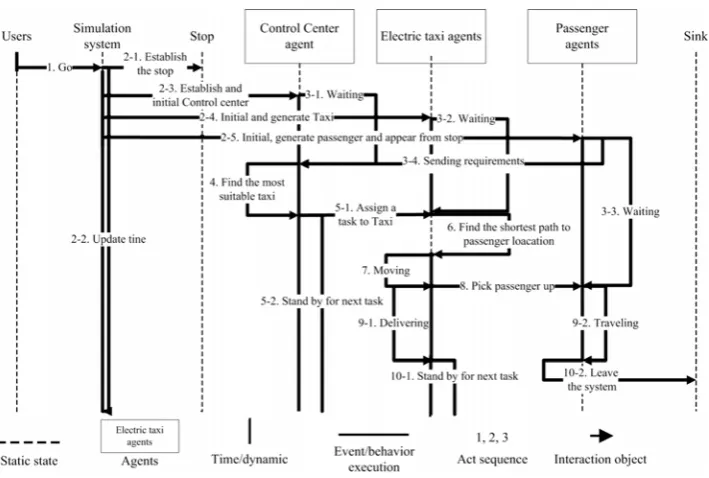
Figure 7 is the dial-a-ride interaction process diagram. We draw an interaction process diagram to help us to concrete the abstractive interaction concept. And we can realize the sequence of interaction between agents so that we can easily construct the scenario with program language in simulation platform. In the scenario interaction processes diagram, a rectangle represents an active agent that also means the executor of an event/behavior. The dotted line represents the state of actor/agent is static, which means actor/agent doesn’t do any action. The straight thick line represents the state of actor is dynamic with time. The length of straight thick line represents how long the behavior/event will last. The transverse thick line represents an event/behavior is executed. The arrow of transverse thick line represents the interaction object of an event/behavior execution. Finally, the number, which is in front of every event/behavior, represents the execution sequence. Following, we specify the scenario and management problems of each scenario. The management policies of management problems for each scenario will be specified in the 3.3 sub-section.
Dial-a-ride scenario
The dial-a-ride scenario (figure 8): Passenger calls for a service to control center. After control center receiving a requirement, control center assign a free electric-taxi to pick the specific passenger up and deliver him/her to the destination. The main roles are passenger, control center and electric-taxi.
doi:10.3926/jiem.2009.v2n2.p360-386 ©© JIEM, 2009 – 2(2): 360-386 - ISSN: 2013-0953
task. (3) How to choose the path to move to passenger location/destination. (4) What is the next step to driver, after driver delivering passenger to his/her destination.
Figure 9. “Dial-a-ride interaction process”.
doi:10.3926/jiem.2009.v2n2.p360-386 ©© JIEM, 2009 – 2(2): 360-386 - ISSN: 2013-0953
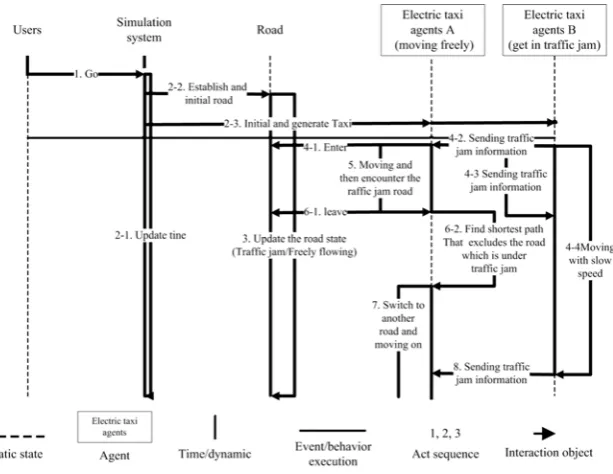
Incident (traffic jam) scenario
The incident (traffic jam) scenario (figure 10): An Electric-taxi encounter a road which is crowded, the Electric-taxi finds out another shortest path that excludes the road which is crowded to avoid the traffic jam. Any Electric-taxi which is getting in the traffic jam will send the traffic jam information to each Electric-taxi. The main role is Electric-taxis.
The management problems of incident (traffic jam) scenario: (1) How to know the specific road, which is under traffic jam in any time. (2) How to avoid the specific road, which is under traffic jam keep and moving on.
Figure 10. “Incident (traffic jam) interaction process”.
doi:10.3926/jiem.2009.v2n2.p360-386 ©© JIEM, 2009 – 2(2): 360-386 - ISSN: 2013-0953
(step4-2, 4-3 and 4-4). When Electric-taxis enter in or leave road, the state of road will be changed into jam-packed (step4-1 and 6-1). When Electric-taxi moves to a traffic jam road, driver will find another shortest path that excluded the traffic jam road (step5 and 6-2). And then Electric-taxi will switch into another road and move on (step7). Finally, when Electric-taxis that are leaving the traffic jam road, they will sending the traffic jam information again (step8).
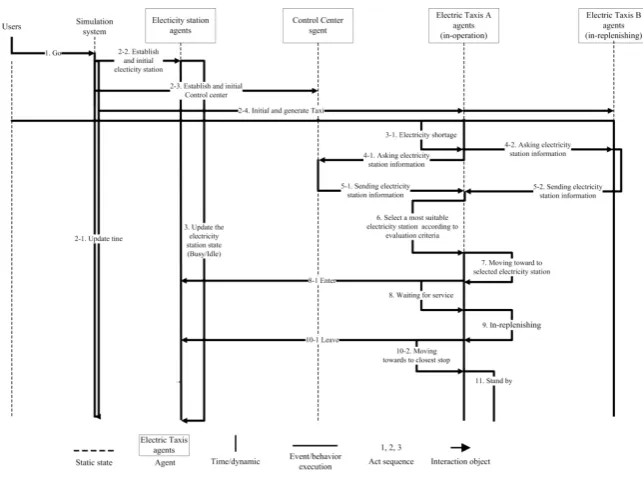
Electricity replenishing scenario
The electricity replenishing scenario (figure 11): An Electric-taxi driver checks the electricity of taxi, and find out the electricity is too low to support any longer travel. So the Electric-taxi moves to electric station to replenish electricity. Control Center and Electric-taxis those are in the Electric stations will provide the electric station information to the electric-taxi which needs to replenish electricity. The main roles are: Electric-stations, Control Center and Electric-taxis.
The management problems of electricity replenishing scenario: (1) How to schedule Electric-taxis those are waiting for replenishing. (2) When an Electric-taxi should be replenished. (3) How long should an Electric-taxi replenish electricity? (4) How to select a proper Electric station. (5) After finishing the replenishment, what is the next step to driver? (6) Where should we set up the Electric station?
doi:10.3926/jiem.2009.v2n2.p360-386 ©© JIEM, 2009 – 2(2): 360-386 - ISSN: 2013-0953
Figure 11. “Electricity replenishing interaction process”.
And then Electric-taxis those are in lack of electricity select a most suitable Electricity station according evaluation criteria (step6). After, Electric-taxi moves to selected elected station (step7). When Electric-taxis enter in or leave the selected Electricity station, the Electricity station will update its’ state (busy/idle) (step8-1 and 10-1). When Electric-taxi arrives at Electricity station, driver has to waiting for replenishing until there are no cars in front of him (step8-2 and 9). Finally, after replenishing finished, Electric-taxi will move to the closest stop and stand by for assignment (step10-2).
3.3 The specification of management policies
In this sub-section, we specify the all of the management policies that deal with the problems of three scenarios. The detail of all of the management policies is described as follows.
Dial-a-ride management
How to choose the proper car to pick Passenger up and deliver:
doi:10.3926/jiem.2009.v2n2.p360-386 ©© JIEM, 2009 – 2(2): 360-386 - ISSN: 2013-0953
based on the distance of the straight line that from Electric-taxi location to Passenger location.
How to choose the Passenger which you want to pick-up/service:.
When Passengers appear in the system, Control Center will pick the Passenger who is first entering in the system to service (FIFO (first in first out)). Then Control Center will chose the second one and so on.
What is the next step to driver, after driver delivering Passenger to his/her destination: Stand by and check whether Electric-taxi needs to be replenished or not.
How to choose the pathway to deliver passenger to his/her
destination: Search the shortest path by Dijkstra’s algorithm(Soltani et al., 2002).
Incident (traffic jam) management
How to know the specific road which is under traffic jam in any
time: If an Electric-taxi get in a road and the car number is more than four, we treat the state of the Electric-taxi as getting in traffic jam.
How to avoid the specific road which is under traffic jam keep and moving on: When an Electric-taxi gets in the traffic jam, the Electric-taxi will send the related traffic jam information (for example: Which road is under traffic jam) to every Electric-taxi. If other Electric-taxis are going to enter this road, they will switch into other paths based on the Dijkstra’s algorithm that excludes the road which is under traffic jam.
Replenishing electricity management
How to schedule Electric-taxis whom are waiting for replenishing: The Electric-taxi which is first enter in Electric station, he should be served first (FIFO (first in first out)).
When an Electric-taxi should be replenished: The replenishing
doi:10.3926/jiem.2009.v2n2.p360-386 ©© JIEM, 2009 – 2(2): 360-386 - ISSN: 2013-0953
How long should an Electric-taxi replenish its’ electricity: When the electricity is up to maximum (19.8kwh), the replenishing stop.
How to select a proper Electric station: The Electric station which is the closest station and its’ waiting car less than 4 unit. If the closest station is too busy, we will choose another one which is closer and its’ waiting car less than 4 unit. “The closest station” means the distance of straight line between Electric-taxi and Electric station is the shortest.
After finishing the replenishment, what is the next step to driver: Go back to the closest stop and stand by. “The closest stop” means the distance of straight line between Electric-taxi and stop is the shortest.
Where should we set up the Electric station: In our system, we apply random generation to set up Electric station randomly. The default of Electric station is eight.
In addition, all of the problem about finding out the shortest path, we apply the Dijkstra’s algorithm to solve it. Following, we specify the algorithm that we use to solve the shortest path problem.
The description of Dijkstra’s algorithm
Sign Definition
s Passenger start node
e Passenger end node
N Total node number
Dsj The distance from start node to node j. j = 1~N. Dsj >= 0 (if start node doesn’t connect with node j, then Dsj = 0)
SDj The shortest distances that from start node to node j. j=1~N SDj >= 0 (if start node equals to node j, then SDj = 0)
Cj Whether the node j be chosen or not. j=1~N If Chosen, Cj =1, Otherwise, Cj =0 PNj The pre-node of node j, j=1~N, PNj = 1~N
PSN Pre-start node of node j, j=1~N, PSNj = 1~N CD The current shortest distance
CN The node of current shortest distance
Table 2. “The signs and their definition of Dijkstra’s algorithm”.
doi:10.3926/jiem.2009.v2n2.p360-386 ©© JIEM, 2009 – 2(2): 360-386 - ISSN: 2013-0953
The following, we list the signs and their definition of Dijkstra’s algorithm, the detail is described as table 2. Next, we describe the steps of Dijkstra’s algorithm. In addition, the derivation of Dijkstra’s algorithm can be referred to (Cantone & Faro, 2004; Solka et al., 1995; Soltani et al., 2002).
Steps of Dijkstra’s algorithm
Step 1. Decide a start node and end node.
Step 2. We set the node of current shortest distance node equals start node.
Step 3. Setting the distances those from each node to its neighbor nodes.
Step 4. Calculate the distances those from each node to its neighbor nodes.
Step 5. Finding out all of the neighbor nodes to the node of current shortest distance.
Step 6. Choosing the shortest distance that from the start node to the specific neighbor node.
Step 7. Setting the neighbor node as the node of current shortest distance.
Step 8. Repeating step 4 to step 7 until all of the nodes has been selected.
Step 9. Obtaining the shortest path that from start node to each node.
Figure 12. “Example of the shortest path problem”.
doi:10.3926/jiem.2009.v2n2.p360-386 ©© JIEM, 2009 – 2(2): 360-386 - ISSN: 2013-0953
problem, our start node is “S” and end node “T”. We want to find out the shortest path from “S” to ”T”. Following is the solution procedures and description.
Step 1. We set the Start node (s) is S and the end node (e) is T.
Step 2. We set the node of current shortest distance node (CN) is s.
Step 3. All of the distances that from each node to its neighbor nodes are set as Figure 12.
Step 4. If ( Dsj != 0 || s = = j), then SDj = Dsj; Else, SDj = ∞;
Step 5. For (int j=1; j<=N; j++) {If (SDj < CD) then, CD = SDj; CN = j; PSN = s; } CCN = 1; For (int j=1; j<N; j++){
Step 6. s = CN for (int j=1; j<N; j++) { If(Dsj + SDs < SDj) then{ SDj = Dsj + SDs; PNj = s;}}
Step 7. For (int j=1; j<=N; j++) {If (SDj < CD && Cj = = 0) then {CD = SDj; CN = j; PSN = s; } } CCN = 1; }
Step 8. Repeating step 4 to step 7 until all of the nodes has been selected.
Step 9. Obtaining the shortest path that from S to each node. The shortest path from “S” to “T” (ScedT, the total distance is 6+2+1+5 = 14) is represented by thick lines in figure 12.
Following, our creation of simulation system will be present in the Section 4.
4 Creation and simulation of electric-taxi DAR operation system
4.1 Creation of electric-taxi DAR operation system
doi:10.3926/jiem.2009.v2n2.p360-386 ©© JIEM, 2009 – 2(2): 360-386 - ISSN: 2013-0953
Figure 13(a). “The agent attributes of electric-taxi DAR operation system”.
Figure 13(b). “The agent state of electric-taxi DAR operation system”.
doi:10.3926/jiem.2009.v2n2.p360-386 ©© JIEM, 2009 – 2(2): 360-386 - ISSN: 2013-0953
states/behaviors of agent. The behaviors of agent are extracted from combining the framework of agent and interaction process. Figure 13(c) illustrates the management policies of electric-taxi DAR operation system. The management policies are completed by specific definition in the Section 3.
Figure 13(c). “The management policies of electric-taxi DAR operation system”.
doi:10.3926/jiem.2009.v2n2.p360-386 ©© JIEM, 2009 – 2(2): 360-386 - ISSN: 2013-0953
4.2 Simulation of electric-taxi DAR operation system and setting
In this sub-section, we list the environment specification and simulation settings in the table 3 and table 4. The figure 15 is the simulation of electric-taxi DAR operation system.
Figure 15. “The simulation of electric-taxi DAR operation system”.
In computer environment, we use Microsoft Windows XP Professional version 2002 Service pack 3 as our operation system. The CPU computer is Intel(R) Core(TM)2 6320 @ 1.86GHz and the RAM computer is 1.87Ghz, 0.99GB. The AnyLogic version is anylogic 5.1 and the java version is JDK6.0.
In simulation settings, the number of taxi is 10. The number of stop and road is 8 and 18, respectively. And stop generation belongs to random generation. Other detail information is listed in table 4.
Operation system CPU Ram Anylogic version Java version
Microsoft Windows XP Professional version 2002 Service pack 3
Intel(R) Core(TM)2
6320 @ 1.86GHz 1.87Ghz, 0.99GB Anylogic 5.1 JDK 6.0
Table 3. “Environment specification”.
Time
accuracy Stop at time Simulation speed Model time units per second The number of taxi The generation rate of passenger
0.01 30 units Virtual mode 100 units 10 Normal (0.2)
doi:10.3926/jiem.2009.v2n2.p360-386 ©© JIEM, 2009 – 2(2): 360-386 - ISSN: 2013-0953
No. Initial parameter / Performance measurement Value
1 Passenger arrival time Normal (0.2)
2 Electric car speed 100 km/ per time unit
3 Electricity 19.8kwh
4 Electricity consuming rate 0.035kwh/ per time unit
5 Average waiting time
Table 5. “Initial parameters and Performance measurement in the electric taxi DAR operation system”.
We list the initial parameters and performance measurements in the electric taxi DAR operation system in table 5. The underlying contribution of first four parameters is to help the simulation approach reality and they are the necessary simulation parameters for electric taxi DAR operation system. On the other hand, the underlying contribution of last performance measure (Average waiting time) is to assess the result of electric taxi DAR operation system simulation.
5 Data collection and analysis
Data generated from the simulation that combines three scenarios (DAR, incident and replenishing electricity) and management policies specified in 3.2 and 3.3 sections.
From figure 16, the left bar represents the total serviced passenger number and the number is 152. The middle bar represents average waiting time of passengers and the time is 3.93. The right bar represents the total passenger number in simulation system and the number is 410. So we can find out the average waiting time is just 3.93. That means each of passenger can be served very quickly. The main cause of this phenomenon is resulted from the average waiting time is only calculated by the passengers whom has satisfied their demand. There are many passengers wait in the system, but not be included in the calculation.
doi:10.3926/jiem.2009.v2n2.p360-386 ©© JIEM, 2009 – 2(2): 360-386 - ISSN: 2013-0953
Figure 16. “View of a simulation”.
6 Summarizes and future works
We propose an electric-taxi DAR operation system that improves the lacks of existing methods. And from the analysis result, we successfully obtain the performance measures (average waiting time and service rate) to support the decision making with management policies.
In the future works, first, we will design different management policies combine different scenarios to observe the result of simulation and analyze the phenomenon. Second, we will construct graphic user interface (GUI) to connect with on-line. In this way, we can modify our electric-taxi DAR operation system to approach reality. For electric-taxi DAR managers, they can use our simulation system as the support of making decision.
Acknowledgements
doi:10.3926/jiem.2009.v2n2.p360-386 ©© JIEM, 2009 – 2(2): 360-386 - ISSN: 2013-0953
References
Ali, W. (2006). Developping 2D and 3D multi-agent geosimulation, a method and and its’ application: the case of shopping behavior geosimulation in square one mall. Retrieved 2006, from www.theses.ulaval.ca/2006/23343
BigSolar (2005). General report. Retrieved 2005, from
http://www.bigsolar.url.tw/F6DM.htm
Cantone, D., & Faro, S. (2004). Two-Levels-Greedy: a generalization of Dijkstra's shortest path algorithm. Electronic Notes in Discrete Mathematics, 17, 81-86.
Cubillos, C., Polanco, F. G., & Demartini, C. (2008a). Passengers Trips Planning using Contract-Net with Filters. Paper presented at the 8th International IEEE Conference on Intelligent Transportation Systems Vienna, Austria.
Ezzedine, H., Kolski, C., & Peninou, A. (2005). Agent-oriented design of human-computer interface: application to supervision of an urban transport network. Engineering Applications of Artificial Intelligence, 18, 255–270.
Galus, M. et al. (2009). A Framework for Investigating the Impact of PHEVS. Retrieved April 7th, 2009, from http://www.eeh.ee.ethz.ch/en/eeh/about-us.html
Government of Honk Kong (2005) General report. Retrieved 2005 from
http://www.epd.gov.hk/epd/partnership/chi/tran.htm
GreenParttyTaiwan (2007). General report, Retrieved 2007 from
http://www.greenparty.org.tw/division.php?itemid=831
iCo2l (2008). General report. Retrieved 2008 from
http://icool.saveoursky.org.tw/co2news/index.php?load=read&id=399
Kok, I. D., & Lucassen, T. (2007). Using Sectors in a Multi Agent Approach to a Taxi Planning Problem. Retrieved 2009 from http://www.teunlucassen.nl/index.php
doi:10.3926/jiem.2009.v2n2.p360-386 ©© JIEM, 2009 – 2(2): 360-386 - ISSN: 2013-0953
Seow, K. T., Dang, N. H., & Lee, D. H. (2008). Using Intelligent Collaborative Agents for Automating Distributed Taxi Dispatch. Retrieved 2008, from
http://cts.cs.uic.edu/
Siebers, P.O., Aickelin, U., Celia, H., & Clegg, C. (2008). Using Multi-Agent Simulation to Understand the Impact of Management Practices on Retail Performance. Retrieved 2008, from http://www.nottingham.ac.uk/cs/
Solka, J. L., Perry, J. C., Poellinger, B. R., & Rogers, G. W. (1995). Fast computation of optimal paths using a parallel Dijkstra algorithm with embedded constraints. Neurocomputing, 8(2), 195-212.
Soltani, A. R., Tawfik, H., Goulermas, J. Y., & Fernando, T. (2002). Path planning in construction sites: performance evaluation of the Dijkstra, A*, and GA search algorithms. Advanced Engineering Informatics, 16(4), 291-303.
Taiwan Environmental Information Center (2009). General report. Retrieved 2009, from http://e-info.org.tw/taxonomy/term/122
Wu, C. C. (2006). Matching Models and Solution Algorithms for Urban Taxipool. Retrieved 2006, from from http://etds.ncl.edu.tw/
Wu, Y. W. (2005). A Study of Shuttle Bus with Dial-a-Ride Service for Long-Distance Transportation Terminals. Retrieved 2005 from
http://etds.ncl.edu.tw/theabs/index.jsp
©© Journal of Industrial Engineering and Management, 2009 (www.jiem.org)
Article's contents are provided on a Attribution-Non Commercial 3.0 Creative commons license. Readers are allowed to copy, distribute and communicate article's contents, provided the author's and Journal of Industrial Engineering and Management's names are included. It must not be used for commercial purposes. To see the complete