R E S E A R C H A R T I C L E
Open Access
Validated stability-indicating spectrofluorimetric
methods for the determination of ebastine in
pharmaceutical preparations
Fawzia Ibrahim, Mohie Khaled Sharaf El-Din, Manal Ibrahim Eid, Mary Elias Kamel Wahba
*Abstract
Two sensitive, selective, economic, and validated spectrofluorimetric methods were developed for the determination of ebastine (EBS) in pharmaceutical preparations depending on reaction with its tertiary amino group. Method I involves condensation of the drug with mixed anhydrides (citric and acetic anhydrides) producing a product with intense fluorescence, which was measured at 496 nm after excitation at 388 nm.
Method (IIA) describes quantitative fluorescence quenching of eosin upon addition of the studied drug where the decrease in the fluorescence intensity was directly proportional to the concentration of ebastine; the fluorescence quenching was measured at 553 nm after excitation at 457 nm. This method was extended to (Method IIB) to apply first and second derivative synchronous spectrofluorimetric method (FDSFS & SDSFS) for the simultaneous analysis of EBS in presence of its alkaline, acidic, and UV degradation products.
The proposed methods were successfully applied for the determination of the studied compound in its dosage forms. The results obtained were in good agreement with those obtained by a comparison method. Both methods were utilized to investigate the kinetics of the degradation of the drug.
Background
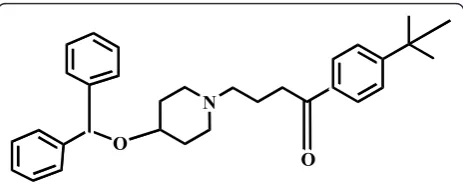
Ebastine;(4’- tert.-butyl - 4-[4-(diphenylmethoxy) - piper-idino] butyrophenone (Figure 1), is a potent long acting antihistaminic H1 receptor antagonist drugs [1]. Litera-ture survey reveals that only high performance liquid chromatography was used for the estimation of ebastine in presence of its metabolites [2,3].
Although chromatographic methods offer a high degree of specificity, yet they require large amount of high purity organic solvents and generate high amount of waste. Therefore, there is a need for an alternative substitute to these techniques for the routine quality control analysis of the concerned drug.
It is clear that there is a need for a method that is sen-sitive enough to monitor the drug level after therapeutic doses. Spectrofluorimetry by virtue of its high sensitivity meets this requirement. The proposed methods have some distinct advantages that render them promising substitutes for HPLC methods.
A number of organic acid anhydrides are capable of forming colored products with tertiary amines [4]; malonic, citric, and aconitic acids are representative examples. Aconitic acid however was found to be unsa-tisfactory as invariably a purple solution resulted on heating to dissolve the acid [5]. Tramadol, acebutolol and dothiepin were determined based on the condensa-tion of the cited drugs with malonic and acetic acids [6] where the colored products were suitable for spectro-photometric and spectrofluorimetric measurements; while citric/acetic anhydrides were used for the spectro-photometric determination of nizatidine [7], and some H1 receptor antagonists [8] namely; cetirizine, fexofena-dine, loratadine and acrivastine. Mixed anhydrides were also used for the colorimetric determination of epoxy-amine formulations (resulting from the reaction of bisphenol A diglycidyl ether and m-xylylenediamine) in a mixture of primary and secondary amines [9].
In spectrofluorimetric methods, high sensitivity and selectivity are generally expected. However, problems of selectivity can occur in multi-component analysis because of the overlap of their spectra that could be observed. Spe-cificity is a particular problem in the determination of
* Correspondence: [email protected]
Department of Analytical Chemistry, Faculty of Pharmacy, Mansoura University, Mansoura, 35516, Egypt
fluorescent drugs. Synchronous fluorescence spectroscopy (SFS) has been found to have several advantages [10], such as simple spectra, high selectivity, low interference, etc. Because of its sharp, narrow spectrum, SFS serves as a very simple, effective method of obtaining data for quanti-tative determination in a single measurement [11]. It has attracted the attention of many researchers and developed rapidly since it was firstly proposed by LIoyd [12].
Synchronous fluorescence spectroscopy techniques are classified according to different scanning modes of monochromators into constant wavelength, variety angle, and constant energy. At present, the constant wavelength method, in which a constant difference between the emission and excitation wavelengths is maintained, is used most extensively. The combination of SFS and derivative is more advantageous than differ-entiation of the conventional direct spectrofluorimetry in terms of sensitivity, because the amplitude of the derivative signal is inversely proportional to the band-width of the original spectrum [13].
Recently, derivative synchronous fluorometry (DSF) has been utilized for the determination of different mixtures in their co formulated dosage forms and biological fluids, such as metacycline and oxytetracycline [14], aspirin with caffeine [15] or aspirin with salicylic acid [16], diflunisal and salicylic acid [17], carvedilol and ampicillin [18], oxy-tetracycline in medicated premixes and feeds [19], cinnari-zine with either domperidone or nicergoline [20,21], sulpiride and mebeverine hydrochloride [22] and benzo[a] pyrene in spiked fatty foods [23]. This technique was also applied for the determination of some drugs in the pre-sence of their degradation products as in the case where sulpiride was determined in presence of its alkaline degra-dation product [24].
Other techniques mentioned in the literature for the determination of drugs in mixtures include: HPLC with diode array detection exemplified by the determination of colistin and tiamulin in liquid and solid medicated pre-mixes [25], sulfamethazine and trimethoprim in liquid feed premixes [26]. HPLC employing pre-column derivati-zation was also applied as in the assay of colistin antibiotic in feeds after fluorimetric derivatization with phthaldialde-hyde and 2-mercaptoethanol [27]. Organic solvent
extraction or solid phase extraction followed by HPLC were also used such as determination of tiamulin in swine feeds [28] and sulfamethazine in milk [29] respectively. Furthermore, various assay procedures were mentioned for the determination of some drugs depending on the fact that changes in their chemical environment will mod-ify their native spectra and allow their determination in mixtures, as illustrated by the high binding ability of oxyte-tracycline with some divalent cations that causes changes in its native fluorescence spectrum facilitating its determi-nation in veterinary formulations [30].
The International Conference on Harmonization (ICH) guidelines [31] entitled “stability testing of new drug substances and products” requires that stress test-ing be carried out to elucidate the inherent stability characteristics of the active substance. Susceptibility to alkaline, acidic, oxidative, and UV degradation are of the required tests. The present work is capable of pre-senting an efficient novel DSF method for the determi-nation of EBS in the presence of its different degradation products, and to study the results kineti-cally so as to indicate that the method is a stability indicating one.
Up till now neither direct nor synchronous spectro-fluorimetry has been reported for the analysis of ebas-tine alone or in presence of its degradation products.
Experimental
Apparatus
a) The fluorescence spectra and measurements were recorded using a Perkin Elmer LS 45 Luminescence Spectrometer equipped with a 150 W Xenon arc lamp. A 1 cm quartz cell was used. Derivative spectra were evalu-ated using Fluorescence Data Manager (FLDM) software, Perkin Elmer Buck i.e. FL WINLAB, version 400.02.
b) A Consort NV P901 pH meter
Materials and reagents
All reagents and solvents were of Analytical Reagent grade.
1) Ebastine (EBS); of purity 99.94% was kindly pro-vided by Meivo Pharmaceutical Company, Cairo, Egypt.
2) Pharmaceutical preparations:
*Bastab® tablets (BN#112038), labeled to contain 20 mg ebastine/tablet, Meivo Pharmaceutical Company, Cairo, Egypt.
*Evastine®syrup (BN# 94634), labeled to contain 5 mg ebastine/5 ml, Marcyrl Pharmaceutical Industries, El Obour City, Egypt.
3) Citric acid anhydride (CAA) was prepared as super-saturated solution by dissolving citric acid (Merck) in acetic anhydride (Prolabo) with the aid of sonication [8]
4) Eosin (Riedel-DE-Haen AG seeize–Hannover) 1.5 × 10⁻³M aqueous solution.
O
N
O
5) Mcliavain buffers (pH ranging from 2-8) were pre-pared by mixing specific volumes of disodium hydrogen phosphate (0.2 M) and citric acid (0.2 M) [32].
6) Sodium hydroxide (0.1, 0.4 M solution), hydrochlo-ric acid (0.1, 0.4 M solution), hydrogen peroxide (3% v/v solution); (BDH, Poole,UK).
5) Methanol (Aldrich)
Standard solutions
Stock solutions were prepared by dissolving 100.0 mg of EBS in methanol and further diluted with the same sol-vent as appropriate. The standard solutions were stable for 7 days when kept in refrigerator.
General Procedure
For methodІ
Aliquots of standard solutions covering the concentra-tion range of 0.1-1.0 μg/ml for EBS were transferred into a set of 10 ml screw capped test tubes, evaporated to dryness in a boiling water bath, and cooled under tap water. Then 5.5 ml of CAA reagent were added, and the test tubes were screwed up and heated in a boiling water bath for 35 minutes. The solutions were cooled and transferred quantitatively to 10 ml volumetric flasks; diluted to the mark with distilled water and mixed well. The fluorescence intensity of the resulting solutions was measured at 496 nm after excitation at 388 nm. A blank experiment was prepared simultaneously for each mea-surement. The corrected relative fluorescence intensity was plotted versus the final concentration of the drug (μg/ml) to get the calibration graph; alternatively, the corresponding regression equation was derived.
For method IIA
To a set of 10 ml volumetric flasks, aliquots of ebastine standard solutions over the concentration range of 0.1-1.0μg/ml were transferred, 1 ml of 1.5 × 10⁻³M eosin were added, followed by 2.5 ml of mcliavain buffer pH 2.2, the volume was completed to mark with distilled water and mixed well. The quenching of eosin fluores-cence intensity was measured at 553 nm after excitation at 457 nm.
For method IIB
After following the procedures mentioned in method IIA, The synchronous fluorescence spectra of the solutions were recorded by scanning both monochromators at (Δ
l) = 100, 60 or 40 nm in presence of alkaline, acidic, or UV degradation products respectively. A scan rate of 600 nm/min using 10 nm excitation and emission windows was used. The first and second-derivative fluorescence spectra of EBS were derived from the normal synchro-nous spectra using FLDM software. For best resolution and smoothing 99 points were used. The fluorescence
intensities of the first and second-derivative spectra were estimated at 421 and 453 nm respectively when EBS was determined in presence of its alkaline degradation pro-duct. When the drug was estimated in presence of its acidic degradation product the first and second-derivative spectra were determined at 431 and 419 nm respectively. On the other hand ebastine was determined at 437 nm and 458 nm using first and second-derivative techniques respectively. A blank experiment was performed simulta-neously. The peak amplitude of either the first or the sec-ond derivative technique was plotted versus final concentration of the drug (μg/ml) to obtain the calibra-tion graphs. Alternatively, the corresponding regression equations were derived.
Procedure for determination of ebastine in presence of its degradation products
Aliquot volumes of EBS standard stock solution (400μg/ ml) were transferred into a series of 25 ml volumetric flask to obtain a final concentration of 40 μg/ml; the volume was completed with 0.1 M sodium hydroxide or 0.1 M hydrochloric acid to prepare the alkaline or acidic degradation product respectively. The solutions were left in a boiling water bath for 50 minutes (alkaline degrada-tion) and for 30 minutes (acidic degradadegrada-tion). Regarding the UV degradation, the methanolic solution of EBS was exposed to Deuterium lamp in a cabinet distance of 15 cm for 9 hours. These time intervals were determined so as to follow the ICH guidelines [31] accomplishing 30% degradation of the studied drug. Aliquot volumes of the degraded solutions were transferred to a series of 10 ml volumetric flasks, neutralized with 0.1 M hydrochloric acid or 0.1 M sodium hydroxide for alkaline and acidic degradation respectively, and the steps described under procedure for method IIB were followed.
The peak amplitude of the first or the second deriva-tive techniques were plottedversus the final concentra-tion of the drug (μg/ml) to obtain the calibration graphs. Alternatively, the corresponding regression equations were derived
Procedure for tablets
method IIA or method IIB” were followed. The nominal content of the tablets was determined either from the calibration graphs or from the corresponding regression equations.
Procedure for syrup
Aliquot volumes equivalent to 5 mg of the studied drug were transferred into a 25 ml volumetric flask, serial dilution was performed with methanol to obtain the working concentration range and the steps described under “General Procedure for method I, method IIA or method IIB” were followed. The nominal content of the syrup was determined either from the calibration graph or by using the corresponding regression equation.
Procedure for preparation of degradation products For the kinetic study, 2.5 ml of EBS standard solution (400μg/ml) were transferred into a series of 25 ml volu-metric flasks to obtain a final concentration of 40μg/ml, 0.4 M sodium hydroxide or 0.4 M hydrochloric acid were added for method I. Regarding method II, 0.1 M hydrochloric acid or 0.1 M sodium hydroxide were used. The solutions were left in a thermostatically con-trolled water bath at different temperature settings (50, 60, 70, 80°C) for a fixed time interval (10 minutes). Aliquot volumes of the degraded solutions were trans-ferred to a series of 10 ml screw capped test tubes (method I) and neutralized with 0.4 M hydrochloric acid or 0.4 M sodium hydroxide for alkaline and acidic degradation respectively, alternatively the degraded solu-tions were transferred to 10 ml volumetric flasks (method II) and neutralized with 0.1 M hydrochloric acid or 0.1 M sodium hydroxide for alkaline and acidic degradation respectively. The steps were completed as described under “General procedure”. Log a/a-xversus time (minutes) was plotted to get the reaction rate con-stant and the half life time t1/2.
Results and discussion
Ebastine forms a highly fluorescent reaction product upon reaction with citric acid anhydride (Figure 2). Citric acid anhydride is proposed to condense with ebastine producing an internal salt. The high pKavalue of EBS [33] indicates that the rate of condensation reac-tion is dependent on the basicity of the tetriary amine. The fluorophore was formed instantaneously and remained stable for more than 90 minutes.
Ebastine and eosin Y react to form a complex that resulted in eosin Y fluorescence quenching. The maxi-mum quenching wavelength was at 553 nm (Figure 3); this property was further extended to determine ebas-tine in presence of its degradation products. Figures 4a-c illustrate the fluores4a-cen4a-ce spe4a-ctra of the alkaline, acidic and UV degradation products of ebastine
respectively with corresponding lem/lexof (602/473 nm, 576/474 nm and 561/472 nm).
It is necessary to record first the normal synchronous fluorescence spectra of EBS in presence of its different degradation products to derive the first and
second-250.0 300 350 400 450 500 550 600.0
33.9 100 200 300 400 500 600 700 800 900 1000.0
nm
A
B
Figure 2Fluorescence spectra of the EBS (1μg/ml) - mixed anhydride condensation reaction product: Where A and B are the excitation and emission spectra respectively.
425.0 450 500 550 600 650 700.0 1.1
200 400 600 800 991.2
nm
A
B
B'
A'
Figure 3Fluorescence spectra of the reaction product of EBS with eosin where: A and B are the excitation and emission spectra
respectively of eosin. A’and B’are excitation and emission spectra
derivative synchronous spectra. The synchronous fluores-cence spectra of EBS were recorded at 457 nm in pre-sence of its alkaline, acidic and UV degradation products (Figures 5a-c) respectively. There is a great overlap of the spectra of the drug and its degradation products in
normal synchronous spectroscopy; this encouraged us to perform first and second derivative synchronous fluores-cence spectroscopy technique (FDSFS&SDSFS) without prior extraction or separation step.
The fluorescence spectra of EBS and its different degradation products were separated entirely using FDSFS and SDSFS with a zero crossing technique of measurement. First and second derivative synchro-nous fluorescence spectra of EBS in presence of its alkaline degradation product (Figures 6a-b) show that ebastine could be separated at 421, 453 nm respec-tively. Similarly, entire separation of EBS in presence of its acidic degradation product was achieved at 431 and 419 nm using first and second derivative techni-ques respectively as shown in Figures 7a-b. While the FDSFS and SDSFS of the studied drug in the presence of its UV degradation product (Figures 8a-b) show that EBS could be determined at 437 and 458 nm respectively.
Optimization of the reaction conditions for Method I The spectrofluorimetric properties of the formed fluoro-phore as well as the different experimental parameters affecting development and stability of the reaction product were carefully studied and optimized. Such factors were changed individually while the others were kept constant.
Effect of volume of citric anhydride
Keeping all the variables constant, it was found that increasing the volume of supersaturated solution of CAA resulted in a gradual increase in the relative fluor-escence intensity of the reaction product up to 5 ml, after which it remained constant, therefore, 5.5 ± 0.5 ml was chosen for the study (Figure 9).
Effect of reaction temperature
The effect of reaction temperature was also studied keeping all the variables constant. The fluorescence intensity increased remarkably by increasing the tem-perature from 60 to 100°C. Maximum fluorescence intensities were obtained through boiling of the reaction mixture. Hence, the reaction was carried out in a boiling water bath (Figure 10).
Effect of boiling time
It was found that increasing the time of boiling of the reaction mixture resulted in a gradual increase in the relative fluorescence intensity up to 30 minutes and remained constant till 40 minutes, after which it decreased gradually, therefore 35 ± 5 minutes of boiling was used during this approach (Figure 11).
Effect of different diluting solvents
Different diluting solvents were tested to choose the most suitable one for the formation of the reaction pro-duct, the investigated solvents included: water, metha-nol, acetonitrile, dimethylsulfoxide, dimethylformamide, and acetone. The highest fluorescence intensities were
450.0 500 550 600 650 700.0
1.1 100 200 300 400 500 600 700 800 900 991.2
nm
a
450.0 500 550 600 650 700.0
0.2 100 200 300 400 500 600 700 800 900 991.2
nm
b
450.0 500 550 600 650 700.0
1.1 100 200 300 400 500 600 700 800 900 991.2
nm
c
A
B
A'
B'
A
B
A
'
B'
B'
A'
B
A
Figure 4Fluorescence spectra of the degradation products of EBS through its reaction with eosin. Where A and B are the excitation
and emission spectra respectively of eosin. A’and B’are excitation and
200.0 250 300 350 400 450 500 550.0 0.5
50 100 150 200 250 266.4
nm 200.0 250 300 350 400 450 500 550 600 650 694.5 0.2
20 40 60 80 100 120 140 156.4
nm
350.0 400 450 500 550 600 650 694.5 1.0
20 40 60 80 100 120 140 156.4
nm
b
c
a
Figure 5Synchronous fluorescence spectra of EBS at 457 nm in presence of: a) Alkaline degradation product. b) Acidic degradation product. c) UV degradation product.
200.0 250 300 350 400 450 500 550 600 650 694.5 -64.8
-50 -40 -30 -20 -10 0 10 20 30 39.4
nm
D1
375.0 400 450 500 550 600 650 694.5 -27.4
-20 -10 0 10 20.0
nm
D2
a
b
Figure 6First and second derivative synchronous fluorescence spectra of EBS in presence of its alkaline degradation product. a) FDSFS of EBS at 421 nm in presence of its alkaline degradation product. b) SDSFS of EBS at 453nm in presence of its alkaline degradation product.
350.0 400 450 500 550 600 650 694.5 -28.3
-20 -10 0 10 20 30 39.4
nm
D1
200.0 250 300 350 400 450 500 550 600 650 694.5 -27.4
-25 -20 -15 -10 -5 0 5 10 15 19.1
nm
D2
b
a
Figure 7First and second derivative synchronous fluorescence spectra of EBS in presence of its acidic degradation product. a: FDSFS of EBS at 431 nm in presence of its acidic degradation product. b: SDSFS of EBS at 419 nm in presence of its acidic degradation product.
200.0 250 300 350 400 450 500 550 600 650 694.5 -28.3
-20 -10 0 10 20 30 39.4
nm
D1
350.0 400 450 500 550 600 650 694.5 -27.4
-25 -20 -15 -10 -5 0 5 10 15 19.1
nm
D2
b
a
achieved upon using water. Moreover, its choice adds another advantage to the method. The results are demonstrated in Table 1.
Optimization of the reaction conditions for Method IIA
Effect of buffer pH
The effect of mcliavain buffer pH on the fluorescence quenching of eosin through its reaction with ebastine was studied over pH range of 2-8 keeping all the variables constant. It was found that maximumΔF was obtained at pH value of 2-2.5, after which gradual decrease inΔF was observed by increasing pH value (Figure 12), hence mcliavain buffer of pH 2.2 was used in this study.
Effect of buffer volume
The effect of mcliavain buffer volume (pH 2.2) on the fluorescence quenching was also investigated. Gradual increase in ΔF values was obtained by increasing the volume of the buffer up to 2 ml, after which, theΔF values remained constant (Figure 13). Therefore, 2.5 ml of mclia-vain buffer pH 2.2 was used throughout this method.
Effect of different diluting solvents
Different diluting solvents were tested to choose the most suitable one for maximum fluorescence quenching. The highestΔF values were achieved upon using water. The results are demonstrated in Table 1.
Optimization of the reaction conditions for Method IIB The same reaction conditions concerning method IIA were applied; in addition effect ofΔlwas also investi-gated as follows:
Selection of optimumΔl
The synchronous fluorescence spectra of EBS in pre-sence of its different degradation products were recorded using differentΔl. The optimum Δlvalue is very important for performing the synchronous fluores-cence scanning technique concerning resolution, sensi-tivity, and features. It can directly influence spectral shape, bandwidth, and signal value. For this reason, a wide range of Δl (40, 60, 80, 100, and 120 nm) was examined. Therefore, Δ l of 100, 60 or 40 nm were chosen as optimal for separation of EBS in presence of its alkaline, acidic or UV degradation products respec-tively, since it resulted in distinct well separated peaks, with good shape, and highest SFI values.
0 1 2 3 4 5 6 7
300 400 500 600 700 800
Volume,ml
RF
I
Figure 9Effect of volume of CAA on the fluorescence intensity of the formed reaction product (EBS = 1μg/ml).
50 60 70 80 90 100 110
0 200 400 600 800
Reaction temperature
RF
I
Figure 10Effect of reaction temperature on the fluorescence intensity of the formed reaction product (EBS = 1μg/ml).
0 10 20 30 40 50 60
0 200 400 600 800
Time in minutes
RF
I
Figure 11Effect of boiling time on the fluorescence intensity of the formed reaction product (EBS = 1μg/ml).
Table 1 Effect of different diluting solvents on the fluorescence intensity (method I) orΔF (method IIA)
Diluting solvent Proposed method Method I Method IIA
Water 700 690
Methanol 684 450
Acetonitrile 412 430
Dioxane 304 389
Dimethylformamide 122 230
Acetone 30 150
Analytical performance and application
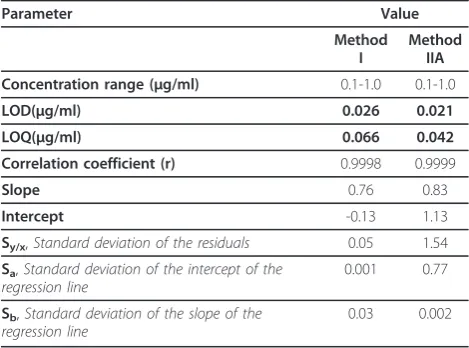
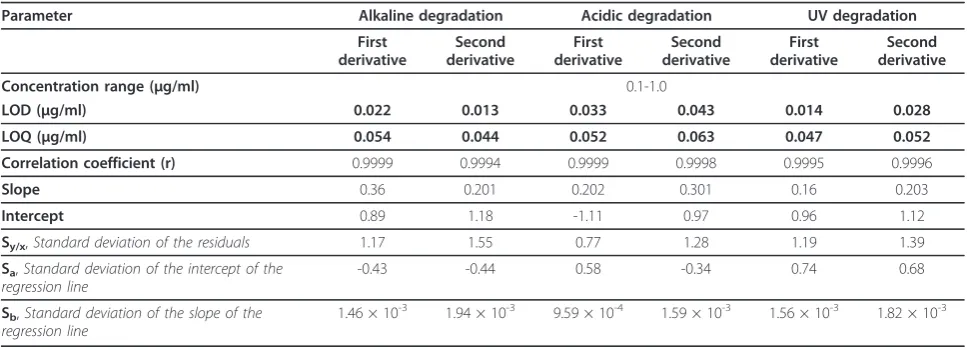
The relative fluorescence intensity, ΔF, or peak ampli-tude (by FDSFS and SDSFS) - concentration plots for ebastine by method I, method IIA, and method II B respectively were linear over the concentration ranges cited in Tables 2 and 3. The linearity of the calibration curves is validated by the high value of the correlation coefficient and value of the intercept which is close to zero.
Sensitivity
Detection limit (LOD) is the lowest concentration of the drug that can be detected, but not necessarily quanti-tated, under the stated experimental conditions. The limit of detection is generally quoted as the concentra-tion yielding a signal-to-noise ratio of 3:1 [34] and is confirmed by analyzing a number of samples near this value using the following equation:
The signal−to−noise ratio s = H/h
Where H = height of the spectrum corresponding to the drug.
h = absolute value of the largest noise fluctuation from the baseline of the spectrum of a blank solution.
While the limit of quantification (LOQ); is the lowest concentration of the analyte that can be determined with acceptable precision and accuracy. It is quoted as the concentration yielding a signal-to-noise ratio of 10: 1 and is confirmed by analyzing a number of samples near this value [34].The calculated values are listed in Tables 2 and 3.
Validation of the proposed methods
The proposed methods were tested for linearity, selectiv-ity, accuracy and precision. Using the above spectro-fluorimetric methods, linear regression equations were obtained. The regression plots showed that there was a linear dependence of the fluorescence intensity values, ΔF values, or peak amplitude values on the concentra-tion of the drug over the ranges cited in Tables 2 and 3. The validity of the proposed methods was evaluated by statistical analysis of the regression data regarding the standard deviation of the residual (Sy/x), the standard deviation of the intercept (Sa), and standard deviation of the slope (Sb) [35]. The results are shown in Tables 2 and 3. The small values of the figures point to the low scattering of the points around the calibration graphs and high precision of the proposed methods.
Accuracy
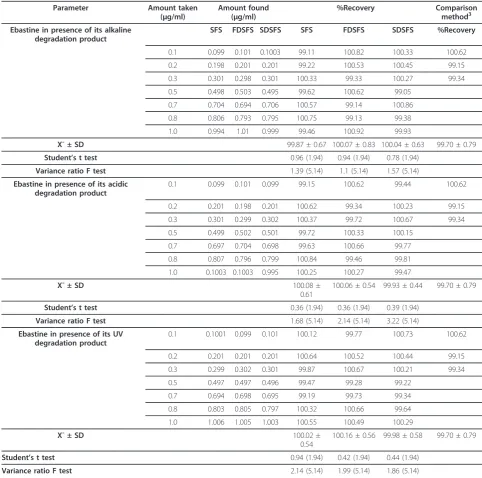
The accuracy of the proposed methods was evaluated by analyzing standard solutions of ebastine. The results obtained by the proposed methods were favorably com-pared with those obtained by the comparison method [3]. Statistical analysis [35] of the results obtained by the proposed and comparison methods using student’s t-test and variance ratio F- test, showed no significant difference Table 2 Performance data of method I and method IIA
Parameter Value Method
I
Method IIA Concentration range (μg/ml) 0.1-1.0 0.1-1.0
LOD(μg/ml) 0.026 0.021 LOQ(μg/ml) 0.066 0.042 Correlation coefficient (r) 0.9998 0.9999
Slope 0.76 0.83
Intercept -0.13 1.13
Sy/x,Standard deviation of the residuals 0.05 1.54
Sa,Standard deviation of the intercept of the
regression line
0.001 0.77
Sb,Standard deviation of the slope of the
regression line
0.03 0.002
0.0 2.5 5.0 7.5 10.0
0 200 400 600 800
Mclivain buffer pH
'
F
Figure 12Effect of buffer pH on fluorescence quenching of eosin by EBS (EBS = 1μg/ml).
0 1 2 3 4
725 750 775 800 825 850 875
Buffer (pH 2.2) volume,ml
'
F
between the performance of the two methods regarding the accuracy and precision, respectively (Tables 4, 5).
The proposed methods were evaluated by studying the accuracy as percent relative error and precision as per-cent relative standard deviation (RSD%); the results are summarized in Tables 4, 5.
Precision
Repeatability The repeatability was evaluated through
analysis of different concentrations of the studied drug in pure or in dosage forms on 4 successive times. The mean percentage recoveries listed in Table 6 indicate the high precision of the proposed methods.
Intermediate precision It was performed through
repeated analysis of variable concentrations of EBS eitherper seor in dosage forms on four successive days. The results are abridged in Table 6.
Robustness of the method The robustness of the
meth-ods adopted was demonstrated by the consistency of the relative fluorescence intensity, ΔF, or peak amplitude values with the deliberately minor changes in the experi-mental parameters such as: volume of CAA (5.5 ±
0.5 ml), boiling time (30 ± 5 min.), buffer pH (2.2 ± 0.2) and buffer volume (2.5 ± 0.5) which did not greatly affect the results obtained.
Pharmaceutical applications
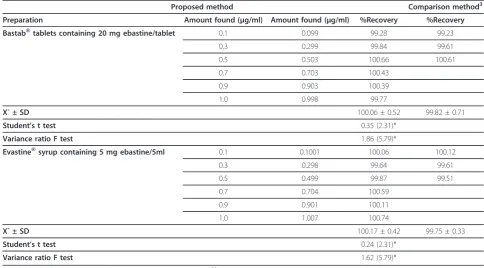
The proposed methods were successfully applied to the determination of ebastine in its dosage forms. The results are summarized in Tables 7 and 8. No interfer-ence from the sample matrix was observed, the results were found to be in good agreement with the labeled amount.
Stability study
The proposed methods are based mainly on the reaction between citric acid anhydride and eosin with the tertiary amino group of ebastine. Therefore, degradation was attained upon induced alkaline degradation using sodium hydroxide (0.4 M for method I, 0.1 M for method II), acidic degradation using hydrochloric acid (0.4 M, 0.1 M for methods I and II respectively) and oxidative degrada-tion using 3% hydrogen peroxide. Upon alkaline and acidic Table 3 Performance data of method IIB
Parameter Alkaline degradation Acidic degradation UV degradation First
derivative
Second derivative
First derivative
Second derivative
First derivative
Second derivative Concentration range (μg/ml) 0.1-1.0
LOD (μg/ml) 0.022 0.013 0.033 0.043 0.014 0.028 LOQ (μg/ml) 0.054 0.044 0.052 0.063 0.047 0.052 Correlation coefficient (r) 0.9999 0.9994 0.9999 0.9998 0.9995 0.9996
Slope 0.36 0.201 0.202 0.301 0.16 0.203
Intercept 0.89 1.18 -1.11 0.97 0.96 1.12
Sy/x,Standard deviation of the residuals 1.17 1.55 0.77 1.28 1.19 1.39
Sa,Standard deviation of the intercept of the
regression line
-0.43 -0.44 0.58 -0.34 0.74 0.68
Sb,Standard deviation of the slope of the
regression line
1.46 × 10⁻³ 1.94 × 10⁻³ 9.59 × 10⁻⁴ 1.59 × 10⁻³ 1.56 × 10⁻³ 1.82 × 10⁻³
Table 4 Determination of ebastine in its pure form using method I
Parameter Amount taken (μg/ml) Amount found (μg/ml) % Recovery Comparison method3, % Recovery
0.1 0.099 99.0 100.62
0.2 0.199 99.90 99.15
0.3 0.298 99.33 99.34
0.5 0.502 100.40
0.7 0.706 100.86
0.8 0.799 99.88
1.0 1.005 100.5
Xˉ± SD 99.98 ± 0.66 99.70 ± 0.79
Student’s t test 0.33 (1.94)*
Variance ratio F test 1.4 (5.14)*
*Figures between parenthesis are tabulated t and F values at P = 0.0535
degradation of the drug, the relative fluorescence readings orΔF values decreased gradually with time, thus indicating that the proposed methods are stability indicating ones. However, the proposed methods did not indicate the per-oxide degradation of ebastine, and this may be due to the formation of the N-oxide derivative of the drug which is not susceptible to react with either CAA or eosin owing to the blocking of the tertiary amino group.
Both alkaline and acidic degradation were found to be temperature dependant as presented by the acidic degra-dation for method I (Figure 14). The first order
degradation rate constant and the half life time at each temperature were calculated (Table 9). Plotting log Kobs valuesversus1/T, the Arhenius plots were obtained and exemplified by Figure 15. The activation energy for each type of degradation was also calculated.
Upon exposure of methanolic solution of the con-cerned drug to Deuterium lamp with a wavelength of 254 nm at a distance of 15 cm in a cabinet for different time intervals, and then the studied methods were applied, it was found that EBS decomposed by 22,19% applying method I and method II respectively.
Table 5 Determination of ebastine in its pure form using method IIB
Parameter Amount taken (μg/ml)
Amount found (μg/ml)
%Recovery Comparison method3 Ebastine in presence of its alkaline
degradation product
SFS FDSFS SDSFS SFS FDSFS SDSFS %Recovery
0.1 0.099 0.101 0.1003 99.11 100.82 100.33 100.62
0.2 0.198 0.201 0.201 99.22 100.53 100.45 99.15
0.3 0.301 0.298 0.301 100.33 99.33 100.27 99.34
0.5 0.498 0.503 0.495 99.62 100.62 99.05
0.7 0.704 0.694 0.706 100.57 99.14 100.86
0.8 0.806 0.793 0.795 100.75 99.13 99.38
1.0 0.994 1.01 0.999 99.46 100.92 99.93
X¯ ± SD 99.87 ± 0.67 100.07 ± 0.83 100.04 ± 0.63 99.70 ± 0.79
Student’s t test 0.96 (1.94) 0.94 (1.94) 0.78 (1.94)
Variance ratio F test 1.39 (5.14) 1.1 (5.14) 1.57 (5.14)
Ebastine in presence of its acidic degradation product
0.1 0.099 0.101 0.099 99.15 100.62 99.44 100.62
0.2 0.201 0.198 0.201 100.62 99.34 100.23 99.15
0.3 0.301 0.299 0.302 100.37 99.72 100.67 99.34
0.5 0.499 0.502 0.501 99.72 100.33 100.15
0.7 0.697 0.704 0.698 99.63 100.66 99.77
0.8 0.807 0.796 0.799 100.84 99.46 99.81
1.0 0.1003 0.1003 0.995 100.25 100.27 99.47
X¯ ± SD 100.08 ±
0.61
100.06 ± 0.54 99.93 ± 0.44 99.70 ± 0.79
Student’s t test 0.36 (1.94) 0.36 (1.94) 0.39 (1.94)
Variance ratio F test 1.68 (5.14) 2.14 (5.14) 3.22 (5.14)
Ebastine in presence of its UV degradation product
0.1 0.1001 0.099 0.101 100.12 99.77 100.73 100.62
0.2 0.201 0.201 0.201 100.64 100.52 100.44 99.15
0.3 0.299 0.302 0.301 99.87 100.67 100.21 99.34
0.5 0.497 0.497 0.496 99.47 99.28 99.22
0.7 0.694 0.698 0.695 99.19 99.73 99.34
0.8 0.803 0.805 0.797 100.32 100.66 99.64
1.0 1.006 1.005 1.003 100.55 100.49 100.29
X¯ ± SD 100.02 ±
0.54
100.16 ± 0.56 99.98 ± 0.58 99.70 ± 0.79
Student’s t test 0.94 (1.94) 0.42 (1.94) 0.44 (1.94)
Table 6 Validation of the proposed methods for the determination o0f ebastine in pure and dosage forms
Preparation Repeatability,% Found Intermediate precision, % Found Method I Method II Method I Method II Ebastine pure form Ebastine (0.5μg/ml) Ebastine (0.1μg/ml) Ebastine (0.3μg/ml) Ebastine (0.7μg/ml)
99.62 100.25 100.66 99.54
99.24 100.65 100.06 99.35
100.65 100.87 100.97 100.15
100.25 99.95 99.86 99.42
Xˉ± SD 99.94 ± 0.63 100.43 ± 0.41 100.39 ± 0.52 99.62 ± 0.37
Bastab®tablets containing 20 mg ebastine/tablet Ebastine (0.8μg/ml) Ebastine (0.3μg/ml) Ebastine (0.1μg/ml) Ebastine (0.5μg/ml)
100.12 100.65 100.45 99.12
100.36 100.22 100.68 99.54
99.21 99.87 99.06 99.35
99.85 99.54 99.54 100.24
Xˉ± SD 99.89 ± 0.61 100.07 ± 0.48 99.93 ± 0.76 99.56 ± 0.48
Evastine®syrup containing 5 mg Ebastine/5ml Ebastine (1.0μg/ml) Ebastine (0.4μg/ml) Ebastine (0.2μg/ml) Ebastine (0.6μg/ml)
100.98 100.65 100.54 99.65
100.45 100.15 100.98 99.15
99.32 100.98 99.48 100.54
99.15 100.11 99.72 100.32
Xˉ± SD 99.98 ± 0.88 100.47 ± 0.42 100.18 ± 0.7 99.92 ± 0.64
Table 7 Determination of ebastine in its dosage forms using method I
Parameter Amount taken (μg/ml)
Amount found (μg/ml)
% Recovery Comparison method3,% Recovery
Bastab®tablets containing 20 mg ebastine/tablet
0.1 0.099 99.71 99.23
0.2 0.199 99.52 99.61
0.3 0.301 100.33 100.61
0.5 0.503 100.62
0.6 0.602 100.33
0.8 0.798 99.75
1.0 1.01 100.64
Xˉ± SD 100.13 ± 0.46 99.82 ± 0.71
Student’s t test 0.27 (1.94)*
F test 2.38 (5.14)*
Evastine®syrup containing 5 mg ebastine/5ml
0.1 0.101 100.96 100.12
0.2 0.201 100.55 99.61
0.3 0.301 100.33 99.51
0.5 0.499 99.81
0.6 0.598 99.67
0.8 0.801 100.13
1.0 1.01 100.93
Xˉ± SD 100.34 ± 0.51 99.75 ± 0.33
Student’s t test 0.34 (1.94)*
F test 2.39 (5.14)*
*Figures between parenthesis are tabulated t and F values at P = 0.0535
Table 8 Determination of ebastine in its dosage forms by SFS using method IIB
Proposed method Comparison method3 Preparation Amount found (μg/ml) Amount found (μg/ml) %Recovery %Recovery Bastab®tablets containing 20 mg ebastine/tablet 0.1 0.099 99.28 99.23
0.3 0.299 99.84 99.61
0.5 0.503 100.66 100.61
0.7 0.703 100.43
0.9 0.903 100.39
1.0 0.998 99.77
X¯ ± SD 100.06 ± 0.52 99.82 ± 0.71
Student’s t test 0.35 (2.31)*
Variance ratio F test 1.86 (5.79)*
Evastine®syrup containing 5 mg ebastine/5ml 0.1 0.1001 100.06 100.12
0.3 0.298 99.64 99.61
0.5 0.499 99.87 99.51
0.7 0.704 100.59
0.9 0.901 100.11
1.0 1.007 100.74
X¯ ± SD 100.17 ± 0.42 99.75 ± 0.33
Student’s t test 0.24 (2.31)*
Variance ratio F test 1.62 (5.79)*
*Figures between parenthesis are tabulated t and F values at P = 0.0535
.
Table 9 Kinetic parameters for acidic and alkaline degradation of ebastine using the proposed methods
Temperature (°C) Method I Method II
Alkaline degradation Acidic degradation Alkaline degradation Acidic degradation K (min.-1) t1/2(min.) K (min.
-1
) t1/2(min.) K (min. -1
) t1/2(min.) K (min. -1
) t1/2(min.)
50 1.06 × 10⁻² 65 1.3 × 10⁻² 52 1.06 × 10⁻² 65 1.3 × 10⁻² 52
60 0.94 × 10⁻² 74 1.2 × 10⁻² 58 0.94 × 10⁻² 74 1.2 × 10⁻² 58
70 0.89 × 10⁻² 77 1.1 × 10⁻² 62 0.89 × 10⁻² 77 1.1 × 10⁻² 62
80 0.81 × 10⁻² 86 1.03 × 10⁻² 67 0.81 × 10⁻² 86 1.03 × 10⁻² 67
Ea = (Joule/mol) 7.1 6.8 6.9 7.2
0 10 20 30 40 50 60 70
0.0 0.2 0.4 0.6 0.8
A
B
C
D
Time in minutes
Log a
/a-x
Figure 14 Semilogarithmic plot of EBS (500 ng/ml) versus different heating times with 0.4 M HCl. (A = 80°C, B = 70°C, C = 60°C, and D = 50°C).
2.6 2.7 2.8 2.9 3.0 3.1 3.2
-2.2 -2.1 -2.0 -1.9 -1.8 -1.7
A
B
1/T x10-3
Log
K
Mechanism of the reaction
The stoichiometry of the reaction between ebastine and citric acid anhydride was studied using limiting logarith-mic method [36]. As shown in Figure 16, a plot of log RFI versus log [CAA] and log [ebastine] gave straight lines. The values of the slopes were 0.85 and 1.015 respectively; pointing out that the drug reacts with the fluorigenic reagent in a ratio of 1:1. By analogy to a pre-vious study [37], the reaction pathway is proposed to proceed as shown in scheme 1.Scheme 1
Proposal of the reaction pathway between EBS
and CAA.
Conclusion
Two validated stability indicating spectrofluorimetric methods were developed for the determination of ebas-tine (EBS) in pharmaceutical preparations depending on reaction with its tertiary amino group. The simpli-city, low cost, and sensitivity of the proposed methods allow their use in quality control laboratories for rou-tine work.
Acknowledgements
This work was financially supported by Faculty of pharmacy, Mansoura University.
Authors’contributions
FI designed the proposed method and analyzed the data statistically. MKSE proposed, planned and supervised the whole work. MIE coordinated the study and modified the text. MEKW carried out the experimental work. All authors read and approved the final manuscript.
Competing interests
The authors declare that they have no competing interests.
Received: 23 December 2010 Accepted: 8 March 2011 Published: 8 March 2011
References
1. Patai S:The chemistry of thiol group, Part 2.John Willy & Sons, Inc., New
York; 1974.
2. Kang W, Liu KH, Ryu JY, Shin JG:Simultaneous determination of ebastine
and its three metabolites in plasma using liquid chromatography-tandem mass spectrometry.J Chromatog B2004,813(1-2):75-80.
3. Matsuda M, Mizuki Y, Terauchi Y:Simultaneous determination of the
histamine H1-receptor antagonist ebastine and its two metabolites,
carebastine and hydroxyebastine, in human plasma using high-performance liquid chromatography.J Chromatog B2001,757(2):173-179.
4. Fiegel F:Spot Tests in Organic Analysis.Elsevier, Amsterdam;, 7 1966, 251.
5. Pesez M, Bartos J:Elements de fluorimetrie organique fonctionnelle-II.
Talanta1969,16(3):331-336.
6. Abdellatef HE, El-Henawee MM, El-Sayed HM, Ayad MM:
Spectrophotometric and spectrofluorimetric methods for analysis of tramadol, acebutolol and dothiepin in pharmaceutical preparations.
Spectrochim Acta2006,65(5):1087-1092.
7. El-Yazbi FA, Gazy AA, Mahgoub H, El-Sayed MA, Youssef RM:
Spectrophotometric determination of binary mixtures of pseudoephedrine with some histamine H1-receptor antagonists using derivative ratio
spectrum method.J Pharm Biomed Anal2003,31(4):801-809.
8. Gazy AA, Mahgoub H, El-Yazbi FA, El-Sayed MA, Youssef RM:Determination
of some histamine H1-receptor antagonists in dosage forms.J Pharm
Biomed Anal2002,30(3):859-867.
9. Mahía PL, Gándara JS, Losada PP, Abuín SP, Lozano JS:Determination of
tertiary amines in non-aqueous solvents in the presence of primary and secondary amines. Application to 1:3 BADGE/m-XDA equivalent ratio epoxy-amine formulations.Fres J Anal Chem1992,342:581-585.
10. Chen GZ, Huang XZ, Xu JG, Zheng ZZ, Wang ZB:The Methods Of
Fluorescence Analysis.Science Press, Beijing, R.P.China;, 2 1990, 112.
11. Patra D, Mishra AK:Recent developments in multi-component
synchronous fluorescence scan analysis.Trends Anal Chem2002,
21(12):787-798.
12. Lloyd JBF:Synchronized Excitation of Fluorescence Emission Spectra.Nat
Phys Sci1971,231:64-65.
13. John B, Soutar I:Identification of crude oils by synchronous excitation
spectrofluorimetry.Anal Chem1976,48(3):520-524.
14. Aodeng GW, Zhang Y, Fan HY:Determination of metacycline in mixture
sample by synchronous-derivative fluorimetry.Guang Pu Xue Yu Guang
Pu Fen Xi2006,26(8):1530-1532.
15. Karim MM, Jeon CW, Lee HS, Alam SM, Lee SH, Choi JH, Jin SO, Das AK:
Simultaneous determination of acetylsalicylic acid and caffeine in pharmaceutical formulation by first derivative synchronous fluorimetric method.J Fluoresc2006,16(5):713-721.
16. Wei YF, Li XH, Ma DM:Simultaneous determination of aspirin and
salicyclic acid by synchronous fluorescence spectrometry.Guang Pu Xue
Yu Guang Pu Fen Xi2005,25(4):588-590.
17. Murillo Pulgarin JA, Alanon Molina A, Fernandez Lopez P, Sanchez-Ferrer
Robles I:Direct determination of closely overlapping drug mixtures of
diflunisal and salicylic acid in serum by means of derivative matrix isopotential synchronous fluorescence spectrometry.Anal Chim Acta
2007,583(1):55-62.
18. Wang HY, Xiao Y, Han J:Simultaneous Determination of Carvedilol and
Ampicillin Sodium by First-Derivative Fluorometry in the Presence of Human Serum Albumin.Anal Sci2005,21(5):537-540.
0.0 0.1 0.2 0.3 0.4 0.5 0.6 0.7 0.8
2.10 2.35 2.60 2.85 3.10
Log volume of mixed anhydride
Log R
F
I
-1.25 -1.00 -0.75 -0.50 -0.25 0.00
1.75 2.00 2.25 2.50 2.75 3.00 3.25
Log concentraion of ebastine
Log
RF
I
19. Fernandez-Gonzalez R, Garcia-Falcon MS, Simal-Gandara J:Quantitative analysis for oxytetracycline in medicated premixes and feeds by second-derivative synchronous spectrofluorimetry.Anal Chim Acta2002,
455(1):143-148.
20. Walash MI, Belal F, El Enany N, Abdelal AA:Second-derivative Synchronous
Fluorometric Method for the Simultaneous Determination of Cinnarizine and Domperidone in Pharmaceutical Preparations. Application to Biological Fluids.J Fluoresc2008,18(1):61-74.
21. Walash MI, Belal F, El Enany N, Abdelal AA:Second-derivative synchronous
fluorescence spectroscopy for the simultaneous determination of cinnarizine and nicergoline in pharmaceutical preparations.J AOAC Int
2008,91(2):349-359.
22. Walash M, Sharaf El-Din M, El-Enany M, Eid M, Shalan S:First Derivative
Synchronous Fluorescence Spectroscopy for the Simultaneous Determination of Sulpiride and Mebeverine Hydrochloride in Their Combined Tablets and Application to Real Human Plasma.J Fluoresc
2010,20(6):1275-1285.
23. García-Falcón MS, Simal-Gándara J, Carril-González-Barros ST:Analysis of
benzo[a]pyrene in spiked fatty foods by second derivative synchronous spectrofluorimetry after microwave-assisted treatment of samples.Food
Addit Contam2000,17(12):957-964.
24. Abdelal A, El-Enany N, Belal F:Simultaneous determination of sulpiride
and its alkaline degradation product by second derivative synchronous fluorescence spectroscopy.Talanta2009,80(2):880-888.
25. Grande BC, Falcón MSG, Pérez-Lamela C, Comesaña MR, Gándara JS:
Quantitative analysis of colistin and tiamulin in liquid and solid medicated premixes by HPLC-diode array methods.Chromatographia
2001,53:460-463.
26. Grande BC, Falcón MSG, Comesaña MR, Gándara JS:Determination of
sulfamethazine and trimethoprim in liquid feed premixes by HPLC and diode array detection, with an analysis of the uncertainty of the analytical results.J Agri Food Chem2001,49(7):3145-3150.
27. Cancho-Grande B, Rodríguez-Comesaña M, Simal-Gándara J:Simple HPLC
Determination of Colistin in Medicated Feeds by Pre-Column Derivatization and Fluorescence Detection.Chromatographia2001,
54:481-484.
28. Rodríguez-Comesaña M, Cancho-Grande B, Simal-Gándara J:Screening
method for cross contamination detection of tiamulin residues in swine feeds.J AOAC Inter2003,86(3):449-452.
29. Zayas-Blanco F, García-Falcón MS, Simal-Gándara J:Determination of
sulfamethazine in milk by solid phase extraction and liquid chromatographic separation with ultraviolet detection.Food Control
2004,15:375-378.
30. Arias M, García-Falcón MS, García-Río L, Mejuto JC, Rial-Otero R,
Simal-Gándara J:Binding constants of oxytetracycline to animal feed divalent
cations.J Food Eng2007,78(1):69-73.
31. Guidance for industry; Q2B Validation of analytical procedure:
Methodology; International Conference on Hormonization (ICH).2005 [http://www.fda.gov/downloads/Drugs/
GuidanceComplianceRegulatoryInformation/Guidances/ucm073384.pdf].
32. British Pharmacopoeia Commission:The British Pharmacopoeia.The
Stationary Office: London2007.
33. Fischer H, Gottschlich R, Seelig A:Blood-Brain Barrier Permeation:
Molecular Parameters Governing Passive Diffusion.J Membrane Biol1998,
165(3):201-211.
34. United States Pharmacopeial Convention:United States Pharmacopoeia
30; National Formulary 25.US Pharmacopoeia Convention: Rockville, MD; 2007.
35. Miller JC, Miller JN:Statistics for analytical chemistry.Wiley; New York;
2005, 256.
36. Skoog DA, Crouch SR, Holler FJ, Holler FJ, Crouch SR:Principles of
Instrumental Analysis.Brooks & Cole, New York;, 6 2006:chapter 14:329.
37. Al-Majed AA, Al-Zehouri J, Belal F:Use of mixed anhydrides for the
determination of terfenadine in dosage forms and spiked human plasma.J Pharm Biomed Anal2000,23(2-3):281-289.
doi:10.1186/1752-153X-5-11
Cite this article as:Ibrahimet al.:Validated stability-indicating spectrofluorimetric methods for the determination of ebastine in pharmaceutical preparations.Chemistry Central Journal20115:11.
Open access provides opportunities to our colleagues in other parts of the globe, by allowing
anyone to view the content free of charge.
Publish with
Chemistry
Central and every
scientist can read your work free of charge
W. Jeffery Hurst, The Hershey Company.
available free of charge to the entire scientific community peer reviewed and published immediately upon acceptance cited in PubMed and archived on PubMed Central yours you keep the copyright
Submit your manuscript here: