Issues
ISSN: 2146-4138
available at http: www.econjournals.com
International Journal of Economics and Financial Issues, 2017, 7(2), 544-550.
How Does Monetary Policy Affect Economic Vulnerability to Oil
Price Shock as against US Economy Shock?
Fatemeh Razmi
1*, Azali Mohamed
2, Lee Chin
3, Muzafar Shah Habibullah
41Department of Economics, Faculty of Economics and Management, Universiti Putra Malaysia, Malaysia, 2Department of Economics, Faculty of Economics and Management, Universiti Putra Malaysia, Malaysia, 3Department of Economics, Faculty of Economics and Management, Universiti Putra Malaysia, Malaysia, 4Department of Economics, Faculty of Economics and Management, Universiti Putra Malaysia, Malaysia. *Email: sfrazmy@yahoo.com
ABSTRACT
This paper investigates the role of the monetary policy in protecting the economy against the external shocks of US output and oil price during the
2007-2009 financial crisis. It also considers economic vulnerability caused by these external shocks after the crisis abated. The application of the structural vector auto regression model using monthly data from 2002:M1 to 2013:M4 for Indonesia, Malaysia, and Thailand shows that poor influence
of monetary policies on monetary policy transmission channels (namely, interest rate, exchange rate, domestic credit, and stock price) in the pre-crisis
period could not shield these economies from shocks of oil price and US output. The results of post-crisis period indicate a significant increase in
the positive impact of monetary policy on channels of monetary transmission channels compared to the pre-crisis period. However, these economies continue to remain vulnerable to oil price shocks.
Keywords: Monetary Transmission, Global Financial Crisis, Monetary Policy, Domestic Credit, Stock Price, Exchange Rate, Interest Rate, Oil Price Shock, US Economy
JEL Classifications: E0, E60
1. INTRODUCTION
Monetary policy is designed to reach economic goals and is transmitted to the economy through well-known channels of monetary transmission mechanisms including the interest rate, exchange rate, credit, and asset prices (Bernanke, 1992; Bernanke and Gertler, 1995; Mishkin, 1995; 1996; 2001; Taylor, 1995). In order to achieve economic objectives, it is vital to ensure that the monetary policy impacts the monetary transmission mechanisms effectively. Therefore, many economic studies have investigated monetary transmission by considering the effects of monetary policy on the interest rate (e.g., Chong, 2010; Karagiannis et al., 2010), on the exchange rate (e.g., Aleem, 2010; Montes, 2013; Ono, 2013), on domestic credit (Juurikkala et al., 2011; Kishan and Opiela, 2006; Sengonul and Thorbecke, 2005), and on asset price (e.g., Koivu, 2012; Laopodis, 2013; Li et al., 2010). Although these four variables are factors of monetary policy transmission, monetary policy is not the only factor influencing these channels.
Thus, the influences of other factors might prevent policy makers from achieving their intended economic goals.
on other economies regarding this role (Bagliano and Morana, 2012; Cuñado and Pérez de Gracia, 2003; Hamilton, 1983; 2011). During global financial crises, the channels of monetary policy transmission can also be affected by the oil price and the US economy. Similarly, a country can withstand oil price and US economy shocks causing the global crisis if its monetary policy, namely, the effect of the monetary policy on the channels of monetary transmission mechanisms, is robust. Thus, it stands to reason that if a monetary policy was robust enough, it could withstand the external shocks from oil price and US economy and minimize their effects on a country’s economy during periods of financial crisis. Therefore, it would be interesting to study the circumstances under which a monetary policy allows/ disallows external shocks to pose a threat to the economy. Thus, this study considers the effects of monetary policy as well as oil price and US output, as representation of US economy, shocks on select economies during the pre- and post-crisis periods of the 2007-2009 global financial crisis.
The following two hypotheses are tested for the pre-crisis and post-crisis periods. First, in countries affected by the global crisis, the weaker the effectiveness of the monetary policy against oil price and US output shocks on channels of monetary transmission mechanisms during the pre-crisis period, the greater the downturn during the crisis. Second, in the post-crisis period, the strength of the monetary policy in the face of oil price and US output increases due to economic reforms instituted during the crisis, and thus, the economy is no longer vulnerable to external shocks during this period.
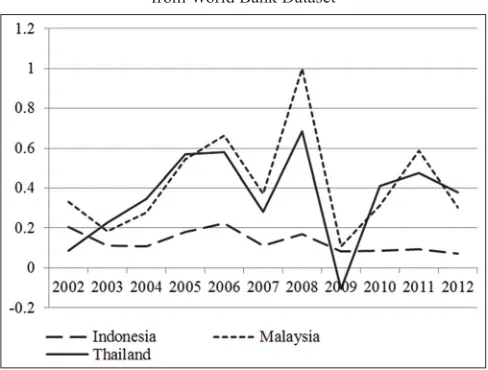
This study focuses on the strength of the monetary policies of three countries, Indonesia, Malaysia, and Thailand, during the global financial crisis of 2007-2009. A review of gross domestic product growth and inflation suggests that these countries experienced an economic downturn during 2007-2009. Figures 1 and 2 use normalized data from the World Bank Dataset and show high inflation and low output growth in these three countries during 2007-2009. Unlike Indonesia, Malaysia and Thailand were severely affected by the global crisis. However, despite the considerable impact of external shocks in these countries during the crisis period, no study has considered the role of monetary transmission mechanisms during 2007-2009 specifically. While some studies have studied the monetary transmission mechanisms in these countries during specific periods (e.g., Azali, 2003; Azali and Matthews, 1999; Disyatat and Vongsinsirikul, 2003; Hesse, 2007; Raghavan and Silvapulle, 2008; Raghavan et al., 2012), there is a gap in the literature regarding the most recent global financial crisis. This study aims to fill this gap. Moreover, although many studies have focused on monetary policy and monetary transmission mechanisms, to the best of our knowledge, no researcher to date has studied an economy’s vulnerability to oil price and US output due to the prevailing interest rate, exchange rate, credit, and asset prices. Therefore, this study is the first of its kind to show that the economic vulnerability of the above-mentioned countries during the 2007-2009 crisis was a result of a weak monetary policy, which could not protect the channels of monetary transmission mechanisms against oil price and US output shocks. The study
also shows that despite experiencing the global financial crisis, the countries’ vulnerability against the same external shocks has not necessarily diminished.
2. MODEL AND METHODOLOGY
2.1. Data
This paper uses monthly data from 2002:M1 to 2013:M4. yt represents the vector of variables: yt = [int, m2, cpi, ip, oil, USip, dc, eer, sp], where int, m2, cpi, ip, oil, USip, dc, eer, and sp stand for interest rate, broad money, consumer price index, industrial production, oil price, US industrial production, domestic credit, effective exchange rate, and stock price, respectively. All the variables, except int, are in the logarithmic form and in level. Vector autoregression (VAR) in level is generally the norm in studies on monetary policy (e.g. Bernanke and Mihov, 1995; Bernanke and Mihov, 1997; Peersman and Smets, 2001; Shibamoto and Shizume, 2014). Using stationary variables is not important as long as analysis relies on impulse response and variance decomposition in short time. According to Brooks (2014) differencing removes the information about co-movements in variables.
Figure 2: Rate of inflation. Data are normalized and from World Bank
Dataset
Figure 1: Gross domestic product growth. Data are normalized and
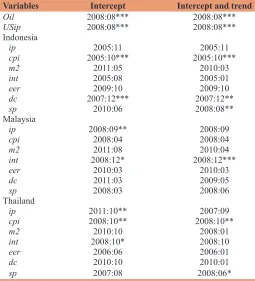
Following Zivot and Andrews (1992), we split the sample into pre-and post-crisis periods. Instead of using joint variables, we test each variable for structural breaks, to find the variables most affected by the crisis. Moreover, testing for structural breaks in series improves VAR performance and forecasting quality (Hassani et al., 2009). Several researchers divide their samples based on the existence of structural breaks in each series (Baek and Koo, 2010; Bayrak and Esen, 2013; Narayan, 2004; Okunev et al., 2002; Pala, 2013; Gerlach et al., 2006). Table 1 presents the results of the two models of the Zivot–Andrews test: (i) Intercept and (ii) intercept and trends.
The pre-crisis period ends with the first statistically significant structural break date during 2007-2009, and the post-crisis period starts with the last statistically significant structural break date during the same period. For example, for Indonesia, 2007:12 and 2008:08 are respectively the first and last statistically significant dates showing structural breaks. Thus, the pre-crisis period ranges from 2002:01 to 2007:11, and the post-crisis period ranges from 2008:09 to 2013:04, with a dummy variable for 2005:10. The corresponding samples of the other countries are as follows: 2002:01 to 2008:07 and 2009:01 to 2013:04 for Malaysia, and 2002:01 to 2007:12 and 2008:11 to 2013:04 for Thailand, with a dummy variable for 2011:10.
2.2. Model and Identification
VAR models are typically employed in studies on monetary policy since they assess the responses of variables to monetary policy shocks. However, the pure VAR model is a theoretical in nature, and thus, it has been criticized by economists. The structural VAR
approach is preferable to VAR given that the latter depends on partial identification and Cholesky decomposition (Elbourne, 2008). The structural VAR model of this paper is based on Kim and Roubini (2000) with some modifications.
Equation (1) shows the reduced form of the VAR.
A0Xt = A(L)Xt−1 + νt (1)
Where, Xt denotes endogenous variables, Xt−1 is the lagged valued, and νt is a vector of error terms. The vector auto regression in reduced form is shown in equation (2):
Xt = C(L) Xt−1 + ut (2)
Where, C L( )=A(−)A L( ) 0
1 indicates the coefficients of lagged
variables, and ut =0−1t is the observed vector of residuals linked
to the structural shocks. Thus,
εt = Aut (3)
The variance–covariance between the observed element, ut, and the non-observed element, εt, is shown in equation 3.
Ω =
12 1
21 22 2
31 . . . . . . . . . . . . . . . . . . . . . . . . n n
n11 2
2 n . . . . n (4)
σij in matrix Ω can be calculated as ij t
T it jt
T u u
=
=
∑
11
/ . The
variance–covariance of Ω includes (n2+n)/2 distinct elements,
A includes n2−n unknown values, and var ε
ij contains n unknowns. Thus, we have n2−n + n = n2 unknowns and (n2+n)/2 knowns; consequently, the restriction on the system is n2 n2 n n2 n
2 2
− + = − .
Therefore, 36 restrictions are needed to identify the 9 variables in the structural VAR model used in this study.
2.2.1. Identification
Equation 5 is drawn from εt = Aut and displays the restrictions on the structural VAR model in this study.
ε ε ε ε ε ε ε ε ε oil usip ip cpi m int dc eer sp =
1 0 0 0 0 0 0 0 0
1 0 0 0 0 0 0 0
1 0 0 0 0 0 0
0 1 0 0 0 0 0
0 0 21 31 32 41 43 53 α α α α α
α α554 56
61 65
71 73 76
81 82 83 84 85 86 8
1 0 0 0
0 0 0 1 0 0 0
0 0 0 1 0 0
α
α α
α α α
α α α α α α α77
91 92 93 94 95 96 97 98
1 0
1
α α α α α α α α
uooil usip ip cpi m int dc eer sp u u u u u u u u (5) Table 1: Zivot–Andrews structural break results
Variables Intercept Intercept and trend
Oil 2008:08*** 2008:08***
USip 2008:08*** 2008:08***
Indonesia
ip 2005:11 2005:11
cpi 2005:10*** 2005:10***
m2 2011:05 2010:03
int 2005:08 2005:01
eer 2009:10 2009:10
dc 2007:12*** 2007:12**
sp 2010:06 2008:08**
Malaysia
ip 2008:09** 2008:09
cpi 2008:04 2008:04
m2 2011:08 2010:04
int 2008:12* 2008:12***
eer 2010:03 2010:03
dc 2011:03 2009:05
sp 2008:03 2008:06
Thailand
ip 2011:10** 2007:09
cpi 2008:10** 2008:10**
m2 2010:10 2008:01
int 2008:10* 2008:10
eer 2006:06 2006:01
dc 2010:10 2010:01
sp 2007:08 2008:06*
***, ** and *show significance at 1%, 5%, and 10%, respectively. Oil: Oil price,
USip: US industrial production, ip: Industrial production, cpi: Consumer price index,
m2: Broad money, int: Interest rate, eer: Effective exchange rate, dc: Domestic credit,
In the first two rows of equation (5) oil and USip represent exogenous variables that disconnect supply side shocks from monetary policy shocks. They assume the role of international exogenous shocks that affect economies during global financial crises. According to Bagliano and Morana (2012), the downturns of the US economy can be transmitted through US output to Latin America and Southeast Asian countries.
cpi and ip, which are the equations referring to the commodity markets, must be in equilibrium. oil price as inflation expectations affect industrial production and cpi since monthly information on inflation is unavailable. The US influences the industrial production of countries as it is one of their major trade partners. In the fifth row, m denotes money demand, which is theoretically influenced by the int,cpi, and ip. int also refers to the money supply reaction function, a function of money and oil price, as a price expectation. dc or domestic credit is contemporaneously influenced by industrial production and the real interest rate (i.e., interest rate minus inflation), since borrowers are concerned about the real cost of credit (Wulandari, 2012). The two final equations denote the effective exchange rate, eer, and stock price, sp. The sensitivity of these two variables to the news, given their forward-looking property, causes them to be influenced contemporaneously by all the variables in the system. However, this study is similar to previous studies (Elbourne and Salomons, 2004; Li et al., 2010) in that the exchange rate contemporaneously influences stock price. The one-way direction from the exchange rate to stock price was discovered by Liang et al. (2013) for ASEAN-5 countries.
3. EMPIRICAL RESULTS
This study selects the lags for three lags for the pre-crisis period and two lags for the post-crisis period depending on the results of the Akaike information criterion, Bayesian information criterion, and likelihood ratio tests, the emphasis being on the least serial
correlation in the residuals (Buckle et al., 2007; Voss, 2002). The over identifying restrictions in the structural VAR models are not rejected for any of the three countries (Table 2).
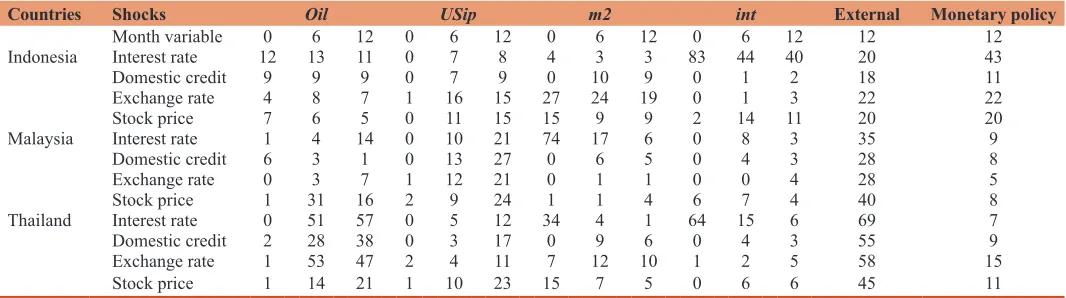
Tables 3 and 4 show the contributions of oil price and US industrial production as external shocks, and of money supply and interest rate as monetary policy shocks, respectively. The tables present the fluctuations in each channel of monetary transmission mechanisms in the 1st, 6th, and 12th months during the pre-and post-crisis periods. The last two columns indicate the roles of (a) Both external shocks and (b) monetary policy variable-related shocks, and they include interest rate and money supply in the 12th month. The outcomes of variance decomposition (Table 3) show that money had the greatest impact on interest rates given the monetary policy stance prevailing in Malaysia and Thailand during the pre-crisis period. The results showing the role of the monetary policy in exchange rate fluctuations—m2 accounts for 27% of the variations in exchange rates in Indonesia—suggests that the monetary policy in that country was mainly focused on the exchange rate during the pre-crisis period. Considering the effects of exogenous variables on the variables of the monetary transmission mechanisms, oil price plays the greatest role in explaining fluctuations in all four channels of the monetary transmission mechanisms in Thailand, while the monetary transmission mechanisms in Malaysia was mostly influenced by US industrial production during the pre-crisis period. A common point in the monetary transmission mechanisms in these countries is stock price, which was affected significantly by external shocks. With the exception of Indonesia, oil price had a significant impact on stock price in all countries during the pre-crisis period. Oil price accounted for a maximum of 31% and 21% of variations in stock prices in Malaysia and Thailand, respectively, during the pre-crisis period (Table 3). The stock price was also greatly influenced by US industrial production in all countries during the pre-crisis period; US industrial production explained variations in stock prices of up to about 15% for Indonesia, 24% for Malaysia, and 23% for Thailand during this period.
Comparing the contribution of monetary policy shocks versus external shocks to fluctuations in the four channels of monetary transmission mechanisms in the 12th month shows the weakness of the monetary policy against oil price and US output in Malaysia and Thailand. On the other hand, monetary policy performed Table 2: Chi-squared for over-identifying restrictions
Countries Pre-crisis Significant
level Post-crisis Significant level
Indonesia 12.49 0.130 7.30 0.504
Malaysia 9.52 0.300 10.75 0.215
Thailand 8.16 0.417 3.70 0.882
Table 3: Variance decomposition of monetary transmission channels due to monetary policy and external shocks during pre-crisis period
Countries Shocks Oil USip m2 int External Monetary policy
Month variable 0 6 12 0 6 12 0 6 12 0 6 12 12 12
Indonesia Interest rate 12 13 11 0 7 8 4 3 3 83 44 40 20 43
Domestic credit 9 9 9 0 7 9 0 10 9 0 1 2 18 11
Exchange rate 4 8 7 1 16 15 27 24 19 0 1 3 22 22
Stock price 7 6 5 0 11 15 15 9 9 2 14 11 20 20
Malaysia Interest rate 1 4 14 0 10 21 74 17 6 0 8 3 35 9
Domestic credit 6 3 1 0 13 27 0 6 5 0 4 3 28 8
Exchange rate 0 3 7 1 12 21 0 1 1 0 0 4 28 5
Stock price 1 31 16 2 9 24 1 1 4 6 7 4 40 8
Thailand Interest rate 0 51 57 0 5 12 34 4 1 64 15 6 69 7
Domestic credit 2 28 38 0 3 17 0 9 6 0 4 3 55 9
Exchange rate 1 53 47 2 4 11 7 12 10 1 2 5 58 15
fairly well in Indonesia during the same time period. According to Figures 1 and 2, unlike Indonesia, Malaysia and Thailand experienced a significant economic downturn during the global crisis. Thus, the first hypothesis stands proved, namely, a stronger effect of monetary policy against oil price and US output on channels of monetary transmission mechanisms can protect the economy from external shocks, thus the economy experience less downturn during the crisis period.
Table 4 presents the results of the variance decomposition. They indicate the minor impact of US industrial production as well as the considerable contribution of monetary policy on fluctuations in the channels of monetary transmission mechanisms during the post-crisis period. Oil price continued to play an important role in explaining the fluctuations of these variables. Compared to oil price, monetary policy played a weaker role in all channels except for the exchange rate of Indonesia, domestic credit of Malaysia, and interest rate of Thailand. Monetary policy could explain 39% of fluctuations in the exchange rate in Indonesia, 23% of the fluctuations in domestic credit in Malaysia, and 39% of volatility in interest rates in Malaysia and Thailand in last month. Despite reducing the impact of external shocks and improving the effectiveness of the monetary policy at peaks compared to the pre-crisis period, oil price continued to provide significant external shocks, especially to stock prices. Oil price explained 33%, 18%, and 37% of fluctuations in stock prices for Indonesia, Malaysia, and Thailand, at peaks, respectively. The role of US industrial production in affecting the channels of monetary transmission mechanisms, however, weakened. However, it continued to pose a threat to the economies of Indonesia and Malaysia through the exchange rate channel. US industrial production accounted for 11% and 22% of the fluctuations in exchange rates in Indonesia and Malaysia, respectively. In general, these countries were still vulnerable to external shocks in the post-crisis period; especially those provided by oil price, and thus, the second hypothesis cannot be accepted.
4. CONCLUSION
This research investigated whether monetary policy could protect the economies of Indonesia, Malaysia, and Thailand against oil price and US output, the two shocks that are known to have played
important roles in the global financial crisis of 2007-2009. It also considered whether the same external shocks continued to pose a threat to the economies after the crisis. The study tested the efficiency of the monetary policy on four known channels of monetary transmission mechanisms, namely, interest rate, exchange rate, domestic credit, and stock price, during the pre-crisis and post-pre-crisis periods. To do so, it tested two hypotheses for the pre-crisis and post-crisis periods. The first hypothesis, for the pre-crisis period, states that the weaker the influence of the monetary policy on monetary transmission mechanisms, the higher the impact of the global crisis on the economies. The second hypothesis, for the post-crisis period, states that the countries are not vulnerable against external shocks because of the strength of their respective monetary policies, which affect the channels of monetary transmission; in other words, the economic reforms undertaken by these economies have helped them avoid another financial crisis.
The results suggest that the monetary policies of both Malaysia and Thailand, countries that experienced depression during the crisis, were weak at influencing channels of monetary transmission mechanisms, while that of Indonesia was fairly good, thus leading the country to experience a smaller economic downturn during the crisis. Therefore, we conclude that monetary policy weakly influences channels of monetary policy transmission mechanisms, leading to spillover effects of the global crisis in these countries. In other words, the first hypothesis is accepted. After the crisis, however, the monetary policies of these countries were shown to have been generally more effective, as they impacted the channels of monetary transmission mechanisms to a greater extent than in the pre-crisis period. The impact of oil price on the channels of monetary policy continued to be considerable; therefore, these countries may be at risk of facing an oil price-related shock. Thus, the second hypothesis is rejected. The vulnerability of the channels of monetary transmission mechanisms to US output shocks declined greatly after the crisis. This may be attributed to the fact that these ASEAN countries replaced the US with China as their biggest trade partner. However, shocks to the US economy are still transmittable to Indonesia and Malaysia through the exchange rate route. It should be noted that although the countries showed differences in the impacts of external shocks on the Table 4: Variance decomposition of monetary transmission channels due to monetary policy and external shocks during the post-crisis period
Countries Shocks Oil USip m2 int External Monetary policy
Month variable 0 6 12 0 6 12 0 6 12 0 6 12 12 12
Indonesia Interest rate 15 10 17 0 2 2 6 7 8 79 25 18 19 24
Domestic credit 5 27 30 0 0 0 0 5 5 9 7 6 30 11
Exchange rate 11 6 17 1 11 11 35 42 30 8 13 9 28 39
Stock price 11 21 33 1 5 4 1 6 4 27 21 13 37 17
Malaysia Interest rate 5 6 10 1 21 19 72 35 32 17 9 7 29 39
Domestic credit 1 5 5 0 6 6 0 16 15 0 9 8 11 23
Exchange rate 0 4 12 0 22 20 8 11 9 0 6 7 32 16
Stock price 8 15 18 2 6 8 20 14 13 4 6 6 24 19
Thailand Interest rate 0 16 9 0 6 4 64 46 34 20 5 5 13 39
Domestic credit 0 9 15 0 4 9 0 5 4 0 16 22 24 26
Exchange rate 0 18 16 2 5 8 1 5 13 6 1 1 24 15
channels of monetary transmission mechanisms, the stock prices in all these economies were considerably affected by oil price and US output during both periods. Future studies in this area could include the effects of external shocks on other kinds of assets, such as gold and housing prices. Moreover, a comparison between the strengths of the monetary policy and fiscal policy can help policy makers understand how they may protect the economy against external shocks.
REFERENCES
Aleem, A. (2010), Transmission mechanism of monetary policy in India. Journal of Asian Economics, 21(2), 186-197.
Ali Ahmed, H.J., Wadud, I.M. (2011), Role of oil price shocks on macroeconomic activities: An SVAR approach to the Malaysian economy and monetary responses. Energy Policy, 39(12), 8062-8069. Azali, M. (2003), Transmission mechanism in a developing economy:
Does money or credit matter. Serdang: University Putra Malaysia Press.
Azali, M., Matthews, K.G.P. (1999), Money-income and credit-income
relationships during the pre-and the post-liberalization periods:
Evidence from Malaysia. Applied Economics, 31(10), 1161-1170. Bachmeier, L. (2008), Monetary policy and the transmission of oil shocks.
Journal of Macroeconomics, 30(4), 1738-1755.
Baek, J., Koo, W.W. (2010), Analyzing factors affecting US food price inflation. Canadian Journal of Agricultural Economics/Revue Canadienne d’agroeconomie, 58(3), 303-320.
Bagliano, F.C., Morana, C. (2012), The great recession: US dynamics and
spillovers to the world economy. Journal of Banking and Finance, 36(1), 1-13.
Bayrak, M., Esen, O. (2013), Examining the policies in Turkey that
have been implemented during the structural reform process from the standpoint of growth-unemployment. International Journal of
Economics and Finance, 5(6), 134-150.
Beaton, K., Lalonde, R., Snudden, S. (2014), The propagation of US shocks to Canada: Understanding the role of real financial linkages. Canadian Journal of Economics/Revue Canadienne d’économique, 47(2), 466-493.
Bernanke, B.S., Blinder, A.S. (1992), The federal funds rate and the channels of monetary transmission. The American Economic Review, 82(4), 901-921.
Bernanke, B.S., Gertler, M. (1995), Inside the Black Box: The Credit Channel of Monetary Policy Transmission. Working Paper No.
w5146. National Bureau of Economic Research.
Bernanke, B.S., Mihov, I. (1995), Measuring Monetary Policy. Cambridge, MA: National Bureau of Economic Research.
Bernanke, B.S., Mihov, I. (1997), What does the Bundesbank target? European Economic Review, 41(6), 1025-1053.
Berument, H., Kilinc, Z. (2004), The effect of foreign income on economic
performance of a small-open economy: Evidence from Turkey.
Applied Economics Letters, 11(8), 483-488.
Brooks, C. (2014), Introductory Econometrics for Finance. Cambridge:
Cambridge University Press.
Buckle, R.A., Kim, K., Kirkham, H., McLellan, N., Sharma, J. (2007), A structural VAR business cycle model for a volatile small open economy. Economic Modelling, 24(6), 990-1017.
Chong, B.S. (2010), Interest rate deregulation: Monetary policy efficacy and rate rigidity. Journal of Banking and Finance, 34(6), 1299-1307. Creti, A., Ftiti, Z., Guesmi, K. (2014), Oil price and financial markets:
Multivariate dynamic frequency analysis. Energy Policy, 73,
245-258.
Cuñado, J., Pérez de Gracia, F. (2003), Do oil price shocks matter?
Evidence for some European countries. Energy Economics, 25(2), 137-154.
Dagher, L., El Hariri, S. (2013), The impact of global oil price shocks on the Lebanese stock market. Energy, 63, 366-374.
Disyatat, P., Vongsinsirikul, P. (2003), Monetary policy and the transmission mechanism in Thailand. Journal of Asian Economics, 14(3), 389-418.
Eickmeier, S., Ng, T. (2015), How do US credit supply shocks propagate internationally? A GVAR approach. European Economic Review,
74, 128-145.
Elbourne, A. (2008), The UK housing market and the monetary policy transmission mechanism: An SVAR approach. Journal of Housing
Economics, 17(1), 65-87.
Elbourne, A., Salomons, R. (2004), Monetary Transmission and Equity Markets in the EU. SSRN Working Paper Series No. 04E15.
University of Groningen, Research Institute SOM (Systems, Organisations and Management).
Fowowe, B. (2014), Modelling the oil price-exchange rate nexus for South Africa. International Economics, 140, 36-48.
Gerlach, R., Wilson, P., Zurbruegg, R. (2006), Structural breaks and diversification: The impact of the 1997 Asian financial crisis on the integration of Asia-Pacific real estate markets. Journal of International Money and Finance, 25(6), 974-991.
Hamilton, J.D. (1983), Oil and the macroeconomy since World War II. The Journal of Political Economy, 91(2), 228-248.
Hamilton, J.D. (2011), Nonlinearities and the macroeconomic effects of
oil prices. Macroeconomic Dynamics, 15(S3), 364-378.
Hassani, H., Heravi, S., Zhigljavsky, A. (2009), Forecasting European
industrial production with singular spectrum analysis. International
Journal of Forecasting, 25(1), 103-118.
Hesse, H. (2007), Monetary policy, structural break and the monetary transmission mechanism in Thailand. Journal of Asian Economics, 18(4), 649-669.
Iwayemi, A., Fowowe, B. (2011), Impact of oil price shocks on selected macroeconomic variables in Nigeria. Energy Policy, 39(2), 603-612. Juurikkala, T., Karas, A., Solanko, L. (2011), The role of banks in
monetary policy transmission: Empirical evidence from Russia.
Review of International Economics, 19(1), 109-121.
Karagiannis, S., Panagopoulos, Y., Vlamis, P. (2010), Interest rate pass-through in Europe and the US: Monetary policy after the financial
crisis. Journal of Policy Modelling, 32(3), 323-338.
Kim, S., Roubini, N. (2000), Exchange rate anomalies in the industrial countries: A solution with a structural VAR approach. Journal of
Monetary Economics, 45(3), 561-586.
Kishan, R.P., Opiela, T.P. (2006), Bank capital and loan asymmetry in the
transmission of monetary policy. Journal of Banking and Finance,
30(1), 259-285.
Koivu, T. (2012), Monetary policy, asset prices and consumption in China. Economic Systems, 36(2), 307-325.
Laopodis, N.T. (2013), Monetary policy and stock market dynamics across
monetary regimes. Journal of International Money and Finance, 33,
381-406.
Li, Y.D., İşcan, T.B., Xu, K. (2010), The impact of monetary policy shocks
on stock prices: Evidence from Canada and the United States. Journal
of International Money and Finance, 29(5), 876-896.
Liang, C.C., Lin, J.B., Hsu, H.C. (2013), Reexamining the relationships between stock prices and exchange rates in ASEAN-5 using panel Granger causality approach. Economic Modelling, 32, 560-563. Mishkin, F.S. (1995), Symposium on the monetary transmission
mechanism. The Journal of Economic Perspectives, 9(4), 3-10. Mishkin, F.S. (1996), The Channels of Monetary Transmission: Lessons
for Monetary Policy. NBER Working Paper No. w5464. National
Mishkin, F.S. (2001), The Transmission Mechanism and the Role of Asset Prices in Monetary Policy. NBER working Paper No. w8617.
National Bureau of Economic Research.
Montes, G.C. (2013), Credibility and monetary transmission channels under inflation targeting: An econometric analysis from a developing country. Economic Modelling, 30, 670-684.
Narayan, P.K. (2004), Do public investments crowd out private investments? Fresh evidence from Fiji. Journal of Policy Modelling,
26(6), 747-753.
Narayan, P.K., Narayan, S. (2010), Modelling the impact of oil prices on Vietnam’s stock prices. Applied Energy, 87(1), 356-361.
Okunev, J., Wilson, P., Zurbruegg, R. (2002), Relationships between Australian real estate and stock market prices - A case of market inefficiency. Journal of Forecasting, 21(3), 181-192.
Ono, S. (2013), The effects of foreign exchange and monetary policies
in Russia. Economic Systems, 37(4), 522-541.
Pala, A. (2013), Structural breaks, cointegration, and causality by VECM
analysis of crude oil and food price. International Journal of Energy Economics and Policy, 3(3), 238-246.
Peersman, G., Smets, F. (2001), The Monetary Transmission Mechanism in the Euro Area: More Evidence from VAR Analysis. Working Paper No. 091. European Central Bank.
Raghavan, M., Silvapulle, P. (2008), Structural VAR Approach to
Malaysian Monetary Policy Framework: Evidence from the
Pre-and post-Asian Crisis Periods. Paper Presented at the New ZealPre-and Association of Economics, NZAE Conference.
Raghavan, M., Silvapulle, P., Athanasopoulos, G. (2012), Structural VAR models for Malaysian monetary policy analysis during the pre-and post-1997 Asian crisis periods. Applied Economics, 44(29),
3841-3856.
Rahman, S., Serletis, A. (2010), The asymmetric effects of oil price and monetary policy shocks: A nonlinear VAR approach. Energy Economics, 32(6), 1460-1466.
Sengonul, A., Thorbecke, W. (2005), The effect of monetary policy on
bank lending in Turkey. Applied Financial Economics, 15(13), 931-934.
Shibamoto, M., Shizume, M. (2014), Exchange rate adjustment, monetary policy and fiscal stimulus in Japan’s escape from the great depression.
Explorations in Economic History, 53, 1-18.
Taylor, J.B. (1995), The monetary transmission mechanism: An empirical framework. The Journal of Economic Perspectives, 9(4), 11-26. The World Bank. (2012), World data Bank: World Development
Indicators (WDI) and Global Development Finance (GDF):1990-2010. Available from: http://www.worldbank.org. [Last retrieved on 2015 Aug 18].
Valadkhani, A., Chen, G. (2014), An empirical analysis of the US stock market and output growth volatility spillover effects on three Anglo-Saxon countries. International Review of Applied Economics, 28(3),
323-335.
Voss, G.M. (2002), Public and private investment in the United States and Canada. Economic Modelling, 19(4), 641-664.
Wu, M.H., Ni, Y.S. (2011), The effects of oil prices on inflation, interest
rates and money. Energy, 36(7), 4158-4164.
Wulandari, R. (2012), Do credit channel and interest rate channel play important role in monetary transmission mechanism in Indonesia? A structural vector autoregression model. Procedia-Social and
Behavioural Sciences, 65, 557-563.
Yamamoto, S. (2014), Transmission of US financial and trade shocks to Asian economies: Implications for spillover of the 2007-2009 US financial crisis. The North American Journal of Economics and Finance, 27, 88-103.
Zhang, C., Chen, X. (2011), The impact of global oil price shocks on China’s stock returns: Evidence from the ARJI(-ht)-EGARCH model.
Energy, 36(11), 6627-6633.
Zivot, E., Andrews, D.W.K. (1992), Further evidence on the great crash,
the oil-price shock, and the unit-root. Journal of Business and