R E S E A R C H A R T I C L E
Open Access
The effect of mode and context on survey results:
Analysis of data from the Health Survey for
England 2006 and the Boost Survey for London
Sarah Tipping
1*, Steven Hope
1, Kevin Pickering
1, Bob Erens
1, Marilyn A Roth
2, Jennifer S Mindell
2Abstract
Background:Health-related data at local level could be provided by supplementing national health surveys with local boosts. Self-completion surveys are less costly than interviews, enabling larger samples to be achieved for a given cost. However, even when the same questions are asked with the same wording, responses to survey questions may vary by mode of data collection. These measurement differences need to be investigated further. Methods:The Health Survey for England in London (’Core’) and a London Boost survey (’Boost’) used identical sampling strategies but different modes of data collection. Some data were collected by face-to-face interview in the Core and by self-completion in the Boost; other data were collected by self-completion questionnaire in both, but the context differed. Results were compared by mode of data collection using two approaches. The first examined differences in results that remained after adjusting the samples for differences in response. The second compared results after using propensity score matching to reduce any differences in sample composition.
Results:There were no significant differences between the two samples for prevalence of some variables including long-term illness, limiting long-term illness, current rates of smoking, whether participants drank alcohol, and how often they usually drank. However, there were a number of differences, some quite large, between some key measures including: general health, GHQ12 score, portions of fruit and vegetables consumed, levels of physical activity, and, to a lesser extent, smoking consumption, the number of alcohol units reported consumed on the heaviest day of drinking in the last week and perceived social support (among women only).
Conclusion:Survey mode and context can both affect the responses given. The effect is largest for complex question modules but was also seen for identical self-completion questions. Some data collected by interview and self-completion can be safely combined.
Background
Local government and health agencies need robust, valid local level data on health and health-related behaviours. National surveys of the health of the general population are becoming more common [1] but these are not designed to provide data for local areas. Even a large survey like the Health Survey for England (HSE), an annual study of the health of the general population [2], would need an additional sample to enable local level analyses to be conducted. The optimal design for a boost sample is one which exactly matches that of the
national survey. However, as most large scale national surveys in the UK use face-to-face interviewing, this may be prohibitively expensive for local boosts. Switch-ing to a self-completion mode for the bulk of data col-lection maximises the sample size for a given budget, whilst retaining the features of the original sample design. Before making such a switch, measurement issues need to be taken into account. There is a large body of evidence to show that responses to survey ques-tions may vary by mode of data collection [3,4]. This is due to the particular features of each mode, including the design and delivery of the survey instrument, and
the ‘actors’ involved in the survey process, namely
respondents and interviewers [5]. For example, the pre-sence of an interviewer may improve data quality by * Correspondence: sarah.tipping@natcen.ac.uk
1
National Centre for Social Research (NatCen), 35 Northampton Square, London EC1V 0AX, UK
Full list of author information is available at the end of the article
guiding the respondent through a complex question-naire [6], but a self-completion mode may encourage respondents to give more honest answers to sensitive questions [7,8]. When considering combining data from different modes it is therefore important to assess issues of comparability [9].
The London Health Observatory (LHO) led a pan-London consortium to commission a local boost to the HSE using the less costly method of self-completion questionnaires. The Boost Survey for London used the same sampling strategy as the HSE but a different mode of data collection. Comparisons of the two samples showed few significant differences between the socio-demographic characteristics of the achieved households and individual adults. Moreover, after non-response weights were applied, both samples provide reasonably close correspondence with the London population for the characteristics examined [10]. This paper examines the extent to which the data from London participants in the HSE 2006, which primarily used face-to-face interviews, and the Boost Survey for London, which used self-completion questionnaires, are comparable, and the size and direction of any differences. The results for a number of health and health-related behaviours are compared.
Methods
Data and participants
The HSE is an cross-sectional survey that uses a new random sample each year. The core HSE sample is designed to be representative of the population in Eng-land living in private households. Data are collected about households and individuals using computer-assisted personal interviewing (CAPI). The interviewer
also measures the participants’ height and weight. A
small amount of information is collected during the interview using self-completion questionnaires [10-12]. Participants are later visited separately by a nurse for further measurements and the collection of biological samples. 58% of eligible households completed a house-hold interview. 85% of househouse-holds members aged 16 and over gave an individual interview, giving 1,569 inter-views in total [12].
The Boost Survey for London used self-completion questionnaires rather than face-to-face CAPI. Selected households were visited by interviewers, who con-ducted a short household interview (using a paper questionnaire), and distributed paper questionnaires to household members. Interviewers later returned to households to collect completed individual question-naires and to encourage non-responding individuals to participate. Interviewers also measured the height and weight of all consenting participants who were present at either of the visits. There was no nurse visit.
Questions were taken from the HSE self-completion questionnaires where these existed. Otherwise HSE questions were converted to self-completion format with the aim of keeping the question wording as simi-lar as possible to the HSE interview. 61% of eligible households and 65% of individuals in responding households aged 16 and over completed an interview, giving 5,004 interviews in total.
The samples for both surveys were selected using the same method, described in detail elsewhere [10,11]. All addresses were selected from the Royal Mail’s Postcode Address File (PAF). The sample was drawn in two stages; at the first stage a sample of postcode sectors were drawn as the primary sampling units (PSUs), with probability proportional to the total number of addresses within them. 102 London PSUs were selected for the HSE core sample and 202 for the London Boost. At the second stage 20 addresses were selected from each HSE PSU. For the London Boost, 40 addresses were selected within each inner London PSU, where response rates were expected to be lower, and 34 addresses were selected per outer London PSU. Prior to selection, the PAF was strati-fied by local authority (PCT within London) and the per-centage of households with a head of household in a non-manual occupation (Socio-Economic Groups 1-6, 13), taken from the 2001 Census. This was done to increase the precision of the sample.
All participants aged 16 years or over from the Boost Survey for London and all HSE participants of that age who were part of the core sample and resident in one of London’s Primary Care Trusts were included in the ana-lyses. Ethical approval was obtained for both surveys from the London Multi-centre Research Ethics Commit-tee prior to the surveys starting. Throughout the remain-der of this paper we refer to the London residents of the national HSE Core sample as the‘Core’and participants in the Boost Survey of London as the‘Boost’.
Whilst each questionnaire covered the same topics, the mode of delivering questions could differ. Most questions on the Core survey were asked by an inter-viewer using a CAPI questionnaire, whereas Boost parti-cipants completed a paper questionnaire. For some sets of questions, this affected the ease of finding the next question.
To elicit information on fruit and vegetable consump-tion and on physical activity, quesconsump-tions on the Core sur-vey were asked by an interviewer using a Computer Aided Personal Interviewing (CAPI) questionnaire enabled automatic question routing. However, Boost participants completed the paper questionnaire so had to follow some complex routing themselves.
day. When generating the summary measure, portions of fruit juice, dried fruit and pulses were capped at one portion each, regardless of how many were actually con-sumed, in accordance with Food Standards Agency guidelines [4].
Questions on physical activity were used to measure the proportion of participants meeting the government’s recommendation of 30 minutes or more of at least mod-erate intensity physical activity on five or more days a week. Both surveys asked about participation in heavy housework, manual/gardening/DIY (‘Do-It-Yourself’), walking, sports and occupational activity. Questions ascertained the number of days and the average amount of time spent doing each activity, and whether the activ-ity caused them to become out of breath or sweaty.
In the Core face-to-face interview, participants were presented with a show card listing 10 different activities, which were also read aloud by the interviewer. The amount of filtering used in the CAPI was much too complex for a self-completion format, so Boost partici-pants were provided with a list of the same 10 activities (and space to add up to three extra). The list included boxes for participants to record the number of days and time spent in each activity in the last four weeks, and whether or not the activity made them out of breath or sweaty.
Participants were asked to rate their general health as very good, good, fair, bad or very bad. They were then asked if they had any longstanding illness, and if so, whether it limited their daily activities. Although asked in different modes, these questions used identical word-ing in both the self-completion and face-to-face surveys. Some questions were asked in the same mode. Ques-tions about perceived social support the General Health Questionnaire (GHQ) 12, an indicator of psychological health, in which twelve questions are used to assess the participant’s present state relative to their usual, or nor-mal, state [13], were both asked in a self-completion format.
Smoking and alcohol use were collected via CAPI for the Core aged 25 and over and via a self-completion questionnaire for Core participants aged 16-17 inter-viewers used their discretion to choose which mode to use for Core adults aged 18-24 years. All Boost partici-pants were asked the questions in the self-completion format. Thus the context of the data collection varied: the presence or absence of an interviewer when the questions were answered, which other questions were in the self-completion questionnaire, and the order in which the topics were covered.
Analysis
Two complementary approaches were used to examine whether there were differences by data collection mode
for estimates of health and health-related behaviour. A comparison was made of weighted estimates taken from the two surveys to seek evidence of any residual bias that remained after non-response weights had been applied. These weights correct for unequal selection probabilities and the effects of differential non-response. The two samples were weighted separately using the same weighting procedure, which corrected for differen-tial responses by age, sex, household type and inner/ outer London. More details are given in the Additional file 1 and elsewhere [11]. These weighted estimates are the figures that would be reported from each survey.
The comparisons were then run a second time: non-response weights were not applied but instead an adjust-ment was made to reduce the differences in sample composition. If a difference were identified by both methods, then it was more likely to be a genuine effect of survey mode. The socio-demographic profile of the achieved Core sample was adjusted to match the achieved Boost sample using propensity score matching (PSM) [14]. PSM is a method that allows cases from a treatment sample (in this case the HSE Core sample in London) to be matched to cases from a control sample (the London Boost Sample). The matching controls for differences in sample profile; in this case the socio-demographic profile of the Core sample is adjusted to make it match that of the Boost. Matching the samples means any differences in survey estimates should be attributable to measurement error and not sample com-position [13]. Further details are provided in the Addi-tional file 1 and elsewhere [11].
The comparison of key results was then carried out on the matched samples, so that any differences could be attributable to measurement error rather than sam-ple composition. The analysis used the same methods to examine the effect of differential response but the matched weight was applied rather than the traditional non-response weight. The Core sample was adjusted
to match the unweightedBoost sample, so the samples
would be comparable with one another. For the remainder of this paper this is referred to as“matched data”.
Although non-response weighting adjusts the samples to the same population and makes them similar in terms of age and sex profiles, PSM results in two sam-ples that are a closer match because a wider pool of characteristics can be used to match the two samples.
As both samples were clustered, stratified and weighted, the analysis was run using the‘svy’commands in Stata 10 to account for the complex sample design. Men and women were analysed separately to minimise clustering at the household level.
Item non-response was higher in the Boost than Core survey [10,11]. The survey estimates in this report are based on valid estimates only; no attempt has been made to impute missing data. For each comparison the missing responses were excluded.
All figures in the text are based on weighted data. Unless otherwise stated, the patterns in the matched data were the same as those found in the weighted data.
Results
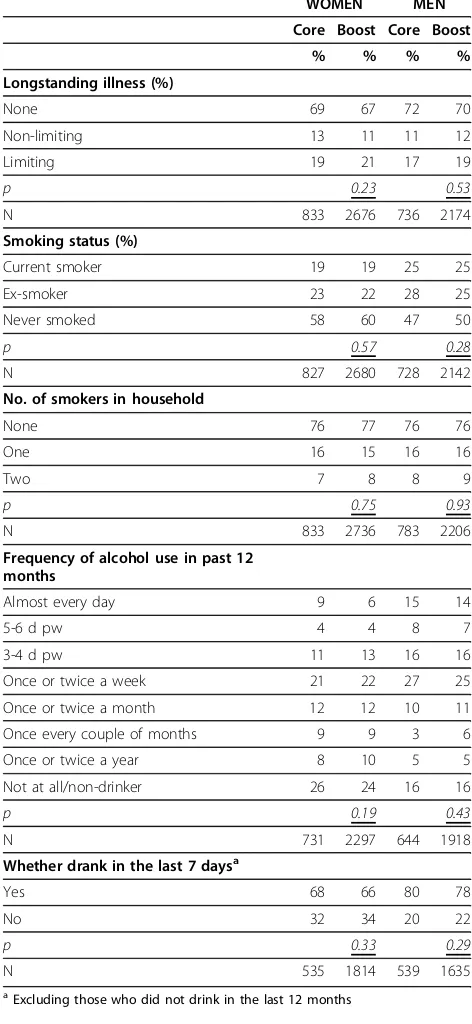
There were no significant differences in results between the Core and Boost samples for a number of variables including: long-term illness, limiting long-term illness, current rates of smoking, whether participants drank alco-hol and how often they usually drank (Table 1). There were differences, however, in levels of consumption reported. Women smokers in the Boost sample reported smoking on average 12.8 cigarettes per day, whereas the weighted mean for Core participants was 10.1 (p < 0.05). This difference was not significant in men (mean 13.5 for the Core and 12.4 for the Boost, weighted data).
Similarly, there were differences in the number of units of alcohol recorded, with Boost participants reporting a greater number of units than Core partici-pants (Table 2, showing weighted and match data) and having a higher prevalence of binge drinking. Of the participants over the age of 25, 44% of women and 50% of men in the Boost sample who had drunk alcohol in the previous week had exceeded the thresholds for binge drinking, compared with 33% of women and 34% of men in the Core.
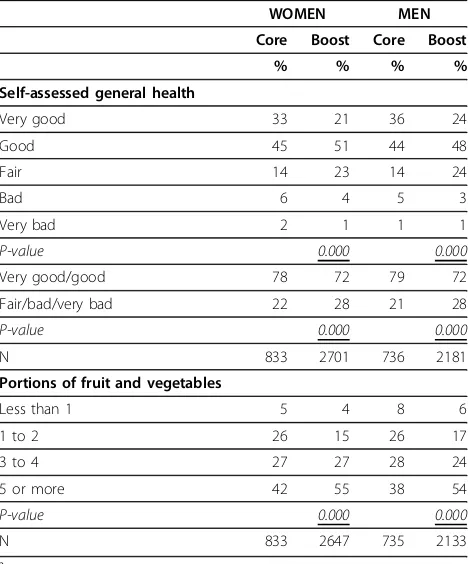
There were large differences in the responses regard-ing general health. The difference in the distribution of responses was highly significant (p < 0.001) for both men and women, with Core participants much more likely to say that their health was very good. Boost parti-cipant answers were more likely to be in the middle of the distribution and to state their general health was fair (Table 3).
The proportion of participants with a GHQ12 score of zero was higher for Core participants than Boost partici-pants; Boost participants were more likely to have a score of four or more, which indicates poor psychologi-cal health. Similarly, women in the Boost were signifi-cantly more likely than women in the Core to report either a severe lack, or no lack, of social support, although the actual percentage differences were not large. The same was not found for men (Table 4, show-ing matched data).
Boost participants reported consuming more portions of fruit and vegetables than Core participants. The dif-ferences between sample types were large:; 54% of men and 55% of women in the Boost sample met the
govern-ment’s 5-a-day recommendation, compared with 38% of
men and 42% of women in the Core (Table 3).
The number of portions recorded by Boost partici-pants for each category of fruit, juice, vegetable and
Table 1 Results not affected by survey mode
WOMEN MEN
Core Boost Core Boost
% % % %
Longstanding illness (%)
None 69 67 72 70
Non-limiting 13 11 11 12
Limiting 19 21 17 19
p 0.23 0.53
N 833 2676 736 2174
Smoking status (%)
Current smoker 19 19 25 25
Ex-smoker 23 22 28 25
Never smoked 58 60 47 50
p 0.57 0.28
N 827 2680 728 2142
No. of smokers in household
None 76 77 76 76
One 16 15 16 16
Two 7 8 8 9
p 0.75 0.93
N 833 2736 783 2206
Frequency of alcohol use in past 12 months
Almost every day 9 6 15 14
5-6 d pw 4 4 8 7
3-4 d pw 11 13 16 16
Once or twice a week 21 22 27 25
Once or twice a month 12 12 10 11
Once every couple of months 9 9 3 6
Once or twice a year 8 10 5 5
Not at all/non-drinker 26 24 16 16
p 0.19 0.43
N 731 2297 644 1918
Whether drank in the last 7 daysa
Yes 68 66 80 78
No 32 34 20 22
p 0.33 0.29
N 535 1814 539 1635
a
salad was consistently higher than the number recorded by Core participants. Boost participants were more likely to say they had eaten each category of fruit and vegeta-ble listed and, where a particular category had been recorded, they generally entered a greater number of portions.
There were also large differences between the Core and Boost samples in reported physical activity. The summary physical activity level for Boost participants was much lower than for Core participants (Table 5),
despite the reported rates of participation in sports and other activities being generally higher in the Boost sample. These differences are likely to be caused by the amount of missing data in the Boost, as described elsewhere [10,11]. Since the individual questions were combined to derive the summary activity measure, missing just one of the component variables resulted in a missing value for the summary variable. The sum-mary physical activity measure was missing for 16% of Boost participants, compared with 0.2% of Core participants.
Discussion
There were no significant differences between the Core and Boost for smoking prevalence, frequency of alcohol consumption, longstanding illness and limiting long-standing illness, all questions with simple answer
Table 2 Alcohol consumption on the heaviest drinking day in the last weeka
WOMEN MEN
Core Boost
P-value Core Boost value P-Mean units of alcohol Units Units Units Units
Weighted 4.7 6.0 0.000 7.1 8.8 0.000
Matched 4.6 5.9 0.000 6.5 8.6 0.000
Proportion
binge-drinkingb % % % %
Weighted 33 44 0.003 34 50 0.000
Matched 33 42 0.005 31 48 0.000
N 358 1079 425 1167
a
All participants aged 25 and over who drank in the last week b
Drinking more than double the recommended daily limit (i.e. >8 units in men, >6 units in women).
Table 3 Results affected by survey mode: general health and fruit and vegetable consumptiona
WOMEN MEN
Core Boost Core Boost
% % % %
Self-assessed general health
Very good 33 21 36 24
Good 45 51 44 48
Fair 14 23 14 24
Bad 6 4 5 3
Very bad 2 1 1 1
P-value 0.000 0.000
Very good/good 78 72 79 72
Fair/bad/very bad 22 28 21 28
P-value 0.000 0.000
N 833 2701 736 2181
Portions of fruit and vegetables
Less than 1 5 4 8 6
1 to 2 26 15 26 17
3 to 4 27 27 28 24
5 or more 42 55 38 54
P-value 0.000 0.000
N 833 2647 735 2133
a
results shown for weighted data
Table 4 Results differing between surveys: GHQ12 and Perceived social supporta
WOMEN MEN
Core Boost Core Boost
% % % %
GHQ12 score - grouped
Score 0 58 51 63 57
Score 1-3 27 28 24 27
Score 4+ 15 21 12 16
P-value 0.005 0.011
N 691 2628 620 2143
Perceived social support score
No lack 62 64 55 59
Some lack 25 20 24 21
Severe lack 13 16 22 20
P-value 0.036 0.223
N 701 2665 626 2133
a
results shown for matched data
Note: These questions were asked in the same mode
Table 5 Summary physical activity level for participants aged 16-64a b
WOMEN MEN
Core Boost Core Boost
Summary physical activity level % % % %
Meets recommendations 34 18 44 22
Some activity 34 39 28 35
Low activity level 32 43 28 43
P-value 0.000 0.000
Na 695 1957 620 1593
a
The analysis includes participants aged 16-64 only, since the physical activity module was not asked of all older participants in the Core survey.
b
categories. However, significant differences were found between the Boost and the Core for a number of other variables.
The Boost data showed significantly higher estimates of the number of cigarettes smoked by women and the number of alcohol units drunk by both men and women. If it is assumed that higher levels of reporting are due to respondents being more honest, then these results are consistent with other studies which have shown that self-completion questionnaires are more likely than face-to-face interviews to elicit honest responses about potentially sensitive behaviours such as levels of smoking and drinking [15-17].
Results from the fruit and vegetable consumption and physical activity question modules varied considerably between the Core and Boost surveys. These appear to be due to key differences in question format and mode of delivery. It could be that a CAPI format encourages under-reporting once it becomes clear to Core partici-pants that a positive response to an initial question leads to an extra set of follow-up questions. Moreover, both the physical activity and fruit and vegetable con-sumption modules are cognitively demanding and require much attention to detail. Both the complexity of the filtering and the unavailability of the interviewer to provide guidance are likely to have influenced the results for Boost participants and certainly led to higher levels of missing data.
Without an interviewer being present to provide gui-dance, it may be that Boost respondents over-estimate their participation in physical activities by including sports and other activities that fall outside the four week period being asked about. Similarly, their levels of fruit and vegetable consumption is likely to be higher as there is a greater temptation in the self-completion for-mat to include consumption that falls outside the one-day period covered in the questionnaire.
The complexity of the filtering for these modules meant that the self-completion format used for the Boost results in much higher levels of missing data, so that when complex variables are derived combining responses to many questions, the level of missing information is much higher for Boost than Core respondents (as there is very little missing data in a CAPI interview). Moreover, the chances to have miss-ing data increase with increasmiss-ing levels of participation or consumption. This probably explains the apparent paradox that Boost respondents were more likely to report participation in physical activities, but had a lower overall level of physical activity when combining the questions that make up that variable. By reporting more activities, the additional questions requiring an answer also increase, thereby increasing the chance of missing a question, which could result in the exclusion
of the more active individuals from the summary vari-able for the Boost respondents.
The difference in results for self-reported general health was surprising as Core and Boost participants answered identically phrased questions. However, there is evidence that the visual presentation of a question gives meaning over and above the content of the ques-tion itself [18]. Visualising the scale on paper may have influenced participants in the Boost to choose the less extreme categories. Alternatively, Core participants may have been more likely to give a socially desirable answer (i.e. very good) because of the presence of an inter-viewer. There is some evidence to suggest respondents are more likely to give positive ratings of their health when an interviewer is present, compared to a self-com-pletion mode [7]. Leading on from this, it is possible that the presence of other household members during the interview could also have an impact on the responses given.
However, further investigation of the Core sample showed no differences in the responses between those interviewed alone and those interviewed concurrently with another household member. This suggests that there are particular effects on response caused by an interviewer’s presence, rather than the presence of other household members. In addition, it may be the appear-ance of the scale on paper, versus having it read out, that results in the difference. Including the scale on a show card during an interview may therefore mitigate the difference found between modes.
Finally, the GHQ12 and social support modules were asked in identical self-completion format in both the Core and Boost surveys, yet had different results, though these were small for social support. The differences may have been caused by the context in which the question-naire was delivered. The presence of other household members was found not to affect the Core responses, however, the presence of an interviewer may have affected how Core participants answered, even though the interviewer was not directly asking the questions. The placement of these questions may also have affected the responses: the GQH12 questions were near the beginning of the Boost questionnaire, whereas the self-completion booklet was administered near the end of the Core interview, putting them in a slightly different context.
Strengths and limitations of this study
However, this study attempted to remove any differ-ences in sample composition caused by different rates of participation through the use of non-response weighting and sought to validate the findings by repeating the ana-lysis on samples matched for socio-demographic characteristics.
It is also possible that some non-response bias remained after non-response weights were applied. Some differences, such as a preference by respondents for a particular mode, cannot be measured and corrected for by weighting. It is also possible that some differences between the two samples remained after the matching process. However, the majority of estimates that were sig-nificantly different in the weighted data were also differ-ent in the matched data. This suggests that the larger differences in the survey estimates were not due to differ-ences in sample composition or differential non-response but due to differences in measurement error.
For measures where the estimates differed significantly between the two surveys, it can be difficult to determine how much of the difference was caused by data collec-tion mode and how much is due to other effects. It is also difficult to determine which estimate is nearer the ‘true’population value. The literature suggest that self-completion data should be more accurate for sensitive or ‘anti-social’ behaviours [7]. However, it is unclear which mode of data collection elicits more accurate responses for questions about self-assessed general health and GHQ12 score.
Conclusion
We have shown that data from some items collected using face-to-face interview and self-completion modes can be safely combined, for example prevalence of smoking and frequency of alcohol consumption. But we have also found differences between surveys for other items which are likely to reflect mode-specific factors, both in terms of questionnaire design and the effect of the presence or absence of an interviewer. Collection of complex data using self-completion questionnaires that attempt to parallel CAPI interview modules for topics such as fruit and vegetable consumption or levels of physical activity participation present many problems -in particular to do with the rout-ing - and is not recom-mended unless the modules are re-designed (and thor-oughly tested) to work in a self-completion format [19]. The use of a mixed mode strategy requires careful con-sideration of comparability between modes. Further experimental work with randomised assignment to mode should be carried out to investigate measurement issues in more detail. In addition, projects planning to use a mixed-mode approach should undertake thorough pre-testing of equivalence between the instruments used in each mode.
Additional material
Additional file 1: Appendix: Non-response weighting and propensity score matching. The supplementary file provides additional material about the methods used to generate non-response weights and more details on propensity score matching. This information is provided for those wishing to know more about the method or to see the detailed results of the regression for men and women to produce the weights used in the matching.
Acknowledgements
We thank the participants in the surveys, the interviewers, colleagues in the Joint Health Surveys Unit and the London Health Observatory (LHO), and the funders. This work comparing the effect of survey mode was supported by the NHS Information Centre [Project number P2795]. HSE 2006 was also funded by the NHS Information Centre, while the Boost Survey for London was funded by a pan-London consortium led by the London Health Observatory. The views expressed in this paper are those of the authors, and do not necessarily represent the views of the funding bodies, who had no part in this paper.
Author details
1National Centre for Social Research (NatCen), 35 Northampton Square,
London EC1V 0AX, UK.2Department of Epidemiology & Public Health, UCL (University College London), 1-19 Torrington Place, London WC1E 6BT, UK.
Authors’contributions
MR analyzed the data and noticed the discrepancies; JM conceived this study; BE and KP designed the analyses; JM and BE co-ordinated the study; ST, KP and SH conducted the analyses; ST, MR and JM drafted the initial manuscript. All authors contributed to interpreting the results, revising the manuscript, and read and approved the final manuscript.
Competing interests
All authors are involved in various aspects of conducting surveys as part of their employment.
Received: 30 April 2010 Accepted: 27 September 2010 Published: 27 September 2010
References
1. Scientific Institute of Public Health and National Institute for Health and Welfare:European Health Surveys Information Database (EUHSID)[http:// www.euhsid.org/], (accessed 13 December 2009).
2. NHS Information Centre:Health Survey for England[http://www.ic.nhs.uk/ statistics-and-data-collections/health-and-lifestyles-related-surveys/health-survey-for-england], (accessed 13 December 2009).
3. Roberts C:Mixing Modes of Data Collection in Surveys: A Methodological Review. NCRM review papers 008Southampton: ESRC National Centre for Research Methods 2007.
4. Powers JR, Mishra G, Young AF:Differences in mail and telephone responses to self-rated health: use of multiple imputation in correcting for response bias.Aust N Z J Public Health2005,29:149-54.
5. Groves RM:Actors and Questions in Telephone and Personal Interview Surveys.Public Opinion Q2003,67:79-125.
6. Holbrook AL, Green MC, Krosnick JA:Telephone vs. Face-to-Face Interviewing of National Probability Samples With Long Questionnaires: Comparisons of Respondent Satisficing and Social Desirability Response Bias.Public Opinion Q2003,67:79-125.
7. Bowling A:Mode of questionnaire administration can have serious effects on data quality.J Public Health2005,27:281-91.
8. Kreuter F, Presser S, Tourangeau R:Social desirability bias in CATI, IVR, and web surveys.Public Opinion Q2008,72:847-65.
9. De Leeuw ED:To mix or not to mix data collection modes in surveys.J Off Stats2005,21:233-55.
Survey for England 2006 and the Boost Survey for London.BMC Med Res Methodol10(1):83.
11. Tipping S, Hope S, Pickering K,et al:An analysis of mode effects using data from the Health Survey for England 2006 and the Boost Survey for London Leeds: NHS Information Centre 2008.
12. Craig R, Mindell J, (eds):Health Survey for England 2006London: Information Centre 2008 [http://www.ic.nhs.uk/pubs/hse06cvdandriskfactors], (accessed 19 October 2009).
13. Goldberg DP, Williams P:A User’s Guide to the GHQWindsor: NFER-Nelson 1988.
14. Leuven E, Sianesi B:PSMATCH2: Stata module to perform full
mahalanobis and propensity score matching, common support graphing and covariate imbalance testing.2003 [http://ideas.repec.org/c/boc/ bocode/s432001.html], (accessed 18 August 2010).
15. Tourangeau R, Smith TW:Asking Sensitive Questions: The Impact of Data Collection Mode, Question Format, and Question Context.Public Opinion Quarterly1996,60:275-304.
16. Schwarz N, Strack F, Hippler HJ,et al:The impact of administration mode on response effects in survey measurement.Applied Cognitive Psychol 1991,5:193-212.
17. Beebe TJ, McRae JA, Harrison PA, Davern ME, Quinlan KB:Mail surveys resulted in more reports of substance use than telephone surveys.J Clin Epidemiol2005,58:421-4.
18. Dillman DA, Christian LM:Survey mode as a source of instability in responses across surveys.Field Methods2003,15:1-22.
19. Besson H, Brage S, Jakes RW,et al:Estimating physical activity energy expenditure, sedentary time, and physical activity intensity by self-report in adults.Am J Clin Nutr2009,91:106-114.
Pre-publication history
The pre-publication history for this paper can be accessed here: http://www.biomedcentral.com/1471-2288/10/84/prepub
doi:10.1186/1471-2288-10-84
Cite this article as:Tippinget al.:The effect of mode and context on survey results: Analysis of data from the Health Survey for England 2006 and the Boost Survey for London.BMC Medical Research Methodology201010:84.
Submit your next manuscript to BioMed Central and take full advantage of:
• Convenient online submission
• Thorough peer review
• No space constraints or color figure charges
• Immediate publication on acceptance
• Inclusion in PubMed, CAS, Scopus and Google Scholar
• Research which is freely available for redistribution