R E S E A R C H A R T I C L E
Open Access
Changes in waist circumference and the
prevalence of abdominal obesity during
1994
–
2008 - cross-sectional and
longitudinal results from two surveys: the
Tromsø Study
Bjarne K. Jacobsen
*and Nils Abel Aars
Abstract
Background:Abdominal obesity increases all-cause mortality and is a risk factor for a number of diseases. There are few population-based studies of the longitudinal changes of abdominal obesity.
Methods:Based on data from the Tromsø Study, we studied gender- and age-specific mean waist circumference and prevalence of abdominal overweight and abdominal obesity in two surveys in 1994–1995 (Tromsø 4, 6812 men and women aged 25 to 84) and 2007–2008 (Tromsø 6, 12,493 men and women aged 30 to 87). Furthermore, we describe the longitudinal changes of waist circumference and abdominal obesity during 13 years in 3144 subjects (aged 25–69 in 1994) who attended both surveys.
Results:Cross-sectional analyses found a higher mean waist circumference in men than women and a direct relationship with age in both men and women in both Tromsø 4 and in Tromsø 6. As the WHO cut-off points for abdominal obesity are gender-specific, however, the prevalence of abdominal obesity was lower in men than in women. In 2007–2008, approximately 37 and 55 % of men and women, respectively, were classified as abdominally obese. Thirteen years before, in 1994–1995, the corresponding figures were 20 and 35 %. Longitudinal analyses of changes during the 13-year period clearly demonstrated that mean waist circumference increased in all examined birth cohorts in both men (mean change 6.1 cm) and women (mean change 8.4 cm), but increased more markedly the younger the subjects were. The prevalence of abdominal obesity in men aged 25–34 increased from 5 % in 1994 to 31 % 13 years later. The prevalence of abdominal obesity more than doubled among both men and women.
Conclusions:The increasing mean waist circumference is of concern. There is a need for further longitudinal studies of the changes in waist circumference.
Keywords:Waist circumference, Obesity, Abdominal, Epidemiology
* Correspondence:bjarne.jacobsen@uit.no
Department of Community Medicine, UiT–The Arctic University of Norway, Tromsø, Norway
Background
Obesity and overweight is often assessed by the body mass index (BMI), but other measures, like waist circumference, may be equally, or even more, inform-ative with regard to the associated health risks. Abdom-inal obesity, measured as waist circumference, has been found to be a significant predictor of obesity related diseases [1, 2] and all-cause mortality [3–5]. Information about the prevalence of abdominal obesity is therefore of major public health concern.
Some studies indicate that the waist circumference may have increased more than the increase in body mass index can explain [6–9]. According to US data, the mean waist circumference still increases even if mean body mass index may not increase as much anymore [10]. Visscher et al. have recently discussed the possible break in the obesity epidemic and concluded that this at least does not apply to waist circumference [11].
Cross-sectional studies have found waist circumfer-ence to increase with age [7, 12–14]. Longitudinal ana-lyses of changes in body mass index have shown that the highest weight increase takes place in the younger age groups [15–22], and similarly, some longitudinal studies [23, 24] have reported that the increase in waist circum-ference is higher the younger the people were; that there is a birth cohort effect in addition to a secular effect.
We have previously reported an increase in body mass index in all included 5-year birth cohorts in the Tromsø municipality during the 1974–1994 time span [15]. Recently, we extended the analyses to the period 1994– 2008 [22]. Data concerning waist circumference were not available, however, before 1994. In the present study, we report the cross-sectional results from 1994 (includ-ing 6812 men and women) and 2008 (includ(includ-ing 12,493 men and women) as well as changes in waist circumfer-ence between 1994 and 2008, including longitudinal changes in a subgroup of 3144 individuals.
Methods
The Tromsø Study is a large population study, based on the population of Tromsø in the north of Norway. It was conducted for the first time in 1974 (Tromsø 1) and the surveys have been repeated six times [25, 26]. The present analyses are based on the 4thand 6thTromsø surveys.
The 4th Tromsø Survey (Tromsø 4) took place in 1994–1995 and the entire population of Tromsø aged 25 or more, 37,558 men and women, was invited, and 27,158 (72 %) attended. All participants received a ques-tionnaire with the invitation. The clinical examination included measurements of height and weight. Individ-uals aged 55–74, as well as samples of 5-10 % in the remaining age groups 25–54 and 75–84 were eligible for a second visit, which included measurements of waist- and hip circumference. A total of 6902 men
and women (76 % of the eligible population) attended the second visit.
The 6th Tromsø Survey (Tromsø 6) [26] was con-ducted in 2007–2008. The 12,984 participants (out of 19,762 invited, 66 %) were invited from 4 different groups: participants from the second visit in Tromsø 4, a 10 % random sample of the age group 30–39, everyone in the age groups 40–42 and 60–87, and a 40 % random sample of people aged 43–49 years The clinical examin-ation included weight, height, waist- and hip circumfer-ence. Waist circumference was selected as the measure of abdominal obesity in the analyses. In addition, two other indices, waist-to-height ratio and waist-to-hip ra-tio, were computed.
Waist circumference was measured across the belly button wearing light clothing and recorded to the near-est cm (in Tromsø 4, to the nearnear-est 0.5 cm) by trained staff using a tape measure with the subject standing and breathing normally [26].
Abdominal overweight was defined as waist circumfer-ence 95–102 cm in men and 81–88 cm in women. Abdominal obesity was considered present if waist cir-cumference was > 102 cm in men and > 88 cm in women [5, 27]. It has been found that these cut-offs may be too low for individuals aged 70 and above, and we have therefore, in a separate set of analyses, applied 106 cm in men and 99 cm in women as cut-offs for abdominal obesity in subjects aged≥70 years as suggested by Heim et al. [28].
Information about current pregnancy was obtained by questionnaires and interview. For the present cross-sectional analyses, we selected men and non-pregnant women with valid data about waist circumference who consented to their data being included in research. A total of 6812 men and women were included in the cross-sectional analyses of waist circumference based on the Tromsø 4 survey. The corresponding figure for Tromsø 6 was 12,493 men and women.
The longitudinal analyses of the changes in waist cir-cumference included non-pregnant subjects aged 25–69 in the Tromsø 4 (1994–1995) survey with measurements of waist in both Tromsø 4 (1994–1995) and Tromsø 6 (2007–2008) surveys. Older subjects (aged 70 and above in 1994) were excluded as only 186 out of 1175 older subjects (16 %, all aged 70–74 in 1994) who attended the survey in 1994, also attended the survey 13 years later. The mean age of these 186 subjects was in 2007 84.5 years and we assume that they were particularly healthy. Thus, 3144 subjects were followed with regard to waist circumference.
(belonged to the invited cohort, had not died or moved out of Tromsø after Tromsø 4) and attended, if invited. The mean waist circumference among the 3144 men and women in Tromsø 4 with a waist circumference measurement in both Tromsø 4 and Tromsø 6 was com-pared to the waist circumference of the 2493 attenders in Tromsø 4 who lack data from Tromsø 6. In men, there was a tendency towards a lower circumference (0.7 cm age-adjusted) in subjects who attended both sur-veys (p= 0.06 after adjustment for age). In women, a 1.5 cm age-adjusted difference in the same direction was found (p< 0.001). When stratified for 10-years age group (as in Table 2), the only group with a statistically signifi-cant (p< 0.05) difference in body mass index between subjects who attended both Tromsø 4 and Tromsø 6, and those who did not, was women aged 55–64 (2 cm lower waist circumference in women who attended both surveys, p< 0.001). Our findings therefore indicate that the longitudinal cohort is quite representative with re-gard to waist circumference at baseline of the subjects with measurements of waist circumference in Tromsø 4.
The Tromsø Study was approved by the Regional Committee for Research Ethics. All participants gave written consent.
Statistical analyses
Age is given as age in years per 31.12.1994 for Tromsø 4 and per 31.12.2007 in Tromsø 6.
The age categories used in the cross-sectional analyses were 25–34 (in Tromsø 6: 30–34), 35–44, 45–54, 33–64, 65–74, 75–84 and (in Tromsø 6) 85–89 years old. In the longitudinal analyses, the age groups were (age in Tromsø 4): 25–34, 30–34, 35–44, 45–54, 55–64, 65–69.
The measurement of waist circumference is more diffi-cult to standardize than measuring height and weight [29]. In a separate set of the longitudinal analyses, a z-score analysis was conducted in order to avoid the effect of any possible systematic differences in how the mea-surements had been performed in the different surveys. Z-scores were computed for men and women separately for those with valid measurements of waist circumfer-ence in Tromsø 4 and Tromsø 6. The z-score was com-puted, separately for each survey, as measured waist circumference minus mean waist circumference, divided by the standard deviation of waist circumference. The z-scores for Tromsø 4 and Tromsø 6 according to age in Tromsø 4 were compared, enabling assessment of the changes in waist circumference in relative rather than absolute terms.
As the age-distribution in Tromsø 4 and Tromsø 6 (Table 1) differs, direct age-adjustment was performed, in-cluding the age group 35–74 (few subjects were younger or older). The age-adjusted estimates for mean waist cir-cumference and the prevalence of abdominal overweight
and obesity in Tromsø 4, given the age-distribution in the Tromsø 6 (the larger survey) were estimated.
In order to investigate in the longitudinal analyses whether the change in waist circumference was over and above that expected based on increased body mass index and age from Tromsø 4 to Tromsø 6, regression analysis was conducted. We assumed that the relationship be-tween waist circumference (the dependent variable) and BMI and age (the two independent variables) based on the Tromsø 4 data set also was valid for the same subjects 13 years later (in Tromsø 6) and computed the expected waist circumference in Tromsø 6, which was compared with the observed waist circumference.
The results from the longitudinal analysis are pre-sented according to age in the Tromsø 4 (in 1994– 1995) survey, while the results from the cross-sectional analyses are presented according to age groups in each survey.
The analyses are based on the much larger Tromsø Study database, and each project based on it has to be authorized and data cannot be shared.
All analyses were conducted using SAS version 9.4. The statistical analyses included simple descriptive ana-lyses, Chi square test, logistic regression, independent sample t-test and linear regression. A p-value of < 0.05 was considered statistically significant.
Results
The two other possible measures of abdominal obesity (waist-to-height ratio and waist-to-hip ratio) were statis-tically highly significantly correlated to waist circumfer-ence; r> 0.92 for waist-to-height ratio and r> 0.7 for waist-to-hip ratio in both men and women in Tromsø 4 and Tromsø 6.
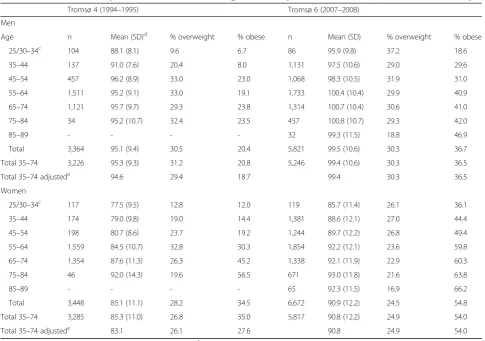
Table 1 gives the results from the cross-sectional stud-ies Tromsø 4 and Tromsø 6.
The mean waist circumference was consistently higher in men than in women, and the mean circumference and the prevalence of abdominal obesity increase with age in both men and women and in both surveys (p< 0.001). We noticed, however, a tendency toward a lower mean waist circumference in the oldest subjects, aged 85–89, in Tromsø 6. There were in both men and women statisti-cally significant relationships between age group and the distribution of the respondents according to normal waist circumference, abdominal overweight and abdominal obesity; the tendency to being classified as overweight/ obesity was positively associated with increasing age.
population classified as abdominal obese increased in men from 18.7 % in Tromsø 4 to 36.5 % in Tromsø 6. The cor-responding figures for women were 27.6 to 54.0 % (Table 1).
When we applied higher cut-offs for subjects aged 70 and above (106 cm in men and 99 cm in women), the prevalence of abdominal obesity in men was 18.6 % in the Tromsø 4 survey and 34.4 % in the Tromsø 6 survey. The corresponding figures for women were 28.4 % (Tromsø 4) and 48.0 % (Tromsø 6).
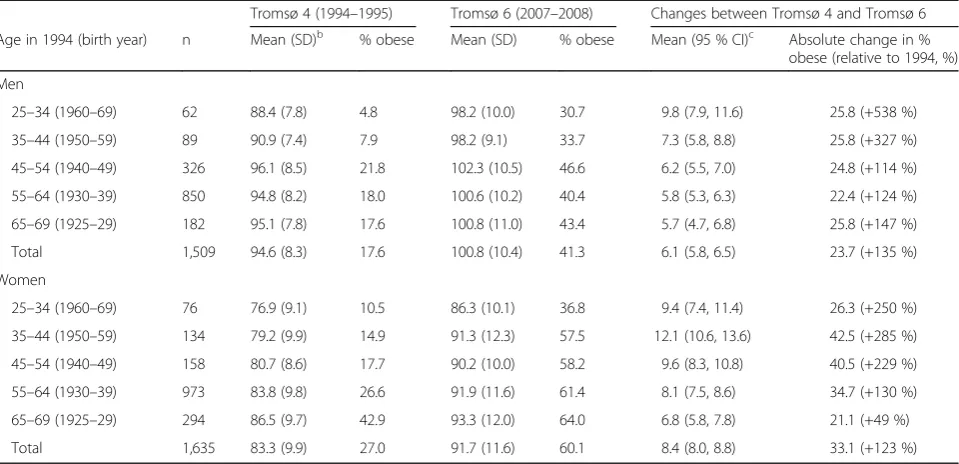
Table 2 provides the longitudinal results for men and women aged 25–69 (i.e., born 1925–1969) in the Tromsø 4 survey who took part in both the Tromsø 4 and Tromsø 6 survey. The waist circumference increased in all age groups and a statistically significant (p< 0.001) inverse relationship was found between age in Tromsø 4 and the change in waist circumference between Tromsø 4 and Tromsø 6. Analyses applying z-scores of the waist circumference ra-ther than the actual waist circumference confirmed these findings of a general inverse relationship between age and change in waist circumference during the 1994 to 2008 period (results not shown in the tables).
The longitudinal analyses further demonstrated that the proportion of the population that was classified as abdominally obese more than doubled in both men and women during 1994–2008, and there was a 6– 7 % mean annual increase in the prevalence of ab-dominal obesity. In men, there were no relationships between age in Tromsø 4 and the number of percent points the prevalence of abdominal obesity increased (e.g. 25.8 %-points in men aged 25–34 and in men aged 65–69 in Tromsø 4). In women, a linear inverse relationship was noted (p= 0.006) as the prevalence of abdominal obesity increased by 36.6 %-points in women aged 25–34 and 21.1 % in the oldest women (aged 65–69). However, in relative terms, the preva-lence increased much more in the younger age groups (e.g., more than 500 % from 4.8 to 30.7 % in men aged 25–34 in 1994) than in the older age groups (147 % from 17.6 to 43.4 % in men aged 65–69). The lowest relative increase (49 %, from 42.9 to 64.0 %) was seen in the oldest age group in women, but they also had the highest prevalence of abdominal obesity in Tromsø 4.
Table 1Waist circumference, prevalence of abdominal overweightaand obesitybin 1994–1995 and 2007–2008. The Tromsø Study
Tromsø 4 (1994–1995) Tromsø 6 (2007–2008)
Men
Age n Mean (SD)d % overweight % obese n Mean (SD) % overweight % obese
25/30–34c 104 88.1 (8.1) 9.6 6.7 86 95.9 (9.8) 37.2 18.6
35–44 137 91.0 (7.6) 20.4 8.0 1,131 97.5 (10.6) 29.0 29.6
45–54 457 96.2 (8.9) 33.0 23.0 1,068 98.3 (10.5) 31.9 31.0
55–64 1,511 95.2 (9.1) 33.0 19.1 1,733 100.4 (10.4) 29.9 40.9
65–74 1,121 95.7 (9.7) 29.3 23.8 1,314 100.7 (10.4) 30.6 41.0
75–84 34 95.2 (10.7) 32.4 23.5 457 100.8 (10.7) 29.3 42.0
85–89 - - - - 32 99.3 (11.5) 18.8 46.9
Total 3,364 95.1 (9.4) 30.5 20.4 5,821 99.5 (10.6) 30.3 36.7
Total 35–74 3,226 95.3 (9.3) 31.2 20.8 5,246 99.4 (10.6) 30.3 36.5
Total 35–74 adjustede 94.6 29.4 18.7 99.4 30.3 36.5
Women
25/30–34c 117 77.5 (9.5) 12.8 12.0 119 85.7 (11.4) 26.1 36.1
35–44 174 79.0 (9.8) 19.0 14.4 1,381 88.6 (12.1) 27.0 44.4
45–54 198 80.7 (8.6) 23.7 19.2 1,244 89.7 (12.2) 26.8 49.4
55–64 1,559 84.5 (10.7) 32.8 30.3 1,854 92.2 (12.1) 23.6 59.8
65–74 1,354 87.6 (11.3) 26.3 45.2 1,338 92.1 (11.9) 22.9 60.3
75–84 46 92.0 (14.3) 19.6 56.5 671 93.0 (11.8) 21.6 63.8
85–89 - - - - 65 92.3 (11.5) 16.9 66.2
Total 3,448 85.1 (11.1) 28.2 34.5 6,672 90.9 (12.2) 24.5 54.8
Total 35–74 3,285 85.3 (11.0) 26.8 35.0 5,817 90.8 (12.2) 24.9 54.0
Total 35–74 adjustede 83.1 26.1 27.6 90.8 24.9 54.0
a
Waist circumference 95–102 cm in men and 81–88 cm in womenb
Waist circumference > 102 cm in men and > 88 cm in women c
Age group 25–34 in Tromsø 4 (1994–1995), 30–34 in Tromsø 6 (2007–2008)d
centimeter (standard deviation) e
The correlation coefficient between waist circumfer-ence in Tromsø 4 and Tromsø 6 was 0.7 for both men and women. In men, we found that 88 % of the initially obese (waist circumference > 102 cm) (in Tromsø 4) were also obese 13 years later and only 1 % had normal waist circumference (<95 cm). In accordance with the increased mean waist circumference in the population, a significant proportion (16 %) of men initially classified as having normal waist circumference (<95 cm) were obese in Tromsø 6. In women, 91 % of the initially obese (waist circumference > 88 cm) (in Tromsø 4) were also obese 13 years later and 3 % had normal waist circumference (<81 cm). Thirty-two % of women ini-tially classified as having normal waist circumference were obese in Tromsø 6.
In both men and women, a significantly larger waist circumference was observed in Tromsø 6 than expected based on the increased body mass index and advancing age. For men, the difference between the observed and expected waist circumference was 2.1 cm (95 % CI: 1.8– 2.4 cm) and in women 5.1 cm (4.8–5.4 cm). Our data clearly indicate that most of the statistical relationship between age and change in waist circumference may be explained in statistical terms by the relationship between age and changes in body mass index.
Discussion
We find that the mean waist circumference in the Tromsø population has increased from 1994 to 2008
and that longitudinal analyses demonstrate the increase is inversely related to the age; the younger (aged 25–34) increase their waist circumference more than older people (aged 65–69) do. Thus, our results from a rela-tively large population-based study confirm some earlier longitudinal studies [23, 24]. The relationships between age and the longitudinal changes for waist circumference are similar to those found for the changes in body mass index (e.g. [15, 17, 22]) and may, according to our re-sults, to a large extent be explained by them.
As only data from two points in time, 1994–1995 and 2007–2008, are included in the analyses, we were not able to examine whether there the increase in waist cir-cumference was less marked in the last part of these 13 years, which was the case for body mass index [22]. There is, however, little evidence from other studies, that such a levering off has taken place for the mean waist circumference and central obesity [7, 10, 11, 30, 31]. There is a need for more longitudinal studies with mea-surements from several points in time.
Some cross-sectional results regarding the waist circum-ference in the Tromsø 6 survey (2007–2008) have been published [26], but not in any detail. The prevalence of ab-dominal obesity in Tromsø 6 (2007–2008) was somewhat lower than for non-Hispanic white subjects in the US [32]. The US data were based on the NHANES, and the waist circumference was measured just above the iliac crest. In men, the prevalence of abdominal obesity was somewhat higher than in another Norwegian population study, the Table 2Longitudinal changes in waist circumference, prevalence of abdominal obesityabetween 1994–1995 and 2007–2008 in 3,144 subjects. The Tromsø Study
Tromsø 4 (1994–1995) Tromsø 6 (2007–2008) Changes between Tromsø 4 and Tromsø 6
Age in 1994 (birth year) n Mean (SD)b % obese Mean (SD) % obese Mean (95 % CI)c Absolute change in % obese (relative to 1994, %)
Men
25–34 (1960–69) 62 88.4 (7.8) 4.8 98.2 (10.0) 30.7 9.8 (7.9, 11.6) 25.8 (+538 %)
35–44 (1950–59) 89 90.9 (7.4) 7.9 98.2 (9.1) 33.7 7.3 (5.8, 8.8) 25.8 (+327 %)
45–54 (1940–49) 326 96.1 (8.5) 21.8 102.3 (10.5) 46.6 6.2 (5.5, 7.0) 24.8 (+114 %)
55–64 (1930–39) 850 94.8 (8.2) 18.0 100.6 (10.2) 40.4 5.8 (5.3, 6.3) 22.4 (+124 %)
65–69 (1925–29) 182 95.1 (7.8) 17.6 100.8 (11.0) 43.4 5.7 (4.7, 6.8) 25.8 (+147 %)
Total 1,509 94.6 (8.3) 17.6 100.8 (10.4) 41.3 6.1 (5.8, 6.5) 23.7 (+135 %)
Women
25–34 (1960–69) 76 76.9 (9.1) 10.5 86.3 (10.1) 36.8 9.4 (7.4, 11.4) 26.3 (+250 %)
35–44 (1950–59) 134 79.2 (9.9) 14.9 91.3 (12.3) 57.5 12.1 (10.6, 13.6) 42.5 (+285 %)
45–54 (1940–49) 158 80.7 (8.6) 17.7 90.2 (10.0) 58.2 9.6 (8.3, 10.8) 40.5 (+229 %)
55–64 (1930–39) 973 83.8 (9.8) 26.6 91.9 (11.6) 61.4 8.1 (7.5, 8.6) 34.7 (+130 %)
65–69 (1925–29) 294 86.5 (9.7) 42.9 93.3 (12.0) 64.0 6.8 (5.8, 7.8) 21.1 (+49 %)
Total 1,635 83.3 (9.9) 27.0 91.7 (11.6) 60.1 8.4 (8.0, 8.8) 33.1 (+123 %)
a
Waist circumference > 102 cm in men and > 88 cm in women b
centimeter (standard deviation) c
HUNT study [14], which used very similar screening methods and was conducted at the same time as Tromsø 4 and Tromsø 6 (HUNT 2 in 1995–1997 and HUNT 3 in 2006–2008).
In this Tromsø population, the prevalence of obesity as assessed by general obesity (BMI) [22] and abdominal obesity (waist circumference) (the present study) differs considerably, the latter being higher. This is in accord-ance with previous studies [10, 14, 33] and may indicate that the WHO criteria for general and abdominal obesity need to be harmonized. In the analyses, we chose to concentrate on waist circumference rather than e.g., waist-to-hip ratio or waist-to-height ratio [34] as the measure of abdominal obesity. The primary reason was that both these measures of anthropometry are strongly correlated to waist circumference.
We also note that there is a strong tracking for abdom-inal obesity, as we have previously demonstrated for general obesity [35] and that the increase in waist circum-ference during 1994–2008 was for both men and women significantly larger than can be expected from the in-creases in body mass index and age. This is in accordance with findings from some previous studies [8, 9].
Strengths and limitations
Among the strengths of the present study is the rela-tively high attendance rate in the Tromsø Study (76 % in the 1994–1995 survey and 66 % in the survey conducted in 2007–2008). It is also a significant strength that all the data concerning waist circumference were based on measurements using standardized procedures. However, waist circumference is prone to measurement error [29], and to avoid the effect of any possible systematic differ-ences in how the circumference were measured at the surveys, z-scores were computed. When comparing the longitudinal results based on the actual measured waist circumference and the z-score analyses, the conclusions regarding the longitudinal changes were unchanged. This further strengthens the results from the longitu-dinal analyses of the waist circumference.
There are also limitations, however. It is well known that attenders to a health survey tend to differ from non-attenders as the latter group generally has more health problems, higher mortality and were of lower socioeco-nomic status. This has been found both in the Tromsø Study [25, 36] and in similar studies in Norway [37, 38].
Furthermore, subjects who attended both the Tromsø 4 and Tromsø 6 survey had in Tromsø 4 1.1 cm (1.2 %) lower waist circumference than subjects with information from Tromsø 4, but not from Tromsø 6. These were subjects who were not invited to the survey, chose not attend, had moved out of Tromsø or had died. This relatively minor difference in waist circumference, although statistically significant, is of particular importance for longitudinal
analyses presented in this study. We consider that it is un-likely that any major bias has been introduced, but we can-not exclude that selective attrition has had an impact on our findings, particularly in the older age groups. If men and women with high waist circumference in Tromsø 4 died or chose not to attend 13 years later, a relatively low increase in the waist circumference from Tromsø 4 to Tromsø 6 will be the result in the subjects available for the presented analyses. However, even if subjects aged 65–69 in Tromsø 4, i.e., men and women aged 78–82 in Tromsø 6, were excluded from the analyses, the inverse relationship between age in 1994 and change in waist circumference the following 13 years is convincing (Table 2).
The waist circumference may be measured in different ways (like at the level of belly button, the top of the iliac crest, or the minimal waist circumference [5]). Assessment of waist circumference is, as noted above, more difficult to standardize than e.g., measurement of height and weight [5, 29]. This has without doubt resulted in misclassifica-tion and it hampers the comparison with other studies. A further limitation in our study is the low number of sub-jects in some age groups, particularly in Tromsø 4.
Conclusions
High waist circumference has been linked to a number of chronic diseases, and the relationships has been consid-ered both strong and convincing by the World Health Organization [5], and an increase in waist circumference has detrimental metabolic consequences [39]. The rela-tionships between waist circumference and mortality may be attenuated in older subjects, though [3, 40]. Our find-ings from both cross-sectional and longitudinal analyses of an increased mean waist circumference, and particu-larly that the increase is inversely associated with age, are therefore of concern. In 2008, 37 % of the men and nearly 55 % of the women in the Tromsø population were con-sidered to have abdominal obesity. Thirteen years before, the corresponding figures were 20 and 35 %. There is a need for further longitudinal studies of the changes in waist circumference and the predictors for it.
Acknowledgements
Not applicable.
Funding
Availability of data and materials
No data available. The results presented are based on analyses of the much larger Tromsø Study database, and each project has to be authorized and data cannot be shared.
Authors’contributions
BKJ initiated the analyses. NAA and BKJ both took part in the analyses, interpretation of data and writing of the manuscript. Both authors took part in the revision of the drafted manuscript for intellectual content, and have read and approved the submitted version of the manuscript.
Competing interests
The authors declare that they have no competing interests.
Consent for publication
Not applicable.
Ethical approval and consent to participate
The Tromsø Study was approved by the Data Inspectorate of Norway and the Regional Committee of Medical and Health Research Ethics, North Norway (Reference: 2009/2536/REK nord). Informed consent was obtained from all individual participants included in the analyses.
Received: 22 March 2016 Accepted: 15 September 2016
References
1. Janssen I, Katzmarzyk PT, Ross R. Waist circumference and not body mass index explains obesity-related health risk. Am J Clin Nutr. 2004;79:379–84. 2. Janssen I, Mark AE. Separate and combined influence of body mass index
and waist circumference on arthritis and knee osteoarthritis. Int J Obes. 2006;30:1223–8.
3. Seidell JC. Waist circumference and waist/hip ratio in relation to all-cause mortality, cancer and sleep apnea. Eur J Clin Nutr. 2010;64:35–41. 4. Bigaard J, Frederiksen K, Tjønneland A, Thomsen BL, Overvad K, Heitmann
BL, et al. Waist circumference and body composition in relation to all-cause mortality in middle-aged men and women. Int J Obes. 2005;29:778–84. 5. World Health Organization. Waist circumference and waist-hip ratio. Report
of a WHO Expert Consultation. Geneva, 8–11 December 2008. Geneva: World Health Organization; 2011.
6. Freedman DS, Ford ES. Are the recent secular increases in the waist circumference of adults independent of changes in BMI? Am J Clin Nutr. 2015;101:425–31.
7. Lahti-Koski M, Harald K, Männistö S, Laatikainen T, Jousilahti P. Fifteen-year changes in body mass index and waist circumference in Finnish adults. Eur J Cardiovasc Prev Rehabil. 2007;14:398–404.
8. Walls HL, Stevenson CE, Mannan HR, Abdullah A, Reid CM, McNeil JJ, et al. Comparing trends in BMI and waist circumference. Obesity. 2011;19:216–9. 9. Elobeid MA, Desmond RA, Thomas O, Keith SW, Allison DB. Waist
circumference values are increasing beyond those expected from BMI increases. Obesity. 2007;15:2380–3.
10. Ford ES, Li C, Zhao G, Tsai J. Trends in obesity and abdominal obesity among adults in the United States from 1999–2008. Int J Obes. 2011;35: 736–43.
11. Visscher TL, Heitmann BL, Rissanen A, Lahti-Koski M, Lissner L. A break in the obesity epidemic? Explained by biases or misinterpretation of the data? Int J Obes. 2015;39:189–98.
12. Lean ME, Katsarou C, McLoone P, Morrison DS. Changes in BMI and waist circumference in Scottish adults: use of repeated cross-sectional surveys to explore multiple age groups and birth-cohorts. Int J Obes. 2013;37:800–8.
13. Shimokata H, Andres R, Coon PJ, Elahi D, Muller DC, Tobin JD. Studies in the distribution of body fat. II. Longitudinal effects of change in weight. Int J Obes. 1989;13:455–64.
14. Midthjell K, Lee CM, Langhammer A, Krokstad S, Holmen TL, Hveem K, et al. Trends in overweight and obesity over 22 years in a large adult population: the HUNT Study, Norway. Clin Obes. 2013;3:12–20.
15. Jacobsen BK, Njølstad I, Thune I, Wilsgaard T, Løchen ML, Schirmer H. Increase in weight in all birth cohorts in a general population: the Tromsø Study, 1974–1994. Arch Intern Med. 2001;161:466–72.
16. Håheim LL, Lund Larsen PG, Søgaard AJ, Holme I. Risk factors associated with body mass index increase in men at 28 years follow-up. QJM. 2006;99: 665–71.
17. Drøyvold WB, Nilsen TIL, Krüger O, Holmen TL, Krokstad S, Midthjell K, et al. Change in height, weight and body mass index: longitudinal data from the HUNT study in Norway. Int J Obes. 2006;30:935–9.
18. Juhaeri SJ, Jones DW, Arnett D. Associations of aging and birth cohort with body mass index in a biethnic cohort. Obes Res. 2003;11:426–33. 19. Caman OK, Calling S, Midlov P, Sundquist J, Sundquist K, Johansson SE.
Longitudinal age-and cohort trends in body mass index in Sweden–a 24-year follow-up study. BMC Public Health. 2013;13:893.
20. Reas DL, Nygard JF, Svensson E, Sørensen T, Sandanger I. Changes in body mass index by age, gender, and socio-economic status among a cohort of Norwegian men and women (1990–2001). BMC Public Health. 2007;7:269.
21. Pajunen P, Vartiainen E, Männistö S, Jousilahti P, Laatikainen T, Peltonen M. Intra-individual changes in body weight in population-based cohorts during four decades: the Finnish FINRISK study. Eur J Public Health. 2012;22:107–12.
22. Jacobsen BK, Aars NA. Changes in body mass index and the prevalence of obesity during 1994–2008: repeated cross-sectional surveys and longitudinal analyses. The Tromsø Study. BMJ Open. 2015;5:e007859.
23. Ebrahimi-Mameghani M, Scott JA, Der G, Lean ME, Burns CM. Changes in weight and waist circumference over 9 years in a Scottish population. Eur J Clin Nutr. 2008;62:1208–14.
24. Stevens J, Knapp RG, Keil JE, Verdugo RR. Changes in body weight and girths in black and white adults studied over a 25 year interval. Int J Obes. 1991;15:803–8.
25. Jacobsen BK, Eggen AE, Mathiesen EB, Wilsgaard T, Njølstad I. Cohort profile: the Tromsø Study. Int J Epidemiol. 2012;41:961–7.
26. Eggen AE, Mathiesen EB, Wilsgaard T, Jacobsen BK, Njølstad I. The sixth survey of the Tromsø Study (Tromsø 6) in 2007–08: collaborative research in the interface between clinical medicine and epidemiology: study objectives, design, data collection procedures, and attendance in a multipurpose population-based health survey. Scand J Public Health. 2013;41:65–80.
27. Janssen I, Katzmarzyk PT, Ross R. Body mass index, waist circumference, and health risk: evidence in support of current National Institutes of Health guidelines. Arch Intern Med. 2002;162:2074–9.
28. Heim N, Snijder MB, Heymans MW, Deeg DJ, Seidell JC, Visser M. Optimal cutoff values for high-risk waist circumference in older adults based on related health outcomes. Am J Epidemiol. 2011;174:479–89.
29. Verweij LM, Terwee CB, Proper KI, Hulshof CT, van MW. Measurement error of waist circumference: gaps in knowledge. Public Health Nutr. 2013;16:281–8.
30. Lao XQ, Ma WJ, Sobko T, Zhang YH, Xu YJ, Xu XJ, et al. Overall obesity is leveling-off while abdominal obesity continues to rise in a Chinese population experiencing rapid economic development: analysis of serial cross-sectional health survey data 2002–2010. Int J Obes. 2015;39:288–94.
31. Peeters A, Magliano DJ, Backholer K, Zimmet P, Shaw JE. Changes in the rates of weight and waist circumference gain in Australian adults over time: a longitudinal cohort study. BMJ Open. 2014;4:e003667.
32. Ford ES, Maynard LM, Li C. Trends in mean waist circumference and abdominal obesity among US adults, 1999–2012. JAMA. 2014;312:1151–3. 33. Kjær IGH, Kolle E, Hansen BH, Anderssen SA, Torstveit MK. Obesity
prevalence in Norwegian adults assessed by body mass index, waist circumference and fat mass percentage. Clin Obes. 2015;5:211–8. 34. Ashwell M, Gunn P, Gibson S. Waist-to-height ratio is a better screening tool
than waist circumference and BMI for adult cardiometabolic risk factors: systematic review and meta-analysis. Obes Rev. 2012;13:275–86. 35. Wilsgaard T, Jacobsen BK, Schirmer H, Thune I, Løchen ML, Njølstad I, et al.
Tracking of cardiovascular risk factors: the Tromsø study, 1979–1995. Am J Epidemiol. 2001;154:418–26.
36. Jacobsen BK, Thelle DS. The Tromsø heart study: responders and non-responders to a health questionnaire, do they differ? Scand J Soc Med. 1988;16:101–4.
38. Knudsen AK, Hotopf M, Skogen JC, Øverland S, Mykletun A. The health status of nonparticipants in a population-based health study: the Hordaland health study. Am J Epidemiol. 2010;172:1306–14.
39. Balkau B, Picard P, Vol S, Fezeu L, Eschwege E. Consequences of change in waist circumference on cardiometabolic risk factors over 9 years: Data from an Epidemiological Study on the Insulin Resistance Syndrome (DESIR). Diabetes Care. 2007;30:1901–3.
40. Kvamme JM, Holmen J, Wilsgaard T, Florholmen J, Midthjell K, Jacobsen BK. Body mass index and mortality in elderly men and women: the Tromsø and HUNT studies. J Epidemiol Community Health. 2012;66:611–7.
• We accept pre-submission inquiries
• Our selector tool helps you to find the most relevant journal
• We provide round the clock customer support
• Convenient online submission
• Thorough peer review
• Inclusion in PubMed and all major indexing services
• Maximum visibility for your research Submit your manuscript at
www.biomedcentral.com/submit