S Y S T E M A T I C R E V I E W
Open Access
Are interventions to reduce the impact of arsenic
contamination of groundwater on human health in
developing countries effective? A systematic review
Tracey Jones-Hughes
1*, Jaime Peters
1, Rebecca Whear
1, Chris Cooper
1, Hywel Evans
2, Michael Depledge
3and Mark Pearson
1Abstract
Background:Within developing countries, groundwater provides an alternative drinking source to polluted surface water. However, the presence of arsenic in some groundwater sources has resulted in chronic worldwide
poisoning. The aim of this review was to determine the effectiveness of field-based technologies for the removal of arsenic from groundwater in developing countries.
Methods:A structured search strategy was conducted in a range of databases. Titles, abstracts and full texts were screened using pre-defined inclusion criteria. Included studies were quality appraised prior to data extraction. The primary outcome was the percentage of effluent water samples meeting WHO guidelines for arsenic concentrations (≤0.01 mg/L). Secondary outcomes included: (a) arsenic concentrations in effluent water samples meeting the national guideline limit (≤0.05 mg/L), (b) arsenic concentrations in human tissue, and (c) knowledge and attitudes related to the interventions.
Results:Fifty-one reports, evaluating 50 different technologies, were included. Sixty-seven percent (n = 34) of studies were conducted in Bangladesh. Fifty of the included reports were appraised as‘weak’, with one‘strong’ report of a randomised-controlled trial.
In summary, the effectiveness of the oxidation and filtration interventions is poor, while the evidence for coagulation, co-precipitation and filtration, subterranean and membrane and electrolytic methods is mixed. Evidence regarding adsorption and zero valent iron interventions is more persuasive with most results suggesting good evidence of effectiveness (i.e.≥95% of samples with arsenic concentrations≤0.01 mg/L). In particular, activated alumina and sono/three-kolshi/gagri/pitcher filters have≥95% of samples meeting national guidelines. Disappointingly, only one study reports excellent evidence of effectiveness: BRAC (2000) for activated alumina (i.e.≥95% of samples with arsenic concentrations≤0.01 mg/L).
The success of each technology was highly dependent on context, especially their acceptability to users, a sense of ownership and expectations of women’s roles in society.
Conclusions:Most studies were poorly conducted and reported. Consequently, although some technologies met national guidelines, the evidence-base for decision-making regarding arsenic mitigation technologies at
household- and community-level is weak. To improve this situation, primary research needs to be commissioned with adequate sample sizes, testing the impact of key contextual factors, using valid tools for analysis, and meeting standards for completeness of reporting.
Keywords:Arsenic mitigation, Arsenicosis, Drinking water, Groundwater, Developing countries, Systematic review
* Correspondence:[email protected]
1
Peninsula Technology Assessment Group, University of Exeter Medical School, Veysey Building, Salmon Pool Lane, Exeter EX2 4SG, UK Full list of author information is available at the end of the article
Background
Arsenic is now recognised to be one of the world’s greatest environmental hazards, threatening the lives of several hundred million people [1]. Whilst it has been used by humans for thousands of years in medicines and pigments, it is the naturally occurring arsenic, existing in rocks and soils, leaching into underground water which is the concern of this review. This form of arsenic, drawn from the ground by wells and used for drinking, is one of the most toxic and carcinogenic of all the nat-ural groundwater contaminants [1].
Natural arsenic pollution occurs in diverse geological and climatic conditions. Although it occurs most com-monly in sands deposited by large rivers, arsenic contami-nated groundwater can be found in unconsolidated sediments and sedimentary, igneous and metamorphic rocks ranging from a few thousand to more than a billion years old [1]. As such, 21 countries are now recognised as experiencing arsenic groundwater contamination [2].
Of these 21 countries by far the worst pollution is found in Asia, along a particular band running from Pakistan to Taiwan, referred to as the South and Southeast Asian Belt [1]. The main drinking water in this region is extracted from shallow alluvial aquifers, which provide an alternative to polluted surface water and thereby reduce the incidence of water-borne diseases. However, arsenic is tasteless, odourless and colourless, therefore in areas such as Bangladesh and West Bengal in India, where the groundwater arsenic concentrations frequently exceed the WHO guidelines of 0.01 mg/L more than tenfold, these unacceptably high levels have gone undetected for a number of years [2-4].
Pollution of alluvial aquifers has also resulted in cases of arsenicosis in other countries in Southeast Asia including Vietnam, Nepal, Cambodia and China [5]. While there are few reported occurrences of arsenic contamination in Africa, it may be that the groundwater has simply not been tested.
The health consequences of long term exposure to ele-vated concentrations of arsenic are severe. Conditions include skin, lung, bladder and kidney cancer as well as pigmentation changes, skin thickening (hyperkeratosis), neurological and circulatory disorders, muscular weakness, loss of appetite and nausea [6]. Furthermore, because the effects of arsenic depend on cumulative exposure, the symptoms are most commonly seen in adults. As symp-toms develop, a person’s ability to live a normal life is re-duced. Sufferers may become unable to work, severely affecting the welfare of their families. The stigma of arsenic (As) poisoning also gives rise to social impacts such as os-tracism and social exclusion [1].
There are three approaches to the mitigation of ar-senic groundwater contamination: (i) removing As from groundwater, (ii) developing As-free sources, and (iii) de-veloping surface water sources. Since the intention of
this review was to evaluate interventions aimed at redu-cing the impact of arsenic contamination of groundwater, removal was the focus.
Interventions to reduce arsenic contamination of groundwater can be broadly classified according to the primary process of arsenic removal (see Table 1).
Objective of the review
Primary question
Are interventions to reduce the impact of arsenic contam-ination of groundwater on human health in developing countries effective?
The primary question was developed in consultation with AusAID and modified according to feedback received from the Collaboration for Environmental Evidence (CEE) and two external peer reviewers. However, it should be noted that this review is only part of the ‘overall picture’ of decreasing arsenic contamination of drinking water. The following factors are also likely to play an important role, but are not covered by this review:
1) Education of people who are exposed to As contaminated drinking water and subsequent behaviour change.
2) Exposure to arsenic through consumption of foodstuffs.
3) Co-ordination and monitoring of As mitigation strategies.
4) Technology choices.
5) Level of institutional support to communities and households.
Secondary question
What factors enable or constrain the effectiveness of these interventions in developing countries?
Methods
Searches
The literature search for this review was conducted in two stages:
1) A search of databases; and,
2) Citation chasing, pearl-growing and web-searching.
Search terms and languages
conducted in the English language. Please see Additional file 1 for further details.
In resources with no controlled syntax, or where the specificity of the search was lost given the broad remit of some of the search resources (i.e. Web of Science), we used a population filter to increase the specificity of search returns to developing countries. This filter named not only countries but also populations, and included a cross-check of developing countries, or third world ter-minology (i.e. under-developed), to maintain sensitivity. The list of named countries was developed from the funder’s list of includable countries (www.ausaid.gov.au/ ngos/Pages/devel_list.aspx) –which was, in turn, cross-checked with the International Human Development Indicators (http://hdr.undp.org/en/statistics/). The IMF list of developing countries was also consulted. This filter was extensively tested in scoping against known includable studies.
All searching was limited as follows:
Date
1980-current (the period in which arsenic contamination of groundwater became widely recognised and interventions
to address the problem were introduced) (Ravenscroft et al., 2009).
Language
Searches were limited to the English language, as early scoping searches indicated that this is the language of publication for scientific studies in countries where ar-senic contamination of groundwater is an issue.
A full record of the search approach and searches as run is included in Additional file 1.
Databases
The following databases were searched:
Assia via CSA
Aqualine via ProQuest
Biosis via ISI (Thompson Reuters) CAB Abstracts via Ebsco HOST Compendex via Engineering Village The Cochrane Library viahttp://www.
thecochranelibrary.com
Embase via OVID ERIC via CSA
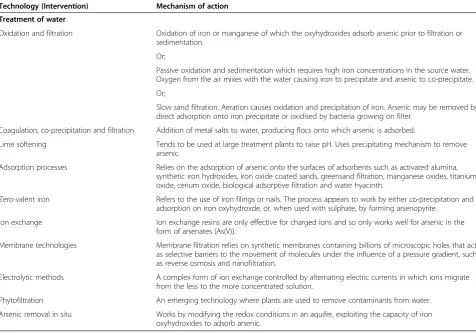
Table 1 Processes to remove arsenic from groundwater (adapted from Ravenscroft et al., 2009)
Technology (Intervention) Mechanism of action Treatment of water
Oxidation and filtration Oxidation of iron or manganese of which the oxyhydroxides adsorb arsenic prior to filtration or sedimentation.
Or;
Passive oxidation and sedimentation which requires high iron concentrations in the source water. Oxygen from the air mixes with the water causing iron to precipitate and arsenic to co-precipitate.
Or;
Slow sand filtration. Aeration causes oxidation and precipitation of iron. Arsenic may be removed by direct adsorption onto iron precipitate or oxidised by bacteria growing on filter.
Coagulation, co-precipitation and filtration Addition of metal salts to water, producing flocs onto which arsenic is adsorbed.
Lime softening Tends to be used at large treatment plants to raise pH. Uses precipitating mechanism to remove arsenic.
Adsorption processes Relies on the adsorption of arsenic onto the surfaces of adsorbents such as activated alumina, synthetic iron hydroxides, iron oxide coated sands, greensand filtration, manganese oxides, titanium oxide, cerium oxide, biological adsorptive filtration and water hyacinth.
Zero-valent iron Refers to the use of iron filings or nails. The process appears to work by either co-precipitation and adsorption on iron oxyhydroxde, or, when used with sulphate, by forming arsenopyrite.
Ion exchange Ion exchange resins are only effective for charged ions and so only works well for arsenic in the form of arsenates (As(V)).
Membrane technologies Membrane filtration relies on synthetic membranes containing billions of microscopic holes that act as selective barriers to the movement of molecules under the influence of a pressure gradient, such as reverse osmosis and nanofiltration.
Electrolytic methods A complex form of ion exchange controlled by alternating electric currents in which ions migrate from the less to the more concentrated solution.
Phytofiltration An emerging technology where plants are used to remove contaminants from water.
GreenFILE via EbscoHost
HMIC via OVID
IBSS via CSA
Inspec via ISI (Thompson Reuters)
Lilacs viahttp://regional.bvsalud.org/php/index.php? lang=en
Medline via OVID
Medline in Process via OVID NTIS via Enginering Village Pollution Abstracts via ProQuest PsycINFO via OVID
Scopus via Scopus
Sociological Abstracts via CSA
Web of Science (CPCO-S/CPCO-SSH, SSCI) via ISI (Thompson Reuters)
World Wide Political Science Abstracts (WPSA) via CSA
Searches for grey literature: contacts, internet searches, use of specific search terms or strings, filtering or limitations
The following web-resources, web-sites and organisations of note were searched, alongside conference abstracts (as above), library catalogues and Google, for grey, or difficult to locate, literature [8,9].
Web-resources
BL (British library) Direct and British Library Catalogue
British Library for Development Studies (BDLS) Directory of Open Access Journals
ELDIS
Evidence-Based Policy in Development Network (EBPDN)
Global Development Network (GDN)
Index to Theses
JOLIS
RAPID (Research and Policy in Development) R4D Database
The World Bank
WHOLIS (World Health Organisation) WHO Regional Databases
Organisations of note
African Development Bank
African Medical and Research Foundation Asian Development Bank
Australian Aid Agency British Geographical Survey
Canadian International Development Agency Centers for Disease Control and Prevention
Christian Aid
Danish Development Agency
Department for International Development European Commission
Fresh Water Action Network GTZ (GIZ) Deutsche
Inter-American Development Bank International Rescue Committee
International Water Management Institute
IRC (International Rescue Committee) International Japan Bank for International Cooperation
Japan International Cooperation Agency Organisations of the United Nations (UNICEF,
UNEP, UNDP, UN-HABITAT, UNRISD, FAO)
Oxfam
Overseas Development Agency Pan American Health Organisation Red Cross
Swedish Development Agency
US Agency for International Development Water and Sanitation Centre
WaterAid
World Bank (Office of Evaluation and Development) World Health Organisation
Citation chasing
Citation chasing was conducted on items included after full-text screening. Backwards citation chasing was conducted manually through reference scanning of bibli-ographies. Forwards citation chasing was conducted in Web of Knowledge (ISI Thompson Reuters).
The results from the citation chase were aggregated and de-duplicated against each other and the main re-view libraries (which contains the items from the main search and which have already been screened). This gave an additional 143 references to be screened. The results from the forwards citation chasing can be found in Additional file 1.
Study inclusion criteria
In order to be included, the study had to fulfil the fol-lowing criteria:
Population (or‘subject’)
The outcomes of interest involve both groundwater and people, therefore the subjects are either people living in, or groundwater sources in, developing countries (as de-fined by AusAID; see Additional file 2).
Intervention
A study of any technology (see Table 1) designed to remove or lower arsenic concentration in water intended for human consumption and tested in the community/household (field setting). This does NOT include national or local policy or specific educational interventions.
Comparators
Studies had to include a form of comparison e.g. pre/ post comparison of filtered and unfiltered water, com-parison with another technology intended to remove or lower arsenic concentration in groundwater, or compari-son with no intervention.
Outcomes
All outcomes must be measured in field based studies and include either:
1) Arsenic concentration in groundwater intended for human consumption.
2) Arsenic concentration in human tissue or body fluids.
3) Observation of people’s behaviour relating to technologies intended to remove or lower arsenic concentration in groundwater intended for human consumption.
4) People’s knowledge or attitudes relating to technologies intended to remove or lower arsenic concentration in groundwater intended for human consumption.
Since this review was concerned with the viability of interventions during ‘real-life’ scenarios, a distinction was made to include only field tests which involved members of the community, as opposed to being oper-ated solely by researchers.
Study design
Only comparative study designs were included (includ-ing, but not limited to, randomised controlled trials, be-fore and after studies, and cross-sectional studies).
Exclusion criteria
Any studies which looked at the following topics were excluded from this review:
Reduction of As contamination of rice by alternative methods of cooking, water management and irrigation. Reduction of As contamination in soil.
Reduction of As in water by ferns grown in a hydroponic system, as opposed to field study. Nutritional supplements/intervention to minimise
impact of As.
Methods of As detection.
Hydrogeological studies investigating actions which mobilise As.
Interventions such as dugwells, pond sand filters, rain water harvesting mechanisms, well-switching and GIS modelling were also excluded from the review since they do not reduce or remove arsenic from groundwater.
Study quality assessment
The studies included at full text were assessed using the McMaster University Effective Public Health Practice Project quality appraisal tool (www.ephpp.ca/tools.html; see Additional file 3). This tool is suitable for use across a wide range of quantitative study designs and has expli-cit criteria for rating selection bias, study design, con-founders, blinding, data collection methods, withdrawal, intervention integrity and analyses as ‘strong’,‘moderate’,
or ‘weak’. Study quality appraisal was conducted by one
of three reviewers, with a random sample of 25% checked by a second reviewer. Disagreements were resolved by discussion, with the involvement of a third reviewer if necessary.
Data extraction strategy
Data was extracted from included studies by one of three reviewers using a modified version of a data extraction form designed for use with complex public health studies [10]. Extracted data followed the outcomes described above and included details of the population, type of intervention, and context in which implemented – see Additional file 4. A random sample of 10% of the com-pleted data extraction forms were checked by a second re-viewer. Discrepancies were resolved by discussion, with the involvement of a third reviewer if necessary.
Data synthesis and presentation
All measures of arsenic concentration in groundwater are reported as mg/L in this review. All measures of arsenic concentration in human tissue are reported as
Primary outcomes
The primary outcome is the percentage of effluent water samples, i.e., water samples treated by the intervention, with arsenic concentrations below WHO guidelines (≤0.01 mg/L) [4]. The WHO guidelines are based on‘safe/ acceptable’levels of exposure for humans, therefore those interventions meeting WHO guidelines are providing safe water for populations. Where data were available, exact 95% confidence intervals (CIs) for the percentage of sam-ples meeting WHO guidelines were calculated using the binomial distribution [11]. The 95% CIs provide a measure of the uncertainty associated with the proportion of sam-ples meeting WHO guidelines. This reflects the number of samples measured in the individual studies.
The results are presented by intervention, with inter-ventions categorised into groupings depending on the primary processes involved.
Secondary outcomes
There are three secondary outcomes: (a) the proportion (and 95% CIs) of effluent water samples with arsenic concentrations below the guideline limit for the country in which the study was conducted (e.g. < 0.05 mg/L in Bangladesh), (b) arsenic concentrations measured in hu-man tissue, and (c) aspects related to acceptance of the interventions.
The primary focus of this review was to establish the effectiveness of interventions to remove arsenic from groundwater. However, the qualitative information also identified in the articles was considered important in providing a context for the effectiveness results and was therefore compiled as a summary.
Overall summary of effectiveness
To aid summarising the effectiveness of the interven-tions, we define four categories based on the strength of evidence (Table 2).
Arsenic concentrations measured in human tissue are also presented, where such outcomes are measured and reported in the individual studies.
Variations of effectiveness
The design and setting of the technology and the charac-teristics of the influent water are likely to have a signifi-cant impact on the effectiveness of arsenic reduction or removal. These characteristics include [1]:
1) Arsenic and iron concentrations in the raw groundwater. 2) Cleaning, maintenance and cost of the technology. 3) Volume of treated water required (water demand).
Thus, where reported in the individual studies, we have presented and discussed evidence on variation in arsenic removal effectiveness due to these factors. Details on maintenance and flow rate (in terms of L/hr), whether from manufacturer guidance or from evaluation are presented. Costs associated with the technology are reported by the currency and year of the individual study. However, to allow comparison of costs across technolo-gies, all costs have also been converted to Aus$ for the year 2011 using Shemilt (2010) [12].
Synthesis
Formal synthesis of quantitative outcomes across stud-ies, i.e. meta-analysis, was not undertaken due to poor study quality, poor reporting quality and issues of het-erogeneity between studies.
The main inhibitor of meta-analysis for this review was heterogeneity in the design and conduct of studies, such as differences in the intervention being assessed and the unit of analysis (samples from different sites, repeat samples from just one site, repeat samples from a number of sites, etc.). The poor quality of study conduct also influenced our decision, as potential biases may be masked in a meta-analysis. In terms of reporting quality, the outcome data required for synthesis could not be extracted for some studies, therefore this information would be lacking from the synthesis.
Overall, conducting a meta-analysis across these stud-ies would have produced results which would have been difficult, if not impossible, to interpret. As many inform-ative texts state, meta-analysis of study results, when studies are diverse or of poor quality, may be meaning-less, with any real differences concealed [13-16].
Results
Included studies
The databases were searched from 1980 to August 2011 and forward citation chasing was completed by November 2011. The searches identified 11 457 potentially relevant articles (after de-duplication). Screening by title and abstract revealed a large proportion of the studies were laboratory based and therefore excluded. Three hundred and twenty one papers were requested for examination of full text, of which 44 were included in the review. A Table 2 Strength of effectiveness evidence
Effectiveness evidence
Definition
Excellent ≥95% of effluent water samples have arsenic concentrations below WHO guidelines
Good ≥95% of effluent water samples have arsenic concentrations below national guidelines*
Poor <95% of effluent water samples have arsenic concentrations below national guidelines*
Inconclusive Unable to comment on effectiveness evidence due to poor reporting of results
further seven articles were identified for inclusion via web searching and forward chasing of bibliographies (Figure 1).
Included study characteristics
Additional file 5 provides a summary of each study detailing the country in which the study was con-ducted, the size and design of the study, the inter-ventions and outcomes assessed, and an overview of study quality. Details on interventions such as house-hold/community, costs and flow rates are in Tables 3, 4, 5, 6, 7 and 8. Further description of study quality is given in 'Included study characteristics' and Additional file 6. Fifty of the fifty-one included studies were appraised as ‘weak’ using the EPHPP quality appraisal tool, with only one study (a RCT; Milton et al. (2007)) appraised as ‘strong’ [17]. Whilst we recognise the difficulties for decision-makers of using a synthesis of methodologically-weaker studies, we did not exclude studies on the basis of quality as:
The comparators in the RCT were limited to one includable technology (compared with no intervention);
From using the EPHPP quality appraisal tool, we were aware that despite it being designed for use with public health rather than clinical studies, non-randomised studies were still likely to receive a
‘weak’rating’; and
Non-randomised study designs (such as before/after) were likely to be more appropriate for assessing the effectiveness of interventions to reduce arsenic contamination in water, as this study design:
○allows the direct comparison of water samples before and after the intervention.
○makes it less likely that confounding of the comparison by location, season and/or the characteristics of different water sources (such as the chemical composition of water samples) will occur.
A key for the ‘Outcomes’ and ‘Quality’ headings in
Additional file 5 is provided below. A key for the study design elements of Additional file 5 can be found in Additional file 6, but in particular, under the ‘Study de-sign’ heading in Additional file 5, a straight single line indicates that a survey of one group of participants was undertaken (i.e. as in Akman & Higano, (2002)) [18]. Two parallel straight lines indicates that a survey of two different groups of participants was undertaken (i.e. Ahmad et al. (2005) and Ahmad et al. (2006)) [19,20]. A before/after study is indicated by the elongated S-shaped line as in Ashraf Ali et al. (2001) [21]. A randomised control trial design is denoted by a straight line that splits into two as for Milton et al. (2007) in Additional file 5 [17]. The width of the lines indicate the relative number of samples collected and analysed in each study, along with the blocks under the‘No. samples’heading.
Note that in Figure 2 (the key for Additional file 5) there is no marker for moderate overall quality, since all studies were considered to be of weak or strong quality. The validity and reliability items in Additional file 5 cor-respond to appraisal of data collection methods from the EPHPP quality appraisal tool (Additional file 7).
Titles & abstracts identified: n=27554
Unique items to screen n=11457
Included n=51 Duplicates removed n=16097
Screening
Not a relevant study design or does not involve a field study: 162
Full-text screening n=321 No relevant intervention: 37
No relevant outcome: 4 No relevant population: 16
Not in English: 2
Unobtainable or insufficient detail: 46
Duplicate: 10
Web-searching n= 69
Citation chasing n=143
For validity:“Were data collection tools shown to be valid?”
For reliability:“Were data collection tools shown to be reliable?”
These two items are shown in Additional file 5 as they were deemed to be important for appraising study quality
in the context of interventions to remove or reduce ar-senic in groundwater.
The majority of studies (n = 34, 67%) are based in Bangladesh, with the remaining set in India (n = 10, 20%), Nepal (n = 3, 6%), Vietnam (n = 2, 4%), Cambodia (n = 1, 2%) and China (n = 1, 2%). Forty-four studies (86%) report an evaluation of the effectiveness of interventions (as
Table 4 Summary of costs and flow rates for coagulation, co-precipitation and filtration technologies
Author Intervention Household or community
Flow L/hr Capital cost as Aus$
Operational cost as Aus$
BAMWSP (2001), Sutherland (2001), Sutherland (2002)
DPHE/Danida two bucket system
Household 4.3 (max 43–52 L in 12 hrs) Not reported Not reported
Hoque (2000) Alum treatment of contaminated water
Unclear Not reported Not reported Not reported
BAMWSP (2001), Sutherland (2001), Sutherland (2002)
Stevens Institute technology
Unclear 18 (max 211 L in 12 hrs) Not reported Not reported
Meng (2001) Household co-precipitation and filtration system
Household 90 (reduced to 24 after 10 buckets) (1.5 L/min)
Not reported 8/year/family
Amiri (2010) STAR Unclear 16 L–mixed and stand
10–15 min
Not reported Not reported
Amiri (2010) CIWPL Unclear 20 L water–stirred for 2 mins and stand for 1 hour.
Not reported Not reported
Norton (2009) Procter & Gamble flocculant-disinfectant powder
Household 10 L/sachet. Stir 5 min and settle 5 min
Not reported Not reported
Cheng (2004) Household arsenic removal system
Household 30-120 (0.5-2.0 L/min) Not reported Not reported
Ali (2001) Ferric chloride coagulation Household 60-120 (1–2 L/min) 80 Chemicals−0.20
Hossain (2005) Chlorinating agent (BP) + ferric alum
Community 1000 1512 periodic chemical
charges (assume 2002– study 2001–2003)
Not reported
Table 3 Summary of costs and flow rates for oxidation and filtration technologies
Author Intervention Household or community
Flow L/hr Capital cost as Aus$
Operational cost as Aus$
Amin (2010) MGH Household 1.2 60-80 0.6-0.8
Berg (2006) Tobias (2011)
Sand filter Household ~60 (1 L/min) 9.93 Not reported
Brennan (2011) SPACE AIRPs Community 150-200 L/day Not reported Not reported
Al-Muyeed (2006) AIRPs Community Not reported 200-600 5-150
Sutherland (2002), BAMWSP, Rahman (2005)
GARNET Unclear 1.2 (max 14 L over 12 hrs) Not reported Not reported
BAMSWP Ardasha filter Unclear 1.1 Not reported Not reported
BAMSWP Passive sedimentation Unclear Not reported N/A Not reported
Bhattacharyya (2004) Domestic clay candle filter Household Not reported Not reported Not reported
Hassan (2009) Iron oxidising bacteria Community ~140 L/day anticipated Not reported Not reported
Sharma (2004) Hassan (2008)
A/IRU Community Not reported Not reported Not reported
Shafiquzzaman (2011) Iron removal ceramic filter Household 2.5-5.5 Not reported Filter−18
Table 5 Summary of costs and flow rates for adsorption processes
Author Intervention Household or community
Flow L/hr Capital cost as Aus$ Operational cost as Aus$
Hossain (2005) Activated alumina As-37 Community 600 2042 + 622 per charge + 4% sales tax
Not reported
Hossain (2005) Aquabind–activated alumina with metal oxide
Community 42 (1000 L/day) 3456 + 649 per charge Not reported
Hossain (2005) Red haematite lumps + quartz + sand + activated alumina
Community 600-1000 1271 as per 1997 estimate Not reported
Hossain (2005) Activated alumina + AAFS-50, patented aluminium silicate + ferric hydroxide
Community 22 (200000 L/year) 2080 + 942 per media charge
Not reported
Hossain (2005) Aluminium silicate + ferric hydroxide
Community 83 (2000 L/day) 376 + 56 per recharge Not reported
Hossain (2005) Adsorp-As (patented) Community 102 (900000L/year) 3484 + 1177per charge Not reported
Hossain (2005) Slurry/granular ferric hydroxide
Community 600-900 1695 + 399per recharge maintenance of 56 per year
Not reported
Hossain (2006) Samples 305 ARPs– based on typical ARP with granular ferric oxide
Community Not reported Not reported Not reported
BAMWSP (2001), Sutherland (2001), Sutherland (2002)
BUET activated alumina filter
Household Not reported 1400 1000
Amiri (2010), Sutherland (2002), BCSIR (2003)
ALCAN Community 244 - >300 (max 2928 L over 12 hrs)(5 L/min)
167 Not reported
Amiri (2010) Apyron Unclear 600 (<10 L/min) Not reported Not reported
Amiri (2010) Wholly Water. Unclear 240 (≤4 L/min) Not reported Not reported
Amiri (2010) Nelima Unclear 20 L–stir 3 or 4 times (may need 1.5-2 hours if over 3 mg/L iron
Not reported Not reported
Amiri (2010) Shapla Unclear 5.5 Not reported Not reported
Anstiss (2001) Tank system with ferric oxide
Household 2.5 (60 L/day) - flexible regarding water volumes and cycle length
Not reported Not reported
Jakariya (2005), Rahman (2005), BRAC (2000)
Safi filter Household 40 L/day 1.7 Not reported Family filter–70 New candle–$20
Misra (2005) As removal filter Household 15 Not reported Not reported
Sarkar (2005) Well head treatment unit using activated alumina adsorption column
Community 480-600 Not reported Not reported
Sarkar (2008), BRAC (2000)
Activated alumina Community 720-900 (12–15 L/min) Not reported Not reported
Ali (2001) Iron oxide coated sand Household 60-120 Not reported Not reported
Yuan (2002) Iron oxide coated sand Household Estimate of 15 L/day 52 Not reported
Petrusevski (2008) UNESCO-IHE family filter Household 0.15-0.77 Not reported Not reported
BRAC BCSIR SIDKO Community 60* (1l/min) 7200 Media−290
Ashraf (2001) Gravel bed with iron sludge Unclear Not reported Not reported Not reported
indicated in column 3 of Additional file 5, under the “Out-come/Effectiveness” heading). Across these effectiveness studies there is great variation in the number of water samples measured, ranging from two samples reported in Oh et al. (2000) to 1074 samples reported in Ngai et al. (2006) [22,23]. In addition, there are differences in the sample units across studies. For example, some studies report repeated samples over a period of days at one site [24], while other studies report on repeated samples at a number of wells at a number of sites [25]. For eight stu-dies it is unclear whether a reported value is a single measurement or an average of an unknown number of measurements.
Six studies (12%) report on the effectiveness of inter-ventions and provide detail on behavioural aspects re-lated to the use of these interventions. A further seven studies (14%) provide evidence on behavioural aspects only. Studies assessing behavioural aspects generally have a large number of participants, e.g. Ahmad et al. (2006) reports on a study of 2700 households and Jakariya et al. (2007) who surveyed 2600 families [20,26].
Of the 44 studies reporting on the effectiveness of interventions, all but one of these are before and after studies where influent and effluent water samples are analysed and compared for their arsenic content. The remaining study is a randomised control trial, where households are randomised to receive the intervention or to receive no intervention.
The most common design for the studies reporting on behavioural aspects of arsenic removal/reduction inter-ventions is that of a survey where users of different interventions are surveyed at a particular time-point.
Across the 51 included studies, 50 different interven-tions are described. The wide range of technologies appears to be due to attempts to meet the varying needs of villagers in terms of availability of resources, cost, main-tenance, and ease of use. In order to appraise the effective-ness of the interventions, they were classified into eight groups based on the primary process involved in the inter-vention as described by Ravenscroft et al. (2009) [1]:
Oxidation and filtration
Coagulation, co-precipitation and filtration Adsorption
Ion exchange Zero valent iron Arsenic removal in situ
Membrane
Electrolytic
For example, the 3-kolshi filter, as evaluated in BRAC (2000), is defined as a zero valent iron intervention since this employs the solid elemental form of iron as filings or nails [27]. Details of the groups, the specific interventions and the primary processes involved are given in Table 9.
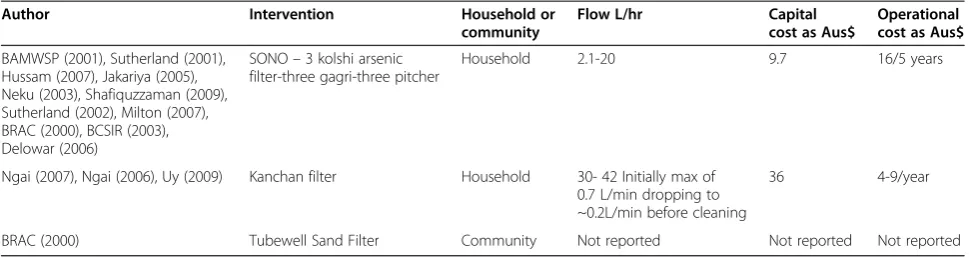
Table 6 Summary of costs and flow rates for zero valent iron technologies
Author Intervention Household or community
Flow L/hr Capital cost as Aus$
Operational cost as Aus$
BAMWSP (2001), Sutherland (2001), Hussam (2007), Jakariya (2005), Neku (2003), Shafiquzzaman (2009), Sutherland (2002), Milton (2007), BRAC (2000), BCSIR (2003), Delowar (2006)
SONO–3 kolshi arsenic filter-three gagri-three pitcher
Household 2.1-20 9.7 16/5 years
Ngai (2007), Ngai (2006), Uy (2009) Kanchan filter Household 30- 42 Initially max of 0.7 L/min dropping to ~0.2L/min before cleaning
36 4-9/year
BRAC (2000) Tubewell Sand Filter Community Not reported Not reported Not reported
Table 7 Summary of costs and flow rates for ion exchange technologies
Author Intervention Household or community
Flow L/hr Capital cost as Aus$ Operational cost as Aus$
Hossain (2005) AFDWS-2000 (patent pending) Community Up to 10000L 3242 Not reported
Hossain (2005) Ferric hydroxide Community 600 1686 Not reported
Hossain (2005) Bucket of resins (patented) Community 300000L 3986 + 1686per recharge +4% sales tax
Not reported
BAMWSP (2001), Sutherland (2001), Sutherland (2002), BCSIR (2003)
Tetrahedron/Tetratreat Unclear 60-120 (720 over 12 hours)
1300 Not reported
A summary of all interventions evaluated by each study can be found in Additional file 5 under the‘Technologies’ heading. A breakdown of the number of studies and inter-ventions included in the review is given in Figure 3, with interventions classified into the eight groupings. There are more interventions in the adsorption grouping because a number of studies have assessed a greater number of adsorption interventions than other types, in particular Amiri et al. (2010), BCSIR (2003) and BRAC (2000) (see Additional file 5) [27-29]. On the other hand, for zero valent iron technologies many studies have assessed the same type of intervention: the sono, three-pitcher/kolshi/gagri filter.
The final column of Additional file 5 details the funding source for each study. For 36 of the studies (71%), the funding source could not be determined from the article and a further study reported no funding for their research.
Study quality assessment
The overall quality of the studies was poor, with all but one ranked as weak (Additional file 5). The one RCT was appraised as strong [17]. Fifteen studies were at least
somewhat likely to have a representative population but in almost as many studies it was not possible to tell from the information available. Eighteen out of 23 relevant studies did not have enough information to be able to say what percentage of the sample population agreed to participate and most studies did not detail how the sam-ple size was determined. Of the four that did, they were convenience samples.
Eleven studies reported that the outcome assessor was blinded to the status of the water samples. Sixteen studies used valid measures (though not all were considered reliable), four studies reported using invalid and unreliable measures and the remaining 19 studies did not report this information about the measures that were used. Only four studies reported a drop out rate. For the remaining studies, this information was not described or was not applicable. Twelve studies do report the percentage of participants
completing the study with nine studies reporting more than 80% of participants completing, however, in 11 studies this information could not be ascertained.
Fifteen studies report over 80% of participants received the intervention allocation of interest but in the remaining appropriate studies this information was not present.
Sixteen studies reported some information about the consistency with which the intervention was delivered/used but in ten studies this was not reported and in a further nine studies is was not possible to tell.
In eight studies it was believed that the participants were likely to have received another unintended intervention and in 14 studies the likelihood was unclear.
At least 18 studies reported the unit of analyses to match the unit of allocation within the study. In only two studies were the statistical analyses
believed to be inappropriate for the results of the study [30,31].
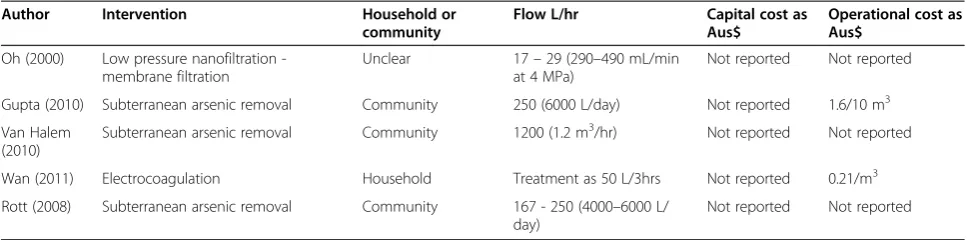
Table 8 Summary of costs and flow rates for in situ arsenic removal, nanofiltration and electrocoagulation
Author Intervention Household or community
Flow L/hr Capital cost as Aus$
Operational cost as Aus$
Oh (2000) Low pressure nanofiltration -membrane filtration
Unclear 17–29 (290–490 mL/min at 4 MPa)
Not reported Not reported
Gupta (2010) Subterranean arsenic removal Community 250 (6000 L/day) Not reported 1.6/10 m3
Van Halem (2010)
Subterranean arsenic removal Community 1200 (1.2 m3/hr) Not reported Not reported
Wan (2011) Electrocoagulation Household Treatment as 50 L/3hrs Not reported 0.21/m3
Rott (2008) Subterranean arsenic removal Community 167 - 250 (4000–6000 L/ day)
Not reported Not reported
Key
Outcome:
Not reported
Reported
Quality:
Not valid/reliable
Valid/reliable
Unclear
Overall:
Weak
Strong
Figure 2Key to the outcome and quality headings in
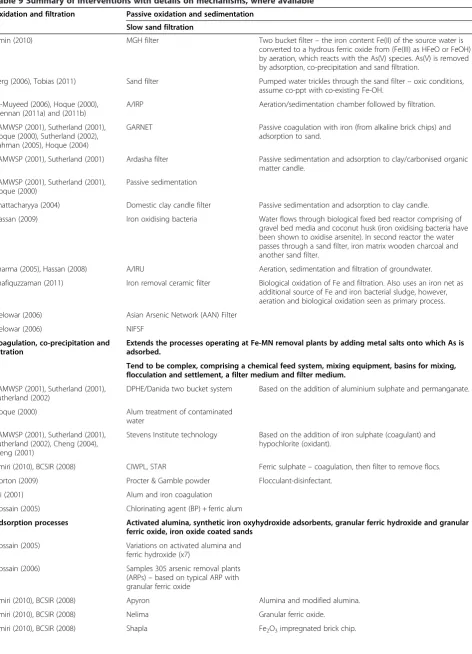
Table 9 Summary of interventions with details on mechanisms, where available
Oxidation and filtration Passive oxidation and sedimentation Slow sand filtration
Amin (2010) MGH filter Two bucket filter–the iron content Fe(II) of the source water is converted to a hydrous ferric oxide from (Fe(III) as HFeO or FeOH) by aeration, which reacts with the As(V) species. As(V) is removed by adsorption, co-precipitation and sand filtration.
Berg (2006), Tobias (2011) Sand filter Pumped water trickles through the sand filter–oxic conditions, assume co-ppt with co-existing Fe-OH.
Al-Muyeed (2006), Hoque (2000), Brennan (2011a) and (2011b)
A/IRP Aeration/sedimentation chamber followed by filtration.
BAMWSP (2001), Sutherland (2001), Hoque (2000), Sutherland (2002), Rahman (2005), Hoque (2004)
GARNET Passive coagulation with iron (from alkaline brick chips) and adsorption to sand.
BAMWSP (2001), Sutherland (2001) Ardasha filter Passive sedimentation and adsorption to clay/carbonised organic matter candle.
BAMWSP (2001), Sutherland (2001), Hoque (2000)
Passive sedimentation
Bhattacharyya (2004) Domestic clay candle filter Passive sedimentation and adsorption to clay candle.
Hassan (2009) Iron oxidising bacteria Water flows through biological fixed bed reactor comprising of gravel bed media and coconut husk (iron oxidising bacteria have been shown to oxidise arsenite). In second reactor the water passes through a sand filter, iron matrix wooden charcoal and another sand filter.
Sharma (2005), Hassan (2008) A/IRU Aeration, sedimentation and filtration of groundwater.
Shafiquzzaman (2011) Iron removal ceramic filter Biological oxidation of Fe and filtration. Also uses an iron net as additional source of Fe and iron bacterial sludge, however, aeration and biological oxidation seen as primary process.
Delowar (2006) Asian Arsenic Network (AAN) Filter
Delowar (2006) NIFSF
Coagulation, co-precipitation and filtration
Extends the processes operating at Fe-MN removal plants by adding metal salts onto which As is adsorbed.
Tend to be complex, comprising a chemical feed system, mixing equipment, basins for mixing, flocculation and settlement, a filter medium and filter medium.
BAMWSP (2001), Sutherland (2001), Sutherland (2002)
DPHE/Danida two bucket system Based on the addition of aluminium sulphate and permanganate.
Hoque (2000) Alum treatment of contaminated water
BAMWSP (2001), Sutherland (2001), Sutherland (2002), Cheng (2004), Meng (2001)
Stevens Institute technology Based on the addition of iron sulphate (coagulant) and hypochlorite (oxidant).
Amiri (2010), BCSIR (2008) CIWPL, STAR Ferric sulphate–coagulation, then filter to remove flocs.
Norton (2009) Procter & Gamble powder Flocculant-disinfectant.
Ali (2001) Alum and iron coagulation
Hossain (2005) Chlorinating agent (BP) + ferric alum
Adsorption processes Activated alumina, synthetic iron oxyhydroxide adsorbents, granular ferric hydroxide and granular ferric oxide, iron oxide coated sands
Hossain (2005) Variations on activated alumina and ferric hydroxide (x7)
Hossain (2006) Samples 305 arsenic removal plants (ARPs)–based on typical ARP with granular ferric oxide
Amiri (2010), BCSIR (2008) Apyron Alumina and modified alumina.
Amiri (2010), BCSIR (2008) Nelima Granular ferric oxide.
Overall, the general issues with quality included:
Small or vague sample sizes, No information on withdrawal,
No information given on samples taken for analysis, e.g. filtering, blanks, blinding, number of replicates taken at one point in time or over a period of time,
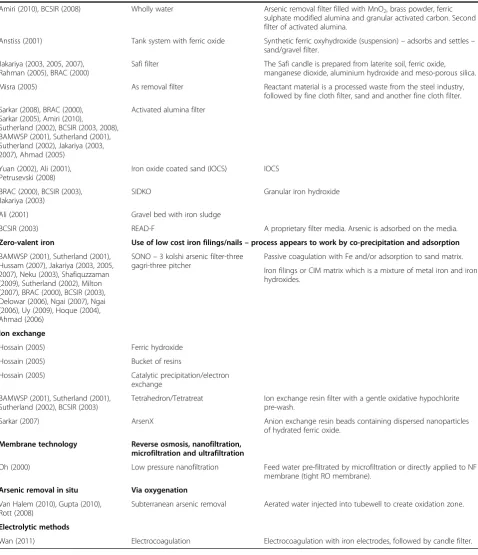
Table 9 Summary of interventions with details on mechanisms, where available(Continued)
Amiri (2010), BCSIR (2008) Wholly water Arsenic removal filter filled with MnO2, brass powder, ferric
sulphate modified alumina and granular activated carbon. Second filter of activated alumina.
Anstiss (2001) Tank system with ferric oxide Synthetic ferric oxyhydroxide (suspension)–adsorbs and settles– sand/gravel filter.
Jakariya (2003, 2005, 2007), Rahman (2005), BRAC (2000)
Safi filter The Safi candle is prepared from laterite soil, ferric oxide, manganese dioxide, aluminium hydroxide and meso-porous silica.
Misra (2005) As removal filter Reactant material is a processed waste from the steel industry, followed by fine cloth filter, sand and another fine cloth filter.
Sarkar (2008), BRAC (2000), Sarkar (2005), Amiri (2010),
Sutherland (2002), BCSIR (2003, 2008), BAMWSP (2001), Sutherland (2001), Sutherland (2002), Jakariya (2003, 2007), Ahmad (2005)
Activated alumina filter
Yuan (2002), Ali (2001), Petrusevski (2008)
Iron oxide coated sand (IOCS) IOCS
BRAC (2000), BCSIR (2003), Jakariya (2003)
SIDKO Granular iron hydroxide
Ali (2001) Gravel bed with iron sludge
BCSIR (2003) READ-F A proprietary filter media. Arsenic is adsorbed on the media.
Zero-valent iron Use of low cost iron filings/nails–process appears to work by co-precipitation and adsorption
BAMWSP (2001), Sutherland (2001), Hussam (2007), Jakariya (2003, 2005, 2007), Neku (2003), Shafiquzzaman (2009), Sutherland (2002), Milton (2007), BRAC (2000), BCSIR (2003), Delowar (2006), Ngai (2007), Ngai (2006), Uy (2009), Hoque (2004), Ahmad (2006)
SONO–3 kolshi arsenic filter-three gagri-three pitcher
Passive coagulation with Fe and/or adsorption to sand matrix.
Iron filings or CIM matrix which is a mixture of metal iron and iron hydroxides.
Ion exchange
Hossain (2005) Ferric hydroxide
Hossain (2005) Bucket of resins
Hossain (2005) Catalytic precipitation/electron exchange
BAMWSP (2001), Sutherland (2001), Sutherland (2002), BCSIR (2003)
Tetrahedron/Tetratreat Ion exchange resin filter with a gentle oxidative hypochlorite pre-wash.
Sarkar (2007) ArsenX Anion exchange resin beads containing dispersed nanoparticles of hydrated ferric oxide.
Membrane technology Reverse osmosis, nanofiltration, microfiltration and ultrafiltration
Oh (2000) Low pressure nanofiltration Feed water pre-filtrated by microfiltration or directly applied to NF membrane (tight RO membrane).
Arsenic removal in situ Via oxygenation
Van Halem (2010), Gupta (2010), Rott (2008)
Subterranean arsenic removal Aerated water injected into tubewell to create oxidation zone.
Electrolytic methods
No agreement or comparison between laboratory and field measurements,
No details on lab accreditation, No participant characteristics, No randomisation,
No details on intervention characteristics, e.g. household/community, costs, flow rate and maintenance requirements.
At least four studies report that there were differences between the outcomes presented in the methods and those reported in the results
[27,28,32,33].
Synthesis of evidence
The effectiveness evidence for each of the intervention groupings is presented in this section. The primary out-come is the percentage of effluent water samples with ar-senic concentrations below WHO guidelines (≤0.01 mg/L), based on ‘safe/acceptable’ levels of exposure for humans. There are three secondary outcomes: (a) the proportion of effluent water samples with arsenic concentrations below the guideline limit for the country in which the study was conducted (e.g. < 0.05 mg/L in Bangladesh), (b) arsenic concentrations measured in human tissue, and (c) behav-ioural aspects related to the use and acceptance of the interventions.
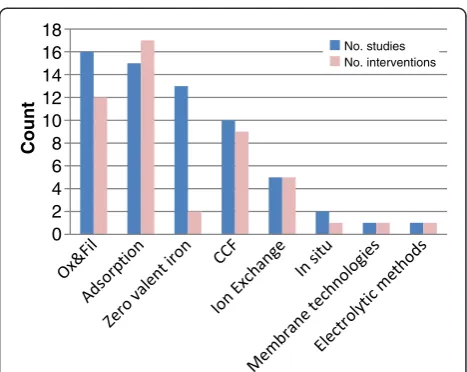
Figure 4 shows the number of studies reporting for which a quantitative effectiveness outcome is available within each intervention group. This figure also shows the number of unique interventions from these studies where effectiveness evidence is available. For instance, within the‘oxidation and filtration’group 16 studies pro-vide effectiveness epro-vidence for 12 different interventions, while for the‘zero valent iron’group, 13 studies provide effectiveness data for just two interventions.
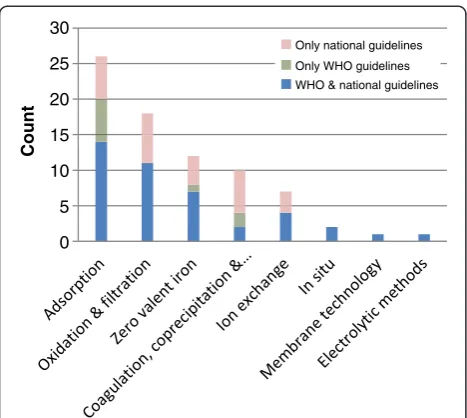
Given that some studies evaluate a number of inter-ventions and some interinter-ventions are evaluated across a number of studies, there are 90 potential study-by-inter-vention outcomes available to inform the effectiveness of arsenic removal technologies for groundwater. For 77 of these outcomes, data on the percentage of samples meeting WHO and/or national arsenic guidelines could be extracted from the study articles. For 42 of these study-by-intervention outcomes, data on the percentage of samples meeting both WHO and national guidelines for arsenic concentrations are available, while for nine and 26 of the study-by-intervention outcomes data are only available to inform the percentage of samples meet-ing WHO guidelines or national guidelines, respectively. These numbers are broken down by the intervention groupings in Figure 5.
For 13 study-by-intervention outcomes (= 90–77), data on the percentage of samples meeting WHO or national arsenic guidelines could not be extracted. This was mainly due to a lack of detail reported in the results section of the article. A list of the reasons why these data are not available for these 13 study-by-intervention out-comes is given in Additional file 8.
The available effectiveness data are presented in the fol-lowing sections, by intervention grouping, for the primary outcome: the percentage of samples meeting WHO guide-lines for As concentrations. First we provide detail on the interpretation of the figures in the following section.
Interpretation of figures
The solid dots in Figure 6 represent the percentage of samples meeting WHO guidelines for As concentrations for each intervention evaluated. The vertical lines above and below the solid dots represent the 95% CI for the per-centage of samples meeting WHO guidelines, as defined
0 2 4 6 8 10 12 14 16 18 20
Count
Studies Interventions
Figure 3Number of studies and interventions within each
intervention group.
0 2 4 6 8 10 12 14 16 18
Cou
nt
No. studies No. interventions
Figure 4The number of studies and interventions for each
to be excellent evidence of effectiveness (see Table 2). The solid horizontal line represents the cut-off where 95% of samples meet WHO guidelines. Thus, for the sand filter, 40% of samples meet the WHO guideline (solid dot), with a 95% CI ranging from 25% to 56%. The diamonds repre-sent the approximate arsenic concentration in the influent water samples for each intervention (see right-hand-side y-axis of Figure 6). The dashed horizontal line represents the WHO guideline As concentration of 0.01 mg/L. The
approximate influent As concentration for the sand filter is 0.2 mg/L. Note that where data are available, arsenic concentrations in influent water samples, except those for iron removal ceramic filters 1 and 2 (IRCF1 and IRCF2), are all well above the WHO guideline level (i.e. the dashed horizontal line). The arsenic concentrations in the influent water samples presented in Figures 6, 7, 8, 9, 10, 11 and 12 should be considered approximate as the reporting of this information is not consistent across, or even within, studies. For example, the approximate influ-ent As concinflu-entration may reflect the median, mean or mid-point from a range of As concentrations reported in a study. For clarity, where more than one author has investigated the same technology, the abbreviation is suffixed with the author’s initials. The aim is to present the reader with an understanding of the magnitude of the influent As concentration, rather than report the exact As concentration. The interpretation of Figure 6, applies equally to Figures 7, 8, 9, 10, 11 and 12.
Primary outcome: Samples meeting WHO guidelines for As concentrations
Oxidation and filtration technologies
Although outcome data on 14 oxidation and filtration studies is potentially available to inform these analyses, only 11 studies provide effectiveness evidence for the pro-portion of samples meeting WHO guidelines (As concen-tration≤0.01 mg/L). These 11 studies provide data on 11 unique interventions, however the effectiveness of the iron oxidising bacteria (IOB) technology was assessed at three locations each having different influent arsenic and iron
0 5 10 15 20 25 30
Count
Only national guidelines
Only WHO guidelines
WHO & national guidelines
Figure 5Data available for calculating the percentage of
samples meeting WHO and national arsenic concentration guidelines.
0
0.
5
1
Ap
p
ro
x
.
in
fl
u
e
n
t As
co
n
c
(m
g
/l
)
0
20
40
60
80
10
0
P
e
rc
e
n
ta
g
e
o
f
s
a
m
p
le
s
m
e
et
in
g
W
H
O
gu
id
el
in
es
ModGAR Sand
AIRP ARP
GAR DCCF
AIRP1 AIRP2
IOB1 IOB2
IOB3 IRCF1
IRCF2 NIFSF
Interventions
Figure 6Percentage (95% CI) of samples meeting WHO guidelines for oxidation and filtration technologies.ModGAR, Modified GARNET
concentrations (leading to IOB1, IOB2 and IOB3) and the IRCF are reported for two different time-points (IRCF1 in April 2007 and IRCF2 in August 2007, based on dry and wet seasons). Thus, results for a total of 14 technologies are described below.
The oxidation and filtration technologies appear to per-form poorly with the best perper-forming technology, the sand filter evaluated by Berg et al. (2006), having only 40% of effluent water samples with As concentrations below the WHO guideline [35]. In fact, for half of the technologies presented in Figure 6, 0% of samples meet the WHO guidelines (modified garnet (ModGAR), arsenic and iron
removal plant (AIRP), AIRP1, IOB1, IOB2, IRCF1 and natural iron fine sand filter (NIFSF)).
There are variations in the width of the 95% CIs, with many studies having very wide 95% CIs due to the small number of samples reported; for example, the NIFSF technology reports only four samples (one sample per month for four months).
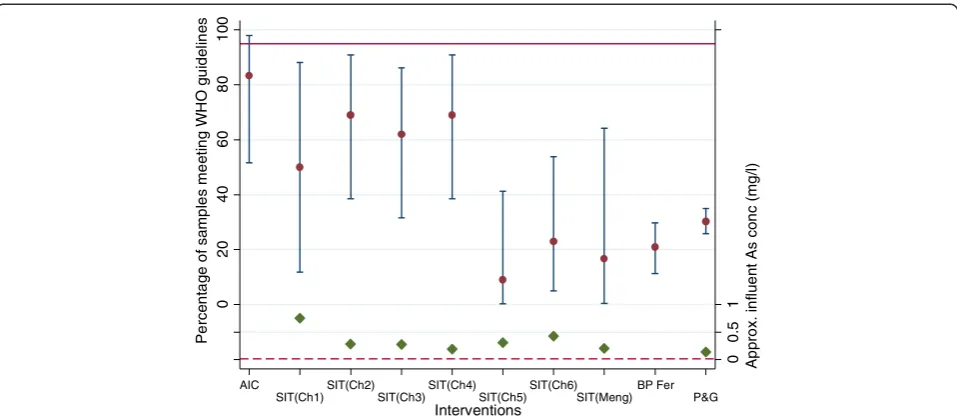
Coagulation, co-precipitation and filtration technologies
Data on the percentage of samples meeting WHO guidelines could only be determined for five of nine studies evaluating the effectiveness of coagulation,
co-0 0. 5 1 Ap p ro x . i n fl u e n t As co n c (m g /l ) 0 20 40 60 80 10 0 Pe rce n ta g e o f sa mp le s me e ti n g W H O g u id e lin e s AIC SIT(Ch1) SIT(Ch2) SIT(Ch3) SIT(Ch4) SIT(Ch5) SIT(Ch6) SIT(Meng) BP Fer P&G Interventions
Figure 7Percentage (95% CI) of samples meeting WHO guidelines for Coagulation, co-precipitation and filtration technologies.AIC,
alum iron coagulation [21]; SIT(Ch1)–SIT(Ch6), Stevens Institute technology at six sites [43]; SIT [44], Stevens Institute technology [44]; BP Fer, BP & ferric alum [45]; P&G, Proctor and Gamble powder [33].
0 0. 5 1 Ap p ro x. in flu e n t As co n c (m g /l) 0 20 40 60 80 10 0 Pe rce n ta g e o f sa mp le s me e tin g W H O g u id e lin e s Act(BRAC1) Act(BRAC2) Act(Sar) Act(Sar1) Act(Sar2) ICS IOCS Safi FerOx SIDKO ARP Interventions
Figure 8Percentage (95% CI) of samples meeting WHO guidelines for adsorption technologies.Act(BRAC1) and Act(BRAC2), activated
precipitation and filtration technologies. One study pro-vided data separately for six different wells and so the data in Figure 7 correspond to ten individual interven-tions. Based on data from these ten interventions, the coagulation, co-precipitation and filtration technologies appear to perform better than the oxidation and filtra-tion technologies, with five of the nine technologies
having ≥50% of samples meeting WHO guidelines (see
Figure 7). The best performing technology, the alum
iron coagulation (AIC), is reported by Ashraf Ali et al. (2001) to have 83% of samples meeting WHO guidelines with a 95% CI of 52% to 98% [21]. The width of the 95% CIs associated with all of these estimates (except those for BP and ferric alum (BP Fer) and Procter and Gamble Powder (P&G)) indicates a small number of samples analysed and reported. Note that where data are avail-able, the influent As concentrations are well above the WHO guideline (solid diamonds on Figure 7).
0
20
40
60
80
10
0
P
e
rc
e
n
ta
g
e
o
f
s
a
m
p
le
s
m
e
et
in
g
W
H
O
gu
id
el
in
es
Act1 Act2
Act3 Act4
Act5 AB1
AB2 RedHem
AS&FH Adsorp1
Adsorp2 Slurry
Interventions
Figure 9Percentage (95% CI) of samples meeting WHO guidelines for adsorption technologies [45].Act1-Act5, activated alumina at five
sites; AB1 and AB2, Aqua Bind at two sites; RedHem, red haematite; AS&FH, aluminium silicate and ferric hydroxide; Adsorp1 and Adsorp2, AdsorpAs at two sites; Slurry, slurry/granular ferric hydroxide.
0
20
40
60
80
10
0
P
e
rc
en
ta
ge
o
f
s
a
m
p
le
s
m
e
et
in
g
W
H
O
gu
id
el
in
es
Jhik-w1 Jhik-w2
Jhik-w3 Jhik-w4
Jhik-w5 Jhik-w6
Jhik-w13 Sona-w15
Sona-w16 Sona-w17
Sona-w18 Sona-w19
Sona-w20
Interventions
Adsorption technologies
Out of 13 studies, data are available from ten on the per-centage of samples meeting WHO guidelines. For nine of these ten studies results for 11 unique interventions are available as one study reports on an intervention separately for two different time-periods (Sarkar et al., 2008 for the activated alumina) [3] and another reports separately for two different sites (BRAC for the activated alumina) [27]. Thus, 11 estimates of the percentage of samples meeting WHO guidelines from nine of the ten studies are shown in Figure 8.
The study by Hossain et al. (2005) evaluated six dis-tinct interventions over 12 sites (Figure 9): activated alumina interventions placed at separate five sites (Act1-Act5), Aquabind (AB1, AB2) placed at two sites, Adsorp As (Adsorp1 and Adsorp2) placed at two sites, red haematite (RedHem) placed at one site, aluminium silicate and ferric hydroxide (AS&FH) at one site and slurry/granular ferric hydroxide (Slurry) at one site [45]. The results for these 12 interventions are given in Figure 9 and have been separated from the other studies within this group for clarity.
0 1 2 3 Ap p ro x . i n fl u e n t As co n c (m g /l ) 0 20 40 60 80 10 0 Pe rce n ta g e o f sa mp le s me e ti n g W H O g u id e lin e s AANF Sono(Del) Sono(Hus1) Sono(Hus2) Sono(Mil) Sono(Ngai) Sono(Shaf) Interventions
Figure 11Percentage (95% CI) of samples meeting WHO guidelines for zero valent iron technologies (from sources other than BRAC
(2001).AANF, Asia arsenic network filter [42]; Sono(Del), Sono [42]; Sono(Hus1) and sono(Hus2), sono for 2 filters [49]; Sono(Mil), sono [17]; Sono (Ngai), sono[23,30]; Sono(Shaf), Sono [32].
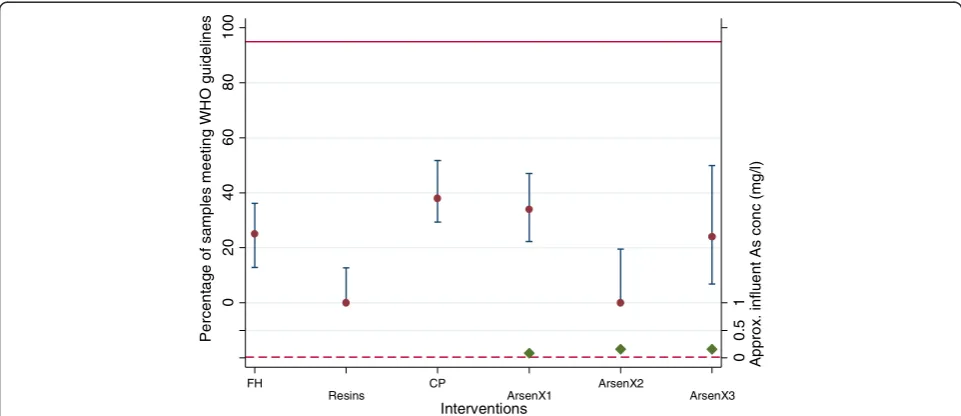
0 0. 5 1 Ap p ro x . i n fl u e n t As co n c (m g /l ) 0 20 40 60 80 10 0 P e rc e n ta g e o f s a m p le s m e et in g W H O gu id el in es FH Resins CP ArsenX1 ArsenX2 ArsenX3 Interventions
Figure 12Percentage (95% CI) of samples meeting WHO guidelines for ion exchange technologies.FH, ferric hydroxide[45]; Resins,
The results for the total of 23 interventions suggests a great deal of variation in effectiveness, with two tech-nologies having 100% of samples meeting WHO guide-lines (see Figure 8: Act(BRAC1) and Act(BRAC2)), while over half of the technologies have <50% of samples meeting WHO guidelines. The iron oxide coated sand technology (IOCS) performs well with 91% of samples having As concentrations≤0.01 mg/L. However, as with the technologies described above, there is a great deal of uncertainty in the majority of these estimates as the number of samples reported is often low (reflected in the wide 95% CIs). Note that the approximate influent As water concentrations, where available, are well above the WHO guideline.
Zero-valent technologies
Six of the 13 effectiveness studies provided data to cal-culate the percentage of effluent water samples meeting WHO guidelines. Three of these studies reported data separately for more than one individual intervention: Delowar et al. (2006) report on the Asia Arsenic Network Filter (AANF) and sono filter [42]. Hussam and Munir (2007) report on the sono filter at two different locations [49] and the BRAC report presents data for two wells over different time periods [27]. However, BRAC (2001) only reports on the percentage of effluent samples where ar-senic concentrations were 0 mg/L. These data are shown in Figure 10.
The results from BRAC (2000) suggest that the sono fil-ter performs reasonably well with >80% of samples hav-ing 0 mg/L of arsenic at the Jhikargachha site in the first six weeks of use [27]. For the Sonargaon site, after
15 weeks of use the percentage of samples having 0 mg/L is 60-80%.
Effectiveness data on zero valent iron interventions from other sources are shown in Figure 11. There is great variation in these estimates, with data on the sono filter implemented by Hussam and Munir (2007) [49] at one particular location (SonoHus1)) and the sono filter implemented by Ngai et al. (2006) (Sono(Ngai)) [23] suggesting good performance.
Ion exchange technologies
Data from two studies on five different ion exchange inter-ventions, where one intervention is reported separately at two different locations, are available to calculate the per-centage of samples meeting WHO guidelines. These data are presented in Figure 12, and suggest that ion exchange technologies are poor at reducing arsenic concentrations to within WHO guidelines, with the best performing intervention, catalytic precipitation as implemented by Hossain et al. (2005), having just 39% of samples meeting WHO guidelines [45].
Arsenic removal in situ, membrane and electrolytic technologies
As displayed in Figure 13, evidence from the two studies providing data on subterranean arsenic removal (SAR) ((1)SAR(Gupta)) and (1)SAR(V.Halem)) is inconsistent, with the SAR reported in Gupta having 72% of samples meeting WHO guidelines, while the percentage of sam-ples meeting WHO guidelines in the Van Halem et al. (2010) study is just 6% [51].
0
0.
5
1
1.
5
Ap
p
ro
x
.
in
fl
u
e
n
t As
co
n
c
(m
g
/l
)
0
20
40
60
80
10
0
Pe
rce
n
ta
g
e
o
f
sa
mp
le
s me
e
ti
n
g
W
H
O
g
u
id
e
lin
e
s
(1)SAR(Gupta)
(1)Sar(V.Halem) (2)LPN1
(2)LPN2
(2)LPN3
(2)LPN4
(3)Electro
Interventions
Figure 13Percentage (95% CI) of samples meeting WHO guidelines for arsenic removal in situ, membrane and electrolytic
Evidence for the effectiveness of nanofiltration is poor, as it is only based on two samples at two sites, hence the great width of the confidence intervals. However, the evidence from the only study evaluating electrocoagula-tion as a technology suggest this performs reasonably well with 82% of samples meeting WHO guidelines, but it does not reach our criteria for excellent evidence of ef-fectiveness [53].
Secondary outcome: Percentage of samples meeting national guidelines for As concentrations
As Figure 5 shows, much more data are available from the included studies to calculate the percentage of samples meeting national guidelines than for WHO guidelines. This is perhaps due to the national guideline being seen as more achievable than the WHO guideline for arsenic con-centrations in groundwater, but also field testing kits may have difficulty measuring at the WHO guidelines for arsenic concentrations in groundwater [1]. For all coun-tries in which these studies were conducted (Bangladesh, India, Nepal, Cambodia, Vietnam and China), the national guideline for arsenic concentrations in groundwater is0.05 mg/L. This therefore helps comparison across stud-ies and interventions for this outcome.
It should be noted that although there is evidence that clinical symptoms of arsenicosis may occur at < 0.05 mg/L [54], it has been argued that attempting to adopt a lower standard in a developing country, when the existing stand-ard has not yet been achieved, may lead to scarce re-sources being misdirected [1].
Oxidation and filtration
The evidence on these technologies to reduce or remove arsenic to≤0.5 mg/L is mixed, with most interventions having >60% of samples meeting national guidelines (see Additional file 9, Figures A and B). In particular, three interventions have 100% of samples meeting national guidelines: the Space ARP evaluated by Brennan (2011) [37], the garnet filter evaluated by Rahman et al. (2005) [38] and the IOB evaluated by Hassan et al. (2008) [40] in location 1. In contrast, the ardasha filter and passive sedi-mentation technologies have particularly poor perform-ance with <10% of samples meeting national guidelines.
Coagulation, co-precipitation and filtration
Of the three different coagulation, co-precipitation and filtration technologies providing data for this outcome, only the Stevens Institute Technology, as implemented by BAMWSP, Cheng et al. (2004) and Meng et al. (2001), Table 10 Summary of effectiveness evidence for
oxidation and filtration interventions
Intervention Study Effectiveness evidence
AIRP & AJIRU Al-Muyeed
Hassan 2008
Sharma
Modified Garnet Amin
Garnet BAMWSP
Rahman 2005
Sutherland 2001
Sutherland 2002
Ardasha BAMWSP
Sutherland 2001
Passive sedimentation BAMWSP
Hoque
Sutherland
Sand filter Berg 2006
Domestic clay candle Bhattacharyya
SPACE ARP Brennan
NIFSF Delowar
Iron oxidising baceria Hassan 2009
1
Iron removal ceramic Shafiquazaman 1
Depending on location.
Table 11 Summary of effectiveness evidence for
coagulation, co-precipitation and filtration interventions
Intervention Study Effectiveness evidence
Alum iron coagulation Ali 2001 1
CIWPL Amiri 2010 2
STAR Amiri 2010 3
DPHE BAMWSP
Sutherland 2001
Sutherland 2002
Stevens BAMWSP
Cheng 2004
Meng 2001
Sutherland 2001
Sutherland 2002 4
Alum treatment Hoque 2000
BP & ferric alum Hossain 2005
P&G powder Norton 2009
1
Data to inform national guidelines not available.
2
Mean effluent arsenic concentrations for 6 out of 7 filters was < 0.05 mg/l.
3
Mean effluent arsenic concentrations for 5 out of 7 filters was < 0.05 mg/l.
4
have any outcomes with ≥95% (see Additional file 9, Figures C and D) [25,43,44]. The P&G powder evaluated by Norton et al. (2009) has 86% of samples meeting na-tional guidelines [33]. The DPHE/Danida technologies do not perform well across sites and studies, ranging from 3% to 80% of samples meeting national guidelines.
Adsorption
All but one of the adsorption interventions having avail-able data have >95% of samples meeting national guide-lines, therefore defined in this report as good evidence of effectiveness (see Additional file 9, Figures E and F). The intervention with < 95% of samples meeting national guidelines is the ARP as investigated by Hossain et al. (2006) [48].
Zero valent
The zero valent iron technologies are considered to have good evidence of effectiveness with 12 out of the 14 pro-viding available data, having ≥95% of samples meeting national guidelines (see Additional file 9, Figure G). The sono intervention assessed by Milton et al. (2007) [17], the only RCT, has the lowest percentage of all zero valent iron technologies with 65% of samples meeting national guidelines.
Ion exchange
There is mixed evidence for the effectiveness of ion ex-change technologies in terms of the percentage of samples meeting national guidelines for arsenic concentrations in groundwater (see Additional file 9, Figure H). The effect-iveness of tetrahedron technologies is inconsistent across sites and within studies, ranging from 57% to 100% for different sites within the same study [25]. The ArsenX technologies have poor evidence of effectiveness [50].
Arsenic removal in situ, membrane and electrolytic technologies
Due to the low number of samples assessed in Oh et al. (2000) where membrane technology was evaluated [22], it is difficult to comment on the effectiveness of this technology (see Additional file 9, Figure I). Data on the subterranean arsenic removal in situ interventions is in-consistent ranging from 34% [51] to 85% [52]. However, the electrocoagulant technology evaluated by Wan et al. (2011) has 100% of samples meeting national guidelines (see Additional file 9, Figure I) [53].
Groundwater effectiveness summary
A summary of the groundwater effectiveness evidence from each study for each intervention evaluated can be found in Tables 10, 11, 12, 13, 14 and 15. They are summarised by their strength of effectiveness evidence as defined in Table 2, p 16. The hollow circles corres-pond to poor strength of evidence, the crossed-through circles represent good effectiveness evidence with the solid circles representing excellent evidence of effective-ness. For those interventions where the data are incon-clusive, no corresponding circle is shown.
Table 12 Summary of effectiveness evidence for adsorption interventions
Intervention Study Effectiveness evidence
Iron oxide coated sand Ali 2001
Petrusevski
Yuan 2002 1
Activated alumina (not specific)
BRAC 2000
Hossain 2005x2
Sarkar 2005
Sarkar 2008
Activated alumina (ALCAN) Amiri 2010
BAMWSO
Sutherland 2001
Sutherland 2002 2
Activated alumina (BUET) BAMWSP
Sutherland 2001
Sutherland 2002
Apyron Amiri 2010 3
Nelima Amiri 2010 4
Shapla Amiri 2010 5
Wholly water Amiri 2010 6
Ferric oxide Anstiss 2001
SIDKO BRAC 2000 7
Safi BRAC 2000
Rahman 2005
Aqua bind Hossain 2005
Red hematite Hossain 2005
Aluminium silicate & ferric hydroxide
Hossain 2005
Adsorp As Hossain 2005
Slurry/granular ferric hydroxide
Hossain 2005
ARP Hossain 2006
As removal filter Misra 8
1
Data to inform was not available from Ali 2001 or Yuan 2002.
2
For Amiri 2010, the mean effluent arsenic concentrations for all 7 filters was < 0.05 mg/l.
3
Mean effluent arsenic concentrations for all 7 filters was < 0.05 mg/l. 4 Mean effluent arsenic concentrations for all 7 filters was < 0.05 mg/l.
5
Intervention failed.
6
Intervention failed.
7
Data to inform was not available.
8
![Figure 9 Percentage (95% CI) of samples meeting WHO guidelines for adsorption technologies [45]](https://thumb-us.123doks.com/thumbv2/123dok_us/9130928.1906363/17.595.57.539.89.307/figure-percentage-ci-samples-meeting-guidelines-adsorption-technologies.webp)