R E S E A R C H A R T I C L E
Open Access
Higher bioavailability of magnesium citrate
as compared to magnesium oxide shown
by evaluation of urinary excretion and
serum levels after single-dose administration
in a randomized cross-over study
Dominik Kappeler
1*, Irene Heimbeck
1, Christiane Herpich
1, Natalie Naue
1, Josef Höfler
2, Wolfgang Timmer
1and Bernhard Michalke
3Abstract
Background:The development of several disorders, such as cardiovascular diseases, diabetes and osteoporosis, has been linked to suboptimal dietary magnesium (Mg) intake. In this context, a number of studies have tried to investigate which Mg compounds are best suited for Mg supplementation. Results suggest that organic Mg compounds are superior to the inorganic Mg oxide in terms of bioavailability, but a reliable statement cannot yet be made due to systematic differences in the applied study designs.
Methods: This single-center, randomized, open, 2-period, 2-supplementation, 2-sequence, single-dose, cross-over study was conducted in 20 healthy male subjects of Caucasian origin to investigate and compare the bioavailability of Mg citrate, an organic Mg compound, and Mg oxide, an inorganic Mg compound. In order to reliably assess the bioavailability of both Mg compounds, subjects were supplemented with magnesium to saturate their Mg-pools before administration of each study product. The bioavailability of both Mg compounds was then assessed by measurement of the renally eliminated Mg quantity during an interval of 24 h after single-dose Mg administration (Ae 0-24h) as primary endpoint. Additionally, the Mg concentrations in a subset of leukocytes, in erythrocytes and in serum were measured on an exploratory basis.
Results:After administration, Ae 0-24hof magnesium was higher for Mg citrate than for Mg oxide. Ae 0-24hfor both study products was compared by analysis of variance (ANOVA), revealing an adjusted mean difference of 0.565 mmol, which was statistically significant at the 5% level (95% confidence interval of 0.212 to 0.918 mmol,p= 0.0034). Besides, serum Mg concentrations were statistically significantly higher for Mg citrate than for Mg oxide at several time points after administration. No statistically significant difference was shown in intracellular Mg contents.
Conclusions:This study confirms former study results showing a higher bioavailability of the organic Mg compound Mg citrate compared to Mg oxide. It can be concluded that Mg citrate, similar to other organic Mg compounds, may be more suitable than Mg oxide to optimize the dietary magnesium intake.
Trial registration:Retrospectively registered with the Australian New Zealand Clinical Trials Registry (ACTRN12615001268538) on November 19, 2015.
Keywords:Bioavailability, Oral Mg supplementation, Mg citrate, Mg oxide, Urinary excretion
* Correspondence:[email protected] 1Inamed GmbH, 82131 Gauting, Germany
Full list of author information is available at the end of the article
Background
Magnesium (Mg) is an essential electrolyte and plays a central role in various cellular functions [1]. Over the last 30–40 years, the dietary intake of Mg has declined in many industrialized countries due to changes in food preparation and nutritive behavior [2]. Studies suggest that wide sections of the population are at risk of devel-oping chronic latent Mg deficiency [3–5].
Suboptimal dietary Mg intake has been implicated in the development of several disorders, such as cardiovas-cular diseases, diabetes and osteoporosis [2, 6, 7], under-lining the importance of sufficient magnesium intake.
Several oral preparations to supplement dietary Mg in-take are currently available on the market. They differ in the type of dosage form or the type of Mg compound used, which can be inorganic (e.g., Mg oxide) or organic (e.g., Mg citrate).
Human studies have tried to investigate which Mg compounds are best suited for Mg supplementation by determining and comparing their respective bioavailability [8–14]. Their results suggest that Mg supplementation with organic magnesium compounds such as Mg citrate, Mg aspartate and Mg aspartate-hydrochloride might be more efficient than with the inorganic Mg oxide. However, those results are difficult to compare due to systematic differences in study design and analyses of parameters. Measuring Mg absorption is complicated by the fact that Mg physiologically occurs in several compartments of the human body and the Mg serum concentrations, although easily accessible, are extraordinarily well-regulated, mak-ing it difficult to use serum concentration-time curves for measuring bioavailability [15]. The amount of renally ex-creted magnesium in Mg-replete individuals after an oral Mg load has been proposed as a clinically relevant meas-ure of Mg absorption [9, 14–17].
After administration of Mg and intestinal absorption, the Mg-pools in the bones fill up first. Bone contains about 60% of total body Mg, whereas the remaining 40% is stored in soft tissue [18]. Systemic Mg distribu-tion highly fluctuates and the rate and extent of Mg ab-sorption depend on the filling state of those Mg-pools. The daily renal excretion of Mg depends on the absorbed amount of Mg from the diet and on the filling state of the Mg-pools. Transfer of magnesium from serum into urine begins immediately when the pools are saturated, about 1-2 h after absorption [16]. In con-trast, the uptake of Mg into body organs is slow. As a result, the replenishing of depleted Mg-pools requires a supplementation with rather high amounts of magne-sium over a relatively long time [16]. Therefore, an ad-equate duration of Mg administration in order to saturate the Mg-pools is essential when the bioavailability of Mg is studied by renal excretion after oral administra-tion of a Mg product [9, 13, 15, 16, 19].
In order to obtain consistent results and to reliably as-sess bioavailability of both Mg compounds by measuring the renally eliminated Mg quantity, subjects in this study were first supplemented with magnesium to completely fill their Mg-pools before study product administration. During the initial Mg saturation phase of 5 days, sub-jects received five single doses of 100 mg magnesium as Mg citrate a day. An intermediate Mg saturation phase of 2 days was introduced between the administrations of the different study products to ensure that the Mg-pools of the subjects remained filled. Additionally, subjects’ dietary Mg intake was standardized throughout the study. Filling status of Mg-pools was examined by com-parison of baseline Mg excretion after both Mg satur-ation phases.
Comparability to formerly published results is warranted by also analyzing the Mg content in blood serum and cel-lular blood components (monocytes and lymphocytes as well as erythrocytes). Inductively coupled plasma optical emission spectrometry was used to determine Mg in urine and monocyte and lymphocyte samples. Magnesium con-tent in erythrocytes was determined by a combination of a clinical chemistry method and flame atomic absorption spectrometry, whereas the serum samples were analyzed spectrophotometrically.
The aim of this study was to compare the bioavailabil-ity of Mg oxide and Mg citrate after single-dose adminis-tration following Mg saturation.
Methods
Study design and objectives
This study was conducted in Germany as a single-center, randomized, open, 2-period, 2-supplementation, 2-sequence, single-dose, cross-over study to compare the bioavailability of two different Mg compounds: Mg citrate and Mg oxide. Both Mg compounds were provided as capsules (please refer to the methods’ subsection study products below for more information).
The bioavailability of magnesium was assessed by measuring the renally eliminated Mg quantity during the interval of 24 h after Mg administration (Ae 0-24h) as pri-mary endpoint. Additionally, and on an exploratory basis, the magnesium concentrations in a subset of leu-kocytes (i.e., monocytes and lymphocytes) as well as in erythrocytes and the magnesium concentration in blood serum were measured (please refer to the methods’ sub-section sample collection and analyses below for details regarding the analytical methods).
blinding of products administered were not considered necessary.
Study subjects and eligibility criteria
A total of about 20 healthy male subjects of Caucasian origin aged between 18 and 45 years (inclusive) were to be included in this study. Only male subjects were eligible because the female hormone estrogen affects Mg distribu-tion and therefore Mg excredistribu-tion [20].
Subjects were only included if they had a body mass index (BMI) within the range of 18.0 to 29.0, a normal blood pressure (systolic blood pressure≥95≤140 mmHg and diastolic blood pressure ≥55≤90 mmHg), a resting pulse of ≥45 and ≤95 bpm, a normal digestion (i.e., no current obstipation or diarrhea), a normal renal function (serum-creatinine <1.2 mg/dL), an ECG recording with-out clinically significant abnormalities and if they re-ported no febrile or infectious illness for at least 7 days prior to the Screening Visit.
Illnesses or use of medication with influence on renal function (e.g., diabetes, diuretics), conditions which might interfere with the absorption of the study products (e.g., cholecystectomy, bowel resection) or any gastrointestinal complaints within 7 days prior to the Screening Visit were considered criteria for exclusion. Additionally, subjects presenting with symptoms of Mg deficiency (e.g., muscle cramps or fasciculations) as determined by physical exam-ination and anamnesis or any active physical disease (acute or chronic) were excluded. Moreover, clinical chemical, hematological or any other laboratory parame-ters (i.e., urinalysis and serology) clinically relevant outside the normal range as judged by the investigator were con-sidered criteria for exclusion.
Those with any history of chronic or recurrent meta-bolic, renal, hepatic, pulmonary, gastrointestinal, neuro-logical, endocrinoneuro-logical, immunoneuro-logical, psychiatric or cardiovascular disease and bleeding tendency were also excluded. Moreover, a history of alcohol or drug abuse, chronic gastritis, peptic ulcers, drug hypersensitivity, asthma, urticaria or other severe allergic diathesis as well as acute symptoms of hay fever were considered criteria for exclusion.
Also excluded were current smokers, subjects report-ing a history of smokreport-ing within the last 3 months or those who consumed >35 g of ethanol regularly per day, respectively >245 g ethanol regularly per week or more than 5 cups of coffee (or equivalent) per day. Moreover, consumption of alcohol or xanthine-containing food or beverages (e.g., coffee or black tea) as well as grapefruit juice was not allowed within 48 h prior to first administration of magnesium. Alcohol consump-tion was determined by quesconsump-tioning and regular alco-hol breath tests.
Study flow and procedures
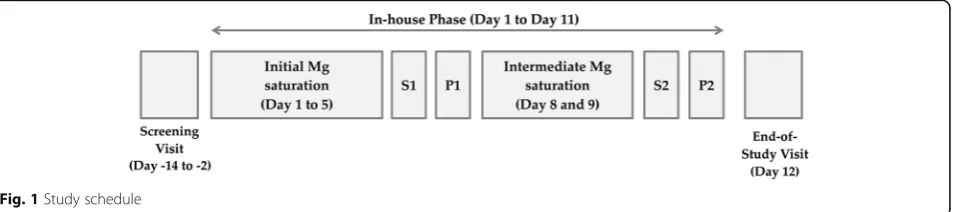
The study consisted of a Screening Visit, an In-house Phase and an End-of-Study Visit. Subjects were screened for eligibility within 14 to 2 days prior to the In-house Phase. Figure 1 presents an overview of the study schedule. The In-house Phase included two profile days (P1 and P2). P1 was preceded by an initial magnesium saturation phase of 5 days, followed by one stop-of-saturation day (S1). P1 and P2 were separated by an intermediate mag-nesium saturation phase of 2 days, followed by another stop-of-saturation day (S2). The End-of-Study Visit was performed on the day after last study product adminis-tration. The stop-of-saturation days were integrated in the study schedule to avoid distortion of renal magne-sium excretion on profile days by the high magnemagne-sium load administered during the saturation phases.
During the magnesium saturation phases, five single doses of 100 mg magnesium were to be taken at ap-proximately 08.00 am, 10.00 am, 01.00 pm, 04.00 pm, and 06.00 pm together with 200 mL of water of normal Mg content (approximately 15 mg/L) each. On stop-of-saturation days, subjects did not receive magnesium supplementation.
In the morning of each profile day at about 08.00 am to 09.00 am, the subjects received a single dose of 300 mg Mg in the form of Mg citrate or Mg oxide after an overnight fast of at least 8 h. Immediately after in-take, the subjects were to drink 200 mL of water of nor-mal Mg content. Water was allowed until 1 h prior to administration.
During the In-house Phase, all subjects received a bal-anced, mixed diet containing approximately 300 to 400 mg magnesium per day. The diet was composed by a dietitian according to standard nutrient tables. On each profile day, standardized meals (i.e., identical meals) were provided. On each profile day, starting 2 h after ad-ministration, non-carbonated water of normal Mg con-tent at room temperature was served.
On study days with urine sampling, subjects were re-quested to follow a standardized drinking schedule. Sub-jects were to drink 200 mL of water of normal Mg content every 2 h. An additional portion of 200 mL water was to be drunk together with lunch. On the other study days, subjects were free to consume water of normal Mg content in common amounts. Subjects were asked to drink approximately 2 l a day.
Study products
The test product was Magnesium Verla® purKaps cap-sules, containing the organic magnesium compound mag-nesium citrate, marketed by Verla-Pharm Arzneimittel GmbH & Co. KG, Germany. The product is also marketed under the trade name Xenofit® Magnesiumcitrat pure in Germany. Each capsule provides a dose of 150 mg elem-ental magnesium.
The reference product was Biolectra® Magnesium 300 mg Kapselncapsules, containing the inorganic mag-nesium compound magmag-nesium oxide, manufactured by HERMES Arzneimittel GmbH, Germany. Each capsule provides a dose of 300 mg elemental magnesium.
For the saturation phases, capsules containing magne-sium citrate (100 mg elemental magnemagne-sium per capsule) were used.
All study products were supplied by Verla-Pharm Arzneimittel GmbH & Co. KG, Germany.
Sample collection and analyses Urine
Urine was collected over 24 h in nine fractions (0-2, 2-4, 4-6, 6-8, 8-10, 10-12, 12-14, 14-16 and 16-24 h) on stop-of-saturation days and on profile days.
Directly after the first micturition, urine samples were acidified with 200μL highly purified concentrated HNO3. After each micturition, samples were mixed and stored at 2-8 °C. The volume of each fraction was recorded and two aliquots per fraction (5 mL each) were filled in sample shipment tubes. Samples were stored under continuous temperature control below -20 °C and were shipped frozen on dry ice to the bioanalytical site (Helmholtz Zentrum Muenchen, Neuherberg, Germany).
Urine samples were analyzed for total Mg content by inductively coupled plasma optical emission spectrom-etry (ICP-OES), using a “Spectro Ciros Vision” system
(Spectro-Ametek, Kleve, Germany). ICP-OES has been established for more than 35 years for trace element analysis in biological matrices. This technique deter-mines elements, such as magnesium, as total element content, independently of their physico-chemical state (oxidation state or chemical binding form) [21, 22].
Instrumental parameters: Sample introduction was performed by the instrument’s peristaltic pump at 1.0 mL/min and a Meinhard nebulizer which was fitted into a cyclone spray chamber. The measured spectral element line was: Mg 279.079 nm.
The radio frequency (RF) power was set to 1000 W; the plasma gas was 15 L Ar/min and the nebulizer gas was 600 mL Ar/min. Analytical quality control for Mg determination was performed by analysis of blanks and certified control standards (PE# N0691745, Perkin Elmer Pure) after every ten samples. Accuracy of measure-ments was determined according to IUPAC guidelines [23] by analysis of an adequate certified standard refer-ence material, BCR® 304, from the Joint Research Centre, Institute for Reference Materials and Measurements (IRMM) of the European Union. The found value was 1.85 ± 0.01 mmol/L and the certified value is 1.85 ± 0.03 mmol/L, resulting in an accuracy of 100%. The ser-ial precision (N= 10) was 1.9% and the day-to-day preci-sion (N= 10) was 2.3%.
Monocytes and lymphocytes
On profile days, blood samples (15 mL) were collected at predose, 9 and 24 h post dose in heparinized plasma tubes. The anticoagulated blood was diluted with 7.5 mL phosphate buffered saline (PBS), mixed and carefully poured into Leucosep® tubes (Greiner Bio-One, No. 227288). Samples were centrifuged for 15 min at 1000 × g at room temperature. After centrifugation, the inter-phase containing monocytes and lymphocytes was har-vested and washed twice with PBS. In the end, the cells were pelleted by centrifugation and the remaining liquid supernatant was removed. Cell pellets were stored under continuous temperature control below −20 °C and shipped frozen on dry ice to the bioanalytical site (Helm-holtz Zentrum Muenchen, Neuherberg, Germany).
Cell pellets were lysed in suprapure HNO3 and ana-lyzed for total Mg content by ICP-OES analogously to the urine samples.
Erythrocytes
determination were stored and shipped at room temperature. The bioanalytical analyses were performed by the contract laboratory Medizinisches Versorgungszen-trum Labor Muenchen ZenVersorgungszen-trum, Munich, Germany.
Hematocrit (Hct) was measured with a particle coun-ter and calculated by the number of erythrocytes and their mean cellular volume. It represents the proportion of erythrocytes in whole blood (in Vol %).
Magnesium concentration in serum (MGA) was mea-sured directly by a clinical chemistry method. Magnesium concentration in whole blood (MGV) was measured directly by flame atomic absorption spectrometry. The intra-assay precision ranged from 1.4 to 3.7% and the inter-assay precision ranged from 3.2 to 5.2%. The limit of detection was 0.03 mmol/L and the lower limit of quantification was 0.07 mmol/L.
The magnesium concentration in erythrocytes (MGER) was calculated as follows:
MGER¼ ðMGV−
MGAð1−ðHct0:01ÞÞ
Þ ðHct 0:01Þ½in mmol=L
ð1Þ
Serum
On profile days, blood samples (2.6 mL) were collected at predose, 60 min, 2, 3, 4, 5, 6, 9 and 24 h post dose in closed serum tubes.
Immediately after taking, the samples were incubated at room temperature for at least 20 min but no longer than 60 min for clotting. To ensure comparability, the preferred incubation time was 30 min. Thereafter, samples were centrifuged at room temperature and 1700 × g for 10 min. The complete resulting serum supernatant was then transferred into polypropylene tubes and shipped to the bioanalytical site (Medizinisches Versorgungszentrum Labor Muenchen Zentrum, Munich, Germany).
Serum samples were analyzed for Mg2+ content by a spectrophotometric method. The intra-assay precision ranged from 0.49 to 3.7% and the inter-assay precision ranged from 0.30 to 3.33%. The lower limit of quantifi-cation was 0.29 mmol/L.
Statistics
Sample size calculation
Considering an analysis of variance (ANOVA) for a dif-ference of means in a 2 × 2 cross-over, a sample size of N= 18 was determined to reach 80% power for the pri-mary endpoint. The calculation was performed using nQuery Advisor + nTerim 2.0® software with the following assumptions: mean difference = 5%, standard deviation (SD) of difference = 8%, power≥80%.
In order to allow for withdrawals, at least 20 subjects were to be randomized.
Randomization
On Profile Day 1, subjects were randomly assigned to 1 of the 2 following sequences of study product administration:
Sequence 1 - Period 1:Biolectra® Magnesium 300 mg Kapseln; Period 2:Magnesium Verla® purKaps. Sequence 2 - Period 1:Magnesium Verla® purKaps; Period 2:Biolectra® Magnesium 300 mg Kapseln.
The randomization code for assigning random num-bers to sequence groups was created using SAS® 9.4 software.
Statistical analyses
At first, the renally excreted Mg quantity during the interval of 24 h after Mg administration (Ae 0-24h) was calculated from the nine urine fractions taken and was analyzed by descriptive statistics for each group.
In order to compare the bioavailability of the test and reference product, an ANOVA was performed. Based on the result of a Kolmogorov-Smirnov data normality test, raw data or log-transformed (natural logarithm) values were used for the ANOVA. The ANOVA was performed at the 5% level [P< 0.05], two-sided, using SAS® 9.4 soft-ware. Effects considered in the ANOVA model were: study product, sequence, period and subject within sequence.
Statistical significance at a level of 5% was given if the 95% confidence interval (CI) of the adjusted mean differ-ence resulting from the ANOVA did not include zero, respectively if the adjusted mean ratio resulting from the ANOVA with log-transformed data (log-ANOVA) did not include 1.
The statistical analyses of the Mg concentrations in a subset of leukocytes, in erythrocytes and in serum were carried out analogously to the analysis of the primary endpoint.
Results
Subjects
A total of 24 subjects signed informed consent and were screened for this study. One subject did not meet eligi-bility criteria and three subjects withdrew consent after Visit 1. Twenty male Caucasian subjects, who fulfilled all the inclusion criteria and in whom no exclusion criterion was present were included into the study and were ran-domized. All 20 subjects completed the study.
(SD) at 77.4 (7.63) kg. BMI was between 18.8 and 28.1, with the statistical mean (SD) at 23.4 (2.54). Key demo-graphic characteristics of the study subjects are sum-marized in Additional file 1: Table S1 in the online material.
Analyses Urine
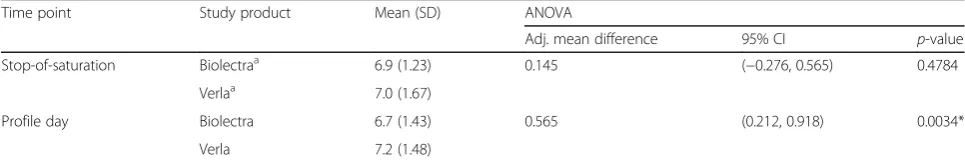
On stop-of-saturation days, the mean (SD) Ae 0-24h of magnesium before administration of Biolectra® Magnesium 300 mg Kapseln was 6.9 (1.23) mmol and 7.0 (1.67) mmol before administration of Magnesium Verla® purKaps (please refer to Table 1, Fig. 2 and Additional file 2: Figure S1). The ANOVA indicated a similar baseline between groups, with an adjusted mean difference of 0.145 mmol (95% CI ranged from−0.276 to 0.565 mmol; p= 0.4784). Therefore, it can be concluded that the subjects’Mg-pools were filled to about the same extent before administration of either of the study prod-ucts and magnesium bioavailability via renal elimination could be compared reliably.
On profile days, the primary parameter Ae 0-24h of magnesium was higher for Magnesium Verla® purKaps, with mean (SD) of 7.2 (1.48) mmol as compared to 6.7 (1.43) mmol after administration ofBiolectra® Magne-sium 300 mg Kapseln(please refer to Table 1).
The data did not need to be log-transformed prior to the ANOVA as the results of the Kolmogorov-Smirnov normality test had not led to a rejection of the null hy-pothesis of data normality. As presented in Table 1 and Fig. 2, the ANOVA to compare Ae 0-24hfor both study products revealed an adjusted mean difference of 0.565 mmol, which was statistically significant at the 5% level (95% CI of 0.212 to 0.918 mmol,p= 0.0034).
Monocytes and lymphocytes
Mean (SD) magnesium concentration in monocytes and lymphocytes before administration of Biolectra® Magne-sium 300 mg Kapselnwas 0.11 (0.034) mg/L and there-fore largely identical to the value measured bethere-fore
administration of Magnesium Verla® purKaps, with 0.12 (0.043) mg/L (please refer to Table 2 and Fig. 3).
The data did not need to be log-transformed prior to the ANOVA as the results of the Kolmogorov-Smirnov normality test had not led to a rejection of the null hy-pothesis of data normality.
The ANOVA to compare the magnesium concentra-tion in monocytes and lymphocytes revealed adjusted mean differences, which were not statistically significant at the 5% level (Table 2) at all time points measured, with point estimates of 0.013 mg/L for predose (95% CI of−0.004 to 0.030 mg/L;p= 0.1235), 0.005 mg/L for 9 h post dose (95% CI of −0.012 to 0.002 mg/L;p= 0.1614), and −0.007 mg/L for 24 h post dose (95% CI of −0.018 to 0.005 mg/L;p= 0.2424).
Erythrocytes
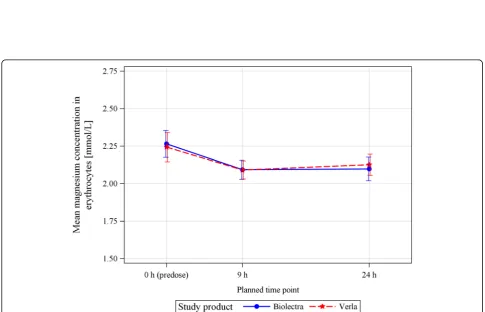
Mean (SD) magnesium concentration in erythrocytes be-fore administration of Biolectra® Magnesium 300 mg Kapseln was 2.27 (0.400) mmol/L and therefore largely identical to the values measured before administration ofMagnesium Verla® purKapswith 2.24 (0.439) mmol/L (please refer to Table 2 and Fig. 4).
The data did not need to be log-transformed prior to the ANOVA as the results of the Kolmogorov-Smirnov normality test had not led to a rejection of the null hy-pothesis of data normality.
The ANOVA to compare the magnesium concentra-tion in erythrocytes revealed adjusted mean differences, which were not statistically significant at the 5% level (Table 2) at all time points measured, with point esti-mates of −0.022 mmol/L for predose (95% CI of−0.233 to 0.189 mmol/L; p= 0.8294), −0.001 mmol/L for 9 h post dose (95% CI of−0.116 to 0.113 mmol/L;p= 0.9784), and 0.028 mmol/L for 24 h post dose (95% CI of−0.106 to 0.162 mmol/L;p= 0.6655).
Serum
Mean (SD) serum Mg concentration before administra-tion of Biolectra® Magnesium 300 mg Kapseln was 0.87 (0.042) mmol/L and therefore identical to the values
Table 1Analysis of renally eliminated magnesium (Ae 0-24h) in mmol
Time point Study product Mean (SD) ANOVA
Adj. mean difference 95% CI p-value
Stop-of-saturation Biolectraa 6.9 (1.23) 0.145 (−0.276, 0.565) 0.4784
Verlaa 7.0 (1.67)
Profile day Biolectra 6.7 (1.43) 0.565 (0.212, 0.918) 0.0034*
Verla 7.2 (1.48)
Adjusted mean difference, 95% CI and p-value are based on an ANOVA model with study product, sequence, period and subject within sequence as considered effects. Statistical significance at a level of 5% is given if the 95% confidence interval of the adjusted mean difference does not include 0, respectively if the p-value is <0.05. Statistical significance is denoted by an asterisk (*)
CIconfidence interval,SDstandard deviation; BiolectraBiolectra® Magnesium 300 mg Kapseln;VerlaMagnesium Verla® purKaps a
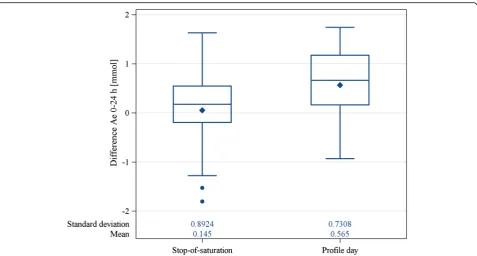
Fig. 2Difference in Ae 0-24hof magnesium on stop-of-saturation days and on profile days. The difference in Ae 0-24hof magnesium is significantly
higher on profile days than on stop-of-saturation days. Stop-of-saturation: The difference in Ae 0-24hof magnesium between both stop-of-saturation
days (i.e., Ae 0-24hbefore the administration ofMagnesium Verla® purKapsminus Ae 0-24hbefore the administration ofBiolectra® Magnesium 300 mg
Kapseln);Profile day: The difference in Ae 0-24hof magnesium between both profile days (i.e., Ae 0-24hafter administration ofMagnesium Verla® purKaps
minus Ae 0-24hafter administration ofBiolectra® Magnesium 300 mg Kapseln);Biolectra =Biolectra® Magnesium 300 mg Kapseln;Verla= Magnesium Verla®
purKaps.The bottom and top edges of the box indicate the intra-quartile range (IQR), i.e., the range of values between the first and third quartiles (the 25th and 75th percentiles). The diamond inside the box indicates the mean value, whereas the horizontal line represents the median value. The whiskers are drawn from the box to the most extreme point that is less than or equal to 1.5 times the IQR. Values outside of this range are displayed as closed circles
Table 2Analysis of magnesium concentration in monocytes and lymphocytes (in mg/L) and in erythrocytes (in mmol/L)
Parameter Time point Study product Mean (SD) ANOVA
Adj. mean difference 95% CI p-value
Mg in monocytes and lymphocytes predose Biolectra 0.11 (0.034) 0.013 (−0.004, 0.030) 0.1235
Verla 0.12 (0.043)
9 h Biolectra 0.12 (0.034) −0.005 (−0.012, 0.002) 0.1614
Verla 0.11 (0.040)
24 h Biolectra 0.11 (0.029) −0.007 (−0.018, 0.005) 0.2424
Verla 0.11 (0.023)
Mg in erythrocytes Predose Biolectra 2.27 (0.400) −0.022 (−0.233, 0.189) 0.8294
Verla 2.24 (0.439)
9 h Biolectra 2.09 (0.287) −0.001 (−0.116, 0.113) 0.9784
Verla 2.09 (0.269)
24 h Biolectra 2.10 (0.353) 0.028 (−0.106, 0.162) 0.6655
Verla 2.13 (0.318)
Fig. 3Mean (SEM) magnesium concentration at different time points in monocytes and lymphocytes. Biolectra =Biolectra® Magnesium 300 mg Kapseln;Verla= Magnesium Verla® purKaps.The standard error of the mean (SEM) is depicted by bars
measured before administration ofMagnesium Verla® pur-Kapswith 0.87 (0.042) mmol/L (please refer to Table 3).
The ANOVA with log-transformed data (log-ANOVA) indicated a similar baseline between groups, with an adjusted mean ratio of magnesium in serum of 1.00 (95% CI ranged from 0.98 to 1.01;p= 0.5169) at pre-dose.
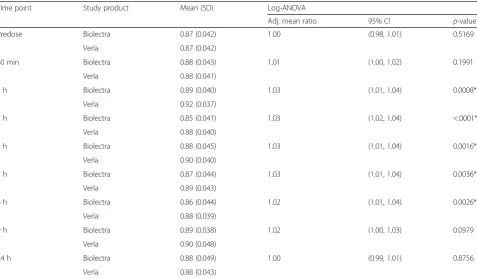
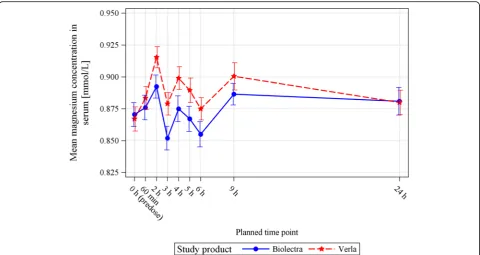
Starting from 2 h post dose, the mean magnesium concentration in serum was higher for Magnesium Verla® purKaps than for Biolectra® Magnesium 300 mg Kapseln until 24 h after dosing when serum magnesium concentrations for both products returned to the pre-dose value (Fig. 5).
As the Kolmogorov-Smirnov normality test showed that the data were not normally distributed at the time points of 2 and 4 h after administration of magnesium, the data used for the ANOVA were log-transformed (log-ANOVA). For the time points 2, 3, 4, 5 and 6 h after administration, the log-ANOVA to compare serum magnesium concentrations resulted in adjusted mean ra-tios, which were statistically significant at the 5% level, showing superior magnesium absorption forMagnesium Verla® purKaps (please refer to Table 3). Point estimates were 1.03 for 2 h post dose (95% CI of 1.01 to 1.04; p= 0.0008), 1.03 for 3 h post dose (95% CI of 1.02 to 1.04; p< .0001), 1.03 for 4 h post dose (95% CI of 1.01 to 1.04; p= 0.0016), 1.03 for 5 h post dose
(95% CI of 1.01 to 1.04; p= 0.0036), and 1.02 for 6 h post dose (95% CI of 1.01 to 1.04; p= 0.0026).
No statistical significance was shown for the time points 60 min, 9 h and 24 h after administration. Point estimates of adjusted mean ratios were 1.01 for 60 min post dose (95% CI of 1.00 to 1.02; p= 0.1991), 1.02 for 9 h (95% CI of 1.00 to 1.03; p= 0.0979), and 1.00 for 24 h post dose (95% CI of 0.99 to 1.01;p= 0.8756).
Discussion
The aim of this study was to investigate the bioavailabil-ity of Mg citrate, an organic Mg compound, and Mg oxide, an inorganic Mg compound after single-dose ad-ministration following Mg saturation.
Validity of the study design, based on the measure-ment of the renally excreted amount of magnesium, was shown by reproducible baseline Mg excretion after sat-uration in either study product sequence, thus underlin-ing the reliability of the study results.
After administration, the primary parameter Ae 0-24h of magnesium was higher for Mg citrate than for Mg oxide. The comparison of Ae 0-24h for both products by ANOVA showed an adjusted mean difference that was statistically significant, demonstrating that the organic Mg compound Mg citrate of the test product Magne-sium Verla® purKaps was superior to the inorganic Mg
Table 3Analysis of serum magnesium concentration (in mmol/L)
Time point Study product Mean (SD) Log-ANOVA
Adj. mean ratio 95% CI p-value
Predose Biolectra 0.87 (0.042) 1.00 (0.98, 1.01) 0.5169
Verla 0.87 (0.042)
60 min Biolectra 0.88 (0.043) 1.01 (1.00, 1.02) 0.1991
Verla 0.88 (0.041)
2 h Biolectra 0.89 (0.040) 1.03 (1.01, 1.04) 0.0008*
Verla 0.92 (0.037)
3 h Biolectra 0.85 (0.041) 1.03 (1.02, 1.04) <.0001*
Verla 0.88 (0.040)
4 h Biolectra 0.88 (0.045) 1.03 (1.01, 1.04) 0.0016*
Verla 0.90 (0.040)
5 h Biolectra 0.87 (0.044) 1.03 (1.01, 1.04) 0.0036*
Verla 0.89 (0.043)
6 h Biolectra 0.86 (0.044) 1.02 (1.01, 1.04) 0.0026*
Verla 0.88 (0.039)
9 h Biolectra 0.89 (0.038) 1.02 (1.00, 1.03) 0.0979
Verla 0.90 (0.048)
24 h Biolectra 0.88 (0.049) 1.00 (0.99, 1.01) 0.8756
Verla 0.88 (0.043)
compound Mg oxide of the reference productBiolectra® Magnesium 300 mg Kapseln in terms of bioavailability. This result is confirmed by serum Mg concentrations which were statistically significantly higher for Magne-sium Verla® purKapsat the time points 2, 3, 4, 5 and 6 h after administration, showing superior Mg absorption.
No statistically significant difference between Mg citrate and Mg oxide was shown when comparing intracellular magnesium concentrations (in monocytes and lympho-cytes or erythrolympho-cytes). The determination of intracellular Mg concentrations may possibly not be a suitable model for the assessment and quantification of a quick wash-in of this mineral nutrient in form of a single-dose admin-istration. The reliability of intracellular Mg concentra-tions after long-term Mg supplementation remains to be established.
Since the homeostatic regulation of serum Mg is extra-ordinarily effective, the absorbed Mg disappears very quickly from the circulation; i.e., the absorbed Mg is dis-tributed into body stores and excreted renally (in this case, after saturation of the body stores, the absorbed magnesium will not be stored, but excreted renally). Therefore, it is commonly assumed that changes of serum Mg concentration after a single oral magnesium dose are difficult to measure [15].
To date, two studies have directly compared the bio-availability of Mg citrate and Mg oxide preparations of similar elemental Mg content [11, 14]. Although Walker et al. [14] showed that the administration of a single
dose of Mg citrate led to significantly higher serum Mg concentrations when compared to Mg oxide, they could not report a statistically significant difference in bioavail-ability between both magnesium preparations when comparing renally excreted magnesium after single-dose administration.
The present study provides more consistent results concerning the bioavailability of both Mg compounds. This might be due to the systematic Mg saturation of the study subjects’ Mg-pools before single-dose Mg ad-ministration and the standardization of their dietary Mg intake. Both of these measures were not taken in the study by Walker et al. [14] which could explain the dis-crepancies in the results.
The present study confirms the results of Lindberg et al. [11], who also found a higher Mg elimination, and hence better absorption after supplementation with Mg citrate compared to Mg oxide.
The present results further support the general scien-tific opinion that the inorganic Mg compound Mg oxide is not as easily absorbable as organic Mg compounds [24]. Several studies showed that organic Mg com-pounds, such as Mg aspartate-hydrochloride or Mg lac-tate, generally have a higher bioavailability than Mg oxide [12, 13]. Therefore, the supplementation with Mg citrate, similar to other organic magnesium compounds, may be more suitable to achieve an optimal dietary mag-nesium intake in comparison to the supplementation with Mg oxide.
Although the present study was conducted exclusively in male Caucasian subjects, the results are transferable to females. To date, no scientific evidence indicates that the intestinal Mg absorption differs between the sexes. It has been shown, however, that estrogen influences Mg distribution and excretion [20]. Since the concentration and fluctuation of this hormone is higher in females, only male subjects were included in this study to standardize the measurement of the renally eliminated magnesium quantity which served as an indirect meas-ure of Mg absorption and therefore bioavailability.
Conclusions
In summary, the present study confirms former study results showing a higher bioavailability of the organic Mg compound Mg citrate over the inorganic Mg com-pound Mg oxide. It can be concluded that Mg citrate, similar to other organic Mg compounds, may be more suitable than Mg oxide to optimize the dietary magne-sium intake which, if too low, is associated with an in-creased risk for the development of several disorders.
Additional files
Additional file 1: Table S1.Key demographic characteristics by study product sequence and overall. (DOCX 47 kb)
Additional file 2: Figure S1.Amount of renally eliminated magnesium (Ae 0-24h) in mmol by study product. (DOCX 151 kb)
Abbreviations
ANOVA:Analysis of variance; Ar: Argon; BMI: Body mass index; CI: Confidence interval; ECG: Electrocardiogram; EDTA: Ethylenediaminetetraacetic acid; Hct: Hematocrit; HNO3: Nitric acid; ICP-OES: Inductively coupled plasma
optical emission spectrometry; IQR: Intra-quartile range; IRMM: Institute for Reference Materials and Measurements; IUPAC: International Union of Pure and Applied Chemistry; log-ANOVA: ANOVA with log-transformed data; MGA: Magnesium concentration in serum; MGER: Magnesium concentration in erythrocytes; MGV: Magnesium concentration in whole blood; P1: Profile day 1; P2: Profile day 2; PBS: Phosphate buffered saline; RF: Radio frequency; S1: Stop-of-saturation day 1; S2: Stop-of saturation day 2; SD: Standard deviation; SEM: Standard error of the mean
Acknowledgements
Not applicable.
Funding
Verla-Pharm Arzneimittel GmbH & Co. KG, Germany funded this study.
Availability of data and materials
The datasets generated and analyzed during the current study are not publicly available at the moment as it is planned to submit other research work based on this data in the future. Interested parties may contact the corresponding author for additional information. The data supporting the conclusions of this article are reported in the manuscript and in the Additional files 1 and 2.
Authors’contributions
DK and WT designed the study; DK, WT and IH conducted the study; BM analyzed the urine and cellular samples; JH performed the statistical analysis; DK, WT, JH, IH, CH and NN contributed to the data interpretation. NN drafted the manuscript. All authors read, revised and approved the manuscript.
Competing interests
The funding sponsor was involved in the design of the study, but not in the collection, analyses, or interpretation of data; Verla-Pharm Arzneimittel GmbH & Co. KG, Germany decided to publish the results, but was not involved in the writing of the manuscript. The authors declare no competing interests.
Consent for publication
Not applicable.
Ethics approval and consent to participate
This study was approved by the Ethics Committee of the Bavarian Medical Association on April 27, 2015 (Ethics Committee Reference No.: 15030). Study subjects were recruited via internet advertisement. They were given oral and written information about the aims and procedures of the study and written informed consent was obtained from them.
Author details 1
Inamed GmbH, 82131 Gauting, Germany.2Staburo GmbH, 81549 Munich, Germany.3Helmholtz Zentrum Muenchen, German Research Center for Environmental Health, Research Unit Analytical BioGeoChemistry, 85764 Neuherberg, Germany.
Received: 30 June 2016 Accepted: 14 December 2016
References
1. de Baaij JHF, Hoenderop JGJ, Bindels RJM. Magnesium in man: implications for health and disease. Physiol Rev. 2015;95:1–46.
2. Sabatier M, Arnaud MJ, Kastenmayer P, Rytz A, Barclay DV. Meal effect on magnesium bioavailability from mineral water in healthy women. Am. J Clin Nutr. 2002;75:65–71.
3. Abraham GE, Lubran MM. Serum and red cell magnesium levels in patients with premenstrual tension. Am J Clin Nutr. 1981;34:2364–6.
4. Rude RK, Singer FR. Magnesium deficiency and excess. Annu Rev Med. 1981; 32:245–59.
5. Stendig-Lindberg G, Harsat A, Graff E. Magnesium content of mononuclear cells, erythrocytes and 24-hour urine in carefully screened apparently healthy Israelis. Eur J Clin Chem Clin Biochem. 1991;29:833–6. 6. Johnson S. The multifaceted and widespread pathology of magnesium
deficiency. Med Hypotheses. 2001;56:163–70.
7. Dong J-Y, Xun P, He K, Qin L-Q. Magnesium intake and risk of type 2 diabetes: meta-analysis of prospective cohort studies. Diabetes Care. 2011; 34:2116–22.
8. Bøhmer T, Røseth A, Holm H, Weberg-Teigen S, Wahl L. Bioavailability of oral magnesium supplementation in female students evaluated from elimination of magnesium in 24-hour urine. Magnes Trace Elem. 1990;9: 272–8.
9. Gegenheimer L, Koegler H, Ehret S, Luecker PW. Bioaequivalenz von Magnesium aus Kautabletten und Granulat. Magnes Bull. 1994;16:6–8. 10. Schuette SA, Lashner BA, Janghorbani M. Bioavailability of magnesium
diglycinate vs magnesium oxide in patients with ileal resection. JPEN J Parenter Enteral Nutr. 1994;18:430–5.
11. Lindberg JS, Zobitz MM, Poindexter JR, Pak CY. Magnesium bioavailability from magnesium citrate and magnesium oxide. J Am Coll Nutr. 1990;9:48–55. 12. Firoz M, Graber M. Bioavailability of US commercial magnesium
preparations. Magnes Res. 2001;14:257–62.
13. Muehlbauer B, Schwenk M, Coram WM, Antonin KH, Etienne P, Bieck PR, et al. Magnesium-L-aspartate-HCl and magnesium-oxide: bioavailability in healthy volunteers. Eur J Clin Pharmacol. 1991;40:437–8.
14. Walker AF, Marakis G, Christie S, Byng M. Mg citrate found more bioavailable than other Mg preparations in a randomised, double-blind study. Magnes Res. 2003;16:183–91.
15. Kuhn I, Jost V, Wieckhorst G, Theiss U, Luecker PW. Renal elimination of magnesium as a parameter of bioavailability of oral magnesium therapy. Methods Find Exp Clin Pharmacol. 1992;14:269–72.
16. Luecker PW, Wetzelsberger N, Guernzig G, Witzmann HK. Determination of the therapeutic utilization of magnesium and potassium based on renal elimination. Magnesium. 1983;2:144–55.
18. Peerenboom H, Keck E. Die Bedeutung des Magnesiums in der Medizin. MMW Munch Med Wochenschr. 1980;122:1325–7.
19. Schlebusch H, Pietrzik K, Gilles-Schmoegner G, Zien A. Bioverfuegbarkeit von Magnesium als Magnesiumorotat und Magnesiumhydroxidkarbonat. Med Welt. 1992;43:523–8.
20. Seelig MS. Interrelationship of magnesium and estrogen in cardiovascular and bone disorders, eclampsia, migraine and premenstrual syndrome. J Am Coll Nutr. 1993;12:442–58.
21. Toelg G. Extreme trace analysis of the elements—the state of the art today and tomorrow. Plenary lecture. Analyst. R Soc Chem. 1987;112:365–76. 22. Schramel P. Atomic emission spectrometry. In: Herber R, Stoeppler M, editors. Trace Elem. Anal. Biol. Specimens. Amsterdam: Elsevier Science; 1994. p. 91–128.
23. Menditto A, Patriarca M, Magnusson B. Understanding the meaning of accuracy, trueness and precision. Accredit Qual Assur. 2006;12:45–7. 24. Rylander R. Bioavailability of Magnesium Salts–A Review. J Pharm Nutr Sci.
2014;4:57–9.
• We accept pre-submission inquiries
• Our selector tool helps you to find the most relevant journal • We provide round the clock customer support
• Convenient online submission • Thorough peer review
• Inclusion in PubMed and all major indexing services • Maximum visibility for your research
Submit your manuscript at www.biomedcentral.com/submit