R E S E A R C H
Open Access
Gene expression in the brain of a migratory
songbird during breeding and migration
John Boss
1,2, Miriam Liedvogel
3,6, Max Lundberg
3, Peter Olsson
4, Nils Reischke
3, Sara Naurin
3, Susanne Åkesson
5,
Dennis Hasselquist
3, Anthony Wright
1, Mats Grahn
1and Staffan Bensch
3*Abstract
Background:We still have limited knowledge about the underlying genetic mechanisms that enable migrating
species of birds to navigate the globe. Here we make an attempt to get insight into the genetic architecture controlling this complex innate behaviour. We contrast the gene expression profiles of two closely related songbird subspecies with divergent migratory phenotypes. In addition to comparing differences in migratory strategy we include a temporal component and contrast patterns between breeding adults and autumn migrating juvenile birds of both subspecies. The two willow warbler subspecies, Phylloscopus trochilus trochilus and P. t. acredula, are remarkably similar both in phenotype and genotype and have a narrow contact zone in central Scandinavia. Here we used a microarray gene chip representing 23,136 expressed sequence tags (ESTs) from the zebra finchTaeniopygia guttata to identify mRNA level differences in willow warbler brain tissue in relation to subspecies and season.
Results: Out of the 22,109 EST probe sets that remained after filtering poorly binding probes, we found 11,898 (51.8 %) probe sets that could be reliably and uniquely matched to a total of 6,758 orthologous zebra finch genes. The two subspecies showed very similar levels of gene expression with less than 0.1 % of the probe sets being significantly differentially expressed. In contrast, 3,045 (13.8 %) probe sets were found to be differently regulated between samples collected from breeding adults and autumn migrating juvenile birds. The genes found to be differentially expressed between seasons appeared to be enriched for functional roles in neuronal firing and neuronal synapse formation.
Conclusions:Our results show that only few genes are differentially expressed between the subspecies. This suggests that the different migration strategies of the subspecies might be governed by few genes, or that the expression patterns of those genes are time-structured or tissue-specific in ways, which our approach fails to uncover. Our findings will be useful in the planning of new experiments designed to unravel the genes involved in the migratory program of birds.
Keywords:Migration, Microarray, Birds, Gene expression, Behavior, Calcium transport, Synapse, Phylloscopus trochilus
Background
Bird migration is a complex behavior that involves a suite of traits evolved to optimize the movements be-tween areas for reproduction, staging and winter survival [1]. Therefore, the combined behavioral, morphological and physiological traits associated with flight and naviga-tion are characterized as migranaviga-tion phenotypes [2]. Comparative analyses of migratory and sedentary popu-lations within passerine bird species, or between closely
related species that differ in their migratory behaviors, have demonstrated strikingly parallel patterns of adap-tive evolution on the phenotype level [3, 4]. The co-ordination of a set of complex behavioral adaptations has been referred to as ‘behavioral syndrome’ [5], a concept that has been used to discuss the evolution of migration [6, 7].
Quantitative genetic approaches have demonstrated heritable variation and strong selection for several key components of the migratory phenotype, such as migra-tory propensity, timing, distance and migramigra-tory orienta-tion in birds [8, 9], migratory propensity in fish [10] and wing morphology in insects [11] and birds [12, 13]. In * Correspondence:[email protected]
3Department of Biology, Molecular Ecology and Evolution Laboratory, Lund
University, Ecology Building, SE-22362 Lund, Sweden
Full list of author information is available at the end of the article
many species of long distance migratory songbirds, the core components of migration (timing, distance and dir-ection) likely have a genetic basis since juveniles typically migrate on their own without influence of experienced adults [1]. Hence, we may expect differentially migrating bird populations to differ in genes encoding for several adaptations directly or indirectly linked to modulation of the migratory phenotype.
Whereas quantitative genetic studies demonstrate the presence or absence of within-species genetic variation associated with migratory traits, they do not provide data required for testing whether the same or different genes are involved in the migratory phenotypes of differ-ent species [14]. The work of iddiffer-entifying the genes that influence the behavioral adaptations associated with mi-gration is still in its infancy and among the so far pro-posed candidates there is none that has consistently shown to be influencing migratory traits across species. The most extensive study comparing differential expres-sion patterns between phenotypes used microarray analyses of monarch butterflies Danaus plexippus to compare summer and migratory phenotypes. This study identified 40 differentially expressed genes between sea-sons using brain tissue [15]. Two genes of particular interest were the clock gene vrille and the locomotion-relevant TβH (tyramine beta hydroxylase) gene as their presumed functions directly link to migratory compo-nents (timing and movement respectively). A recent genome re-sequencing study of monarch butterflies identified a gene (collagen IV) influencing flight muscle functioning with the migratory alleles resulting in im-proved flight efficiency [16]. One study on European blackcapsSylvia atricapilla[17] analyzed six genes with functions suggesting potential association to the migratory program. A microsatellite polymorphism in the 3′-UTR of the gene encoding Adenylate Cyclase Activating Polypep-tide 1 (ADCYAP1) was found to explain a small but significant proportion of migratory restlessness within populations, as well as variation in migratory distance across populations [17].
In Northern Europe, two geographically separated sub-species of the willow warbler (Phylloscopus trochilus) have been used extensively to study differential migra-tion behavior with regard to migramigra-tion direcmigra-tion and wintering locations in Africa [18–20]. The subspeciesP. t. trochilus, breeding in southern Scandinavia, Britain and western parts of Central Europe, migrates towards the south-west in autumn to wintering grounds in West Africa. In contrast, the subspecies P. t. acredula, breeds in northern Scandinavia, Finland and Russia, migrates south-south-east to eastern and southern Africa [18–21]. Whereas the contact zone between the two species east of the Baltic Sea is complex, with different positions of cline centres and cline widths for size, coloration and
migration strategy, they form a well-defined and 200 km wide contact zone in central Scandinavia [21, 22]. The subspecies are inseparable with regard to neutral genetic markers (e.g., mitochondrial DNA, microsatellites and AFLPs; [21]) and breeding habitat [23] suggesting that the few divergent genomic regions are maintained by se-lection associated with their different migration pheno-types [24].
To identify molecular components of the brain that are potentially involved in migration direction behaviour, we used a microarray chip designed from expressed se-quence tags (ESTs) in brain tissue of zebra finches [25] to compare genome-wide expression of mRNA tran-scripts in brain tissue collected from two willow warbler subspecies with different migratory strategies during two crucial life history stages, i.e. breeding in adults as well as the early phase of migration in juvenile birds. Our ra-tional behind choosing the brain as the target for the analyses is because it is the tissue where migration-related decision-making gets integrated. We decided to use the whole brains rather than separate regions because we are lacking precise information and charac-terisation of focal brain regions that process migration-related decision making genes. Based on the low degree of genetic differentiation between the subspecies [21, 24] and the different challenges the birds are facing during breeding and migration, we expect to find more differ-ence in gene expression when comparing breeding and autumn samples within the subspecies than when com-paring the subspecies within seasons. If genes involved in migration-direction decision-making are included in our microarray chip, we expected these to be differen-tially expressed when comparing the autumn samples of the two subspecies. However, given the lack of know-ledge as to whether expression of such genes is re-stricted to the migration period, we included the overall contrast between the subspecies (within seasons) in our analysis.
Methods
Fieldwork and sample collection
site in southern Sweden (8 birds collected, Krankesjön, 15–16 August 2008) and one site in northern Sweden (8 birds collected, Skeppshamn, 62°23′N, 17°44′E, 19 August 2008). We chose to sample inexperienced juvenile birds on their first migration because they typically account for >95 % of willow warblers captured in mist-nets dur-ing autumn migration, and importantly, their migratory programme is purely inherited and does not yet include a learning component. The autumn capture site for P. t. acredulais slightly south of the centre of the hybrid zone (Fig. 1). At this date (19 August) the captured birds are ex-pected to origin from further north in Scandinavia (well within the range ofP. t. acredula), whereas locally hatched birds should already be further south on their move to the wintering grounds. At each site, we captured more birds than we collected for the microarray experiment. We se-lected the birds for collection based on the following cri-teria: (i) 2 cy + males should have been netted within 1 min after starting tape recorder play-back of song, (ii)
tissues collected within 5 min after the bird was removed from the net, (iii) 1 cy males should have completed their post-juvenile moult, i.e. being at least 60 days old [26] and (iv) carrying at least a moderate fat load (score≥3; [27]). All birds were collected between 6–12 am. Birds were sacrificed by decapitation and the entire brain was imme-diately transferred into a tube containing RNAlater™RNA stabilization Reagent (Qiagen). Samples were kept in the field for up to one week and then at−80 °C prior to RNA extraction.
RNA preparation and analysis
Nine months post collection of the samples (May and June 2009) brains were removed from the RNAlater buf-fer and homogenized in 1 ml QIA-zol Lysis Reagent per 100 mg tissue (Qiagen) using a TissueLyser (Qiagen). The samples were processed in batches of four indi-viduals (one from each group) using the RNeasy Lipid Tissue Mini Kit (Qiagen) according to the manufac-turer’s instructions. Samples were quality-controlled by electrophoresis on formaldehyde agarose gels and confirmed to have an acceptable 260 nm/280 nm ab-sorption ratio (all values between 1.95 and 2.05) using an Ultraspec 3000 spectrophotometer (Pharmacia).
For this project, we had 29 Lund-zf2 microarray chips available and therefore RNA samples with the highest RNA Integrity Numbers [28] were selected (8 samples from each group except forP. t. acredulain autumn for which only 5 samples passed the RNA quality criteria). The Lund-zf2 array is a custom Affymetrix array with probe sets representing 23,136 zebra finch ESTs expressed in brain tissue. Each EST probe set is repre-sented by eleven 25 bases long oligonucleotides (probes) and together the probe sets represent about 15,800 non-redundant gene models, for details see [25]. The micro-arrays were hybridized and analyzed at the Swegene Center for Integrative Biology at Lund University (SCIBLU genomics, http://www.lth.se/sciblu) using stand-ard procedures (for details, see [29]). Across-species array hybridization is challenging as it may result in measured expression differences that are methodological artefacts that needs to be controlled for. Sequence mismatches be-tween the probe and the target may for example under-estimate the expression level. We have taken several measures to minimize such biases: First, all probes that had failed to hybridize against genomic DNA from willow warblers were removed [25], see details below. Second, this microarray chip has previously been thoroughly eval-uated for across-species hybridization in the common whitethroatSylvia communis[28–30], a species positioned at the same phylogenetic distance to the zebra finch as the willow warbler. In these studies, the patterns of sex-biased gene expression were very similar for the zebra finch (within-species array hybridization) and the whitethroat Fig. 1Locations of willow warbler sampling sites in Sweden. The
(across-species array hybridization), both regarding the specific genes found being differentially regulated between the sexes and the magnitude of sex-biased expression.
Data analysis
All the birds were sexed by standard molecular methods [31] and the collected wings of the birds captured during the autumn were carefully checked to confirm that they had been correctly aged [32]. Of the 29 analyzed samples (P. t. trochilus, 8 summer and 8 autumn; P. t. acredula, 5 summer and 8 autumn) we excluded two samples from the autumn birds (one from each subspecies) that were subsequently shown not to be juvenile males (one juvenile female and one adult male). All statistical ana-lyses of the microarray dataset were carried out using R version 2.15.1 (R Core Development Team 2012). Qual-ity of the array results was evaluated using the affyPLM package. A background correction for each probe was performed using the robust multi-array average (RMA) method as implemented in the affy package. Subse-quently, the probe signals were normalized using RMA normalization. We evaluated the normalizations by inspecting the MA, NUSE and RLE plots before and after RMA normalization. The expression data was fur-ther evaluated by hierarchical clustering (average clus-tering method using Euclidean distances), and principal component analysis to identify possible outlier arrays (data not shown). One array (from a breedingacredula
male) was marked as an outlier and was therefore re-moved from the subsequent analyses. Data from the remaining 26 arrays was re-normalized followed by a new round of quality control. Consequently, our re-ported analyses were carried out on data from eight breeding P.t. trochilus males, four breeding P. t. acre-dula males, seven migrating P. t. trochilus males, and seven migratingP. t. acredulamales.
Since low probe hybridization signals can result not only from a low gene expression level but also from a poor sequence match of willow warbler transcripts to the probes designed from zebra finch ESTs, we made use of a previous genomic DNA hybridization data using the Lund-zf array [25] to determine cut-off pa-rameters. This experiment contained data for two ar-rays each of which had been hybridized with pooled DNA from eightP. t. trochilus and eightP. t. acredula
birds, respectively. Probes that had a signal at least two standard deviations above the mean background ex-pression level on at least one of these arrays were flagged as present (i.e., the willow warbler sequence matches the zebra finch probe), while probes yielding signals below two standard deviations were flagged as absent (i.e. poor cross-species sequence match). Out of the 23,139 probe sets on the zf-2 array, 1,030 (4.4 %)
had less than eight functional probes (Affymetrix stand-ard cut-off; [25]) after subtraction of poorly matching probes and were excluded from the downstream ana-lyses (Additional file 1: Figure S1). For the remaining 22,109 probe sets, confirmed to show significant hybridization signals to willow warbler DNA, we calcu-lated the mean intensities for probes in each probe set as estimates of gene expression levels.
Probe sets were linked to genes using blastn 2.2.24+ in the toolset of NCBIs standalone blast (http://blast.ncbi.nlm.-nih.gov/Blast.cgi?CMD=Web&PAGE_TYPE=BlastNews#1). The database (zebra finch gene set version 3.2.4) was downloaded from Ensembl (www.ensembl.org) using the biomart tool and included 18,581 annotated genes together with potentially uncharacterized untranslated region 1,000 bp up- and downstream of the first and last exons, respectively. Flanking sequences were in-cluded to allow identification of EST sequences corre-sponding to untranslated regions of gene transcripts. These blast results were then evaluated using an in-house Python script (supplementary file) in order to re-move probes with more than one possible hit (second hit within an e-value range of 103 of the first) and alignments shorter than 50 bp. The four sample groups were compared in order to identify gene ex-pression differences associated with the effects of sea-son and subspecies. Two additional comparisea-sons were made by combining sample groups according to sub-species or season. To avoid artefacts associated with identification of false positives due to multiple testing (i.e. erroneously rejecting the null hypothesis of no difference between groups) we used the false discov-ery rate correction (FDR) with a statistical cut-off value of 5 % [33].
Results
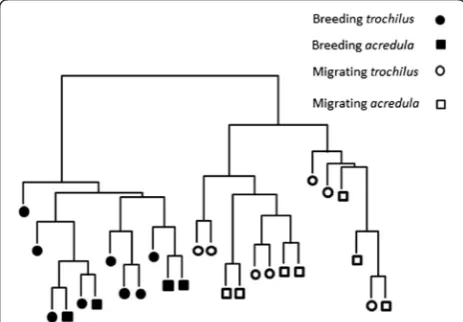
We successfully matched 11,898 EST probe sets (51.8 % of the original 22,109 represented on the microarray) to a total of 6,758 annotated zebra finch genes. A cluster dendrogram was created from the probe sets to determine how overall gene expression patterns differ between the willow warbler samples and to describe their hierarchical relationships (Fig. 2, Additional file 1: Figure S2). Gene expression differences associated with seasonal sampling time (summer/ adult breeding versus autumn/juvenile migration) dominated the clustering result and allowed to perfectly separate the birds. Within both seasonal clusters, there was no clear grouping of the samples according to overall RNA pat-terns associated with the different subspecies (i.e. migra-tory strategy). We conclude that the main difference in RNA levels between the samples was found between wil-low warblers collected during different seasons and that RNA expression differences distinguishing subspecies were substantially fewer.
Estimated number of differentially expressed genes In order to estimate the approximate number of genes that are differently expressed in birds from different seasons (breeding adults versus migrating juveniles) and between different subspecies, we plotted the distri-bution of raw p-values (testing the significance of gene expression differences) for the 22,109 probe-sets (Fig. 3). Both seasonal and subspecies comparisons hadp-value distributions that were highly skewed towards low values. Between summer and autumn, there were 6,054 probe sets with p-values < 0.05 compared to an ex-pected number of 1,105 (5 % of all probes) for a ran-dom distribution. For the subspecies comparison, 2,430 probe sets had a p-value < 0.05, fewer than for genes differing between seasons, but more than twice as many
as expected by chance. Although that this suggests that a substantial number of genes were differentially expressed in both comparisons, the lowest 5thpercentile are inflated by−20 % and−50 % false positives, respectively.
Gene expression differences between breeding adults and juvenile migrants
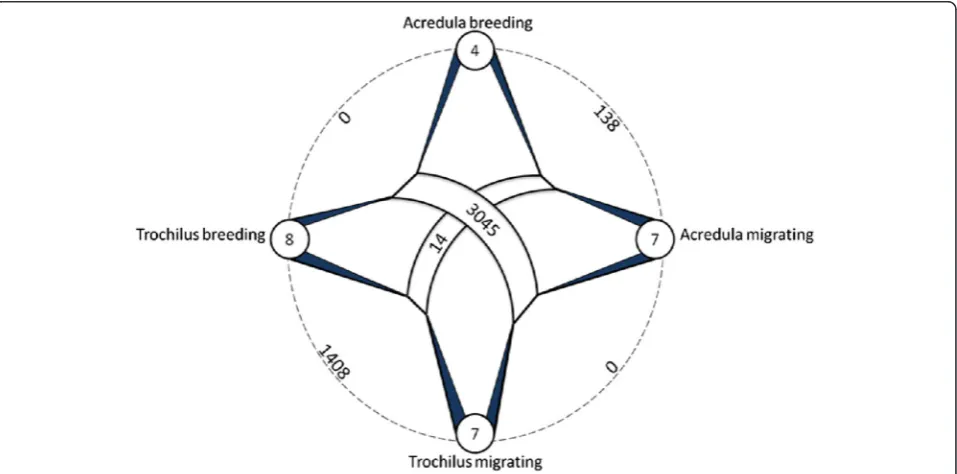
Within subspecies, the comparison between breeding adults and juvenile migrants on their first migratory journey identified 138 probe sets that were differently expressed (<5 % FDR) in P. t. acredulaand 1,408 probe sets in P. t. trochilus(<5 % FDR) (Fig. 4). An overlap of 73 probe sets was differentially expressed in both sub-species. The lower number of differentially expressed genes identified for P. t. acredula probably reflects the lower statistical power associated with the smaller num-ber of breeding birds analyzed for this subspecies (n= 4 inacredulavs.n= 8 introchilus).
Because the effect of subspecies was small in the over-all clustering of the samples (Fig. 2), we combined the data from both subspecies for each season to increase the statistical power of the comparison between seasons. In this combined analysis, we identified 3,045 probe sets that were differentially expressed between seasons (FDR adjusted p-value <0.05, 13.8 % of the total). Among the top 20 significant and annotated genes (Table 1) there are several genes associated with neurone functions such as Neurexin 1 beta involved in synapse formation [36], as well as Parvalbumin genes, which encode markers identifying a subclass of interneurons [37]. Among iden-tified genes not shown in Table 1 (Additional file 1: Table S1) were the two clock genes NAPS2 (FDR 0.006) and ADCYAP1 (FDR 0.002), of which ADCYAP1 has previously been reported to associate with migration tendency and migratory restlessness in blackcaps [17]. ADCYAP1 had 1.2-fold higher RNA levels in breeding compared to migrating willow warblers. The overall the proportion of up- and down-regulated genes between seasons was similar with about half (50.9 %) of the 3,045 differentially expressed probe sets showing higher RNA levels in autumn than in summer. However, the most dif-ferentially expressed genes tended to be more frequently up-regulated in autumn than in summer. This is shown by the percent of autumn up-regulated genes calculated for successive blocks of 100 genes (Additional file 1: Table S1); 77 % among the first block (1–100), 69 % (101–200), 62 % (201–300, 59 % (301–400) and 54 % (401–500).
Gene expression differences between subspecies
The overall clustering of the expression profiles (Fig. 2) showed that the difference in the number of differentially expressed genes between subspecies was small. In line with this, within-season comparisons of gene expression differences between the subspecies Fig. 2Hierarchical clustering of the array expression profiles for the
did not provide support for any differences between subspecies either in summer or in autumn (Fig. 4). In order to increase the power of the comparison, we compared probe data for all birds from each subspe-cies regardless of season. Expression data from 11 P. t. acredula birds were thus compared to data from 15
P. t. trochilus individuals. This comparison identified 14 differentially expressed probe sets (FDR adjusted
p-value <0.05, 0.6 % of the total) (Fig. 4). Including the interaction term subspecies x season only marginally changed the results (12 differentially expressed probe sets
of which 10 overlapped with the 14 detected without the interaction). Seven of the 14 significant genes did not have Ensembl annotations or were annotated as uncharacter-ized. Nonetheless, a significant and annotated gene of po-tential interest is the PPP3CA gene, which encodes a calcium-regulated (via Calmodulin) protein phosphatase. PPP3CA is the only gene that was shown to be signifi-cantly changed in comparisons of both the seasons and subspecies, perhaps due to a role of calcium-related nalling in both contexts. PPP3CA mRNA levels were sig-nificantly higher in migrating birds compared to breeding Fig. 3Distribution of raw p values between seasons (a) and between subspecies (b) of willow warblers. Note that the season contrast is between adult breeding and juvenile migrating birds
birds, and higher in the southern subspecies, P. t. trochi-lus,compared to the northern subspecies,P. t. acredula.
Differentially regulated genes are enriched in specific functional gene classes
We then performed a gene ontology analysis, in order to determine whether genes differentially regulated between
adult breeding and juvenile migrating birds were signifi-cantly enriched within particular categories of biological functions. The 1,640 differentially regulated and annotated genes between adult breeding and juvenile migrating birds were significantly enriched for “positive regulation of gene expression” (GO:0010628) and “calcium ion transport” (GO:0006816) after correction for multiple testing (Table 2).
Table 1Top list of the 20 annotated genes that differed most significantly between samples from breeding adult and juvenile
migrating male willow warblers
Ensembl gene ID Gene name Fold change FDR Description
ENSTGUG00000013386 ATP1A1 2.00 8.92E-09 ATPase, Na+/K+ transporting, alpha 1 polypeptide
ENSTGUG00000006383 NRSN1 −1.35 8.92E-09 neurensin 1
ENSTGUG00000010974 HIVEP2 1.61 8.92E-09 human immunodeficiency virus type I enhancer binding protein 2
ENSTGUG00000007668 FSCN1 1.51 1.11E-08 fascin actin-bundling protein 1
ENSTGUG00000001697 ARPP21 1.61 2.08E-07 cAMP-regulated phosphoprotein, 21 kDa
ENSTGUG00000005731 NRXN1 1.33 3.97E-07 neurexin 1
ENSTGUG00000013106 FAM49A 1.43 6.01E-07 family with sequence similarity 49, member A
ENSTGUG00000000314 CREBRF −1.74 6.65E-07 CREB3 regulatory factor
ENSTGUG00000005128 KIAA922 1.36 7.20E-07 KIAA0922
ENSTGUG00000009005 TEKT1 1.87 1.06E-06 tektin 1
ENSTGUG00000001522 COL1A2 2.32 1.42E-06 collagen, type I, alpha 2
ENSTGUG00000003383 BRINP3 1.37 1.98E-06 bone morphogenetic protein/retinoic acid inducible neural-specific 3
ENSTGUG00000002940 SRPK2 1.17 2.04E-06 SRSF protein kinase 2
ENSTGUG00000002420 C8G −1.61 2.04E-06 complement component 8, gamma polypeptide
ENSTGUG00000011663 PMP2 3.98 2.20E-06 peripheral myelin protein 2
ENSTGUG00000006231 NHLRC1 1.51 2.41E-06 NHL repeat containing E3 ubiquitin protein ligase 1
ENSTGUG00000012725 DCUN1D5 1.20 3.28E-06 DCN1, defective in cullin neddylation 1, domain containing 5
ENSTGUG00000003264 TLE4 1.27 3.80E-06 transducin-like enhancer of split 4
ENSTGUG00000012354 PLEKHA5 1.30 4.23E-06 pleckstrin homology domain containing, family A member 5
ENSTGUG00000010713 PVALB-2 −1.29 4.38E-06 Taeniopygia guttata parvalbumin-like
Gene name and descriptions are taken from the Ensembl database, probe sets without annotations were excluded. Positive fold change values indicate the gene is more expressed in migrating juveniles than in breeding adults, and vice versa for negative values. Thep-values are corrected for multiple testing using the Benjamini & Hochberg (FDR) correction
Table 2Lists of the ten most significant results from the gene ontology enrichment analyses between breeding adult and juvenile
migrating willow warblers
GO description AdjP-value Total Observed (Expected)
positive regulation of gene expression 0.0084 40 13 (3)
calcium ion transport 0.04 30 10 (2)
translation 0.15 117 21 (9)
calcium ion transmembrane transport 0.19 20 7 (2)
structural constituent of ribosome 0.28 95 17 (7)
ribosome 0.28 98 17 (8)
RNA polymerase II regulatory region sequence-specific DNA binding 0.28 4 3 (0)
protein serine/threonine kinase activity 0.28 159 3 (12)
protein domain specific binding 0.28 41 9 (3)
regulation of mRNA stability 0.28 5 3 (0)
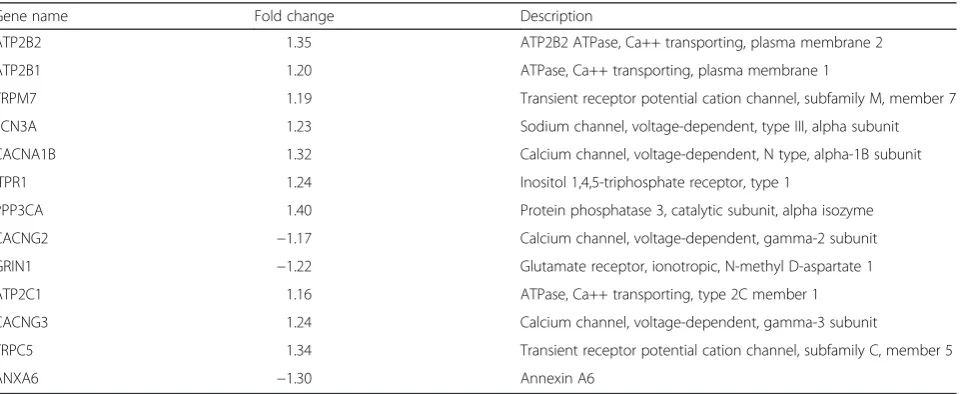
Thirteen of the significantly regulated annotated genes in the category “calcium ion transport” were directly involved in the formation and function of calcium channels (Table 3). Out of the 13 genes, 10 were up-regulated during migration (Table 3).
Discussion
The two closely related willow warbler subspecies with clearly different migratory strategy provide a good sys-tem to study changes in gene expression associated with migration. As expected, the overall gene expression dif-fered substantially between breeding adults and migrat-ing juveniles, whereas the differences between the subspecies were much smaller. This is in line with the general assumption that differences in the migratory phenotype, such as migratory direction, are likely gov-erned by a limited number of genes. This might also be due to the fact that the expressions of the genes involved in these processes are time-structured or tissue-specific in ways which our approach failed to uncover. The low level of differential gene expression between the sub-species is in line with previous studies examining sequence-based differences [21, 38]. In these analyses, the subspecies were inseparable based on mitochon-drial DNA, microsatellites and at >99 % of 500 investi-gated AFLP markers. Analyzes of sequence differences in the transcriptome [24] has confirmed the main absence of genomic divergence between the two subspecies of willow warblers, with the exception of three regions (each of a few Mbp) on the putative chromosomes 1, 3 and 5. How-ever as this data was based on pooled RNA samples in combination with a normalization procedure to equalize transcripts across the transcriptome [24], we could not
use it for evaluating expression differences between the subspecies.
Large gene expression differences between breeding adults and migrating juveniles
The highly skewed rawp-value distribution (Fig. 3a) sug-gested that the actual number of genes involved in sea-sonal or age dependent differences of expression is higher than those 3,045 determined using the Benjamini and Hochberg false discovery rate [33]. Our data suggest that as many as 22 % of EST probe sets (4,953 out of 22,109) may be differentially expressed between season or age classes. To correctly set the tradeoff between Type I and Type II errors is a well-known problem in all gene expression studies [39] and it has been suggested that well under 50 % of truly differently expressed genes fail detection even in well-powered studies [40]. Further-more, this number could also be an underestimation be-cause of the experimental setup where the whole brain was investigated. Differences in gene expression re-stricted to small regions of the brain might be swamped by mRNA levels from larger brain regions, or possibly due to upregulation in one region and down-regulation in others [41].
Many of the gene expression differences seen in this study are probably due to the physiological require-ments of different seasons and associated life history stages, but still there are alternative explanations that cannot be ruled out. For example, our sampling protocol does not allow discriminating between sea-son and age differences of the population. The ana-lyzed migrating male willow warblers were all in their first year (2–3 months old), while the breeding indi-viduals consisted of males that were one year or
Table 3Expression differences of genes included in the ontology term referred to as“calcium ion transport”
Gene name Fold change Description
ATP2B2 1.35 ATP2B2 ATPase, Ca++ transporting, plasma membrane 2
ATP2B1 1.20 ATPase, Ca++ transporting, plasma membrane 1
TRPM7 1.19 Transient receptor potential cation channel, subfamily M, member 7
SCN3A 1.23 Sodium channel, voltage-dependent, type III, alpha subunit
CACNA1B 1.32 Calcium channel, voltage-dependent, N type, alpha-1B subunit
ITPR1 1.24 Inositol 1,4,5-triphosphate receptor, type 1
PPP3CA 1.40 Protein phosphatase 3, catalytic subunit, alpha isozyme
CACNG2 −1.17 Calcium channel, voltage-dependent, gamma-2 subunit
GRIN1 −1.22 Glutamate receptor, ionotropic, N-methyl D-aspartate 1
ATP2C1 1.16 ATPase, Ca++ transporting, type 2C member 1
CACNG3 1.24 Calcium channel, voltage-dependent, gamma-3 subunit
TRPC5 1.34 Transient receptor potential cation channel, subfamily C, member 5
ANXA6 −1.30 Annexin A6
older. Thus, any putative age-dependent difference shaping the pattern will be picked up as season differ-ences in our experimental design.
Inspection of the 3,045 probe sets with the lowest
p-values (Table 1) reveals a high number of neuron and calcium flux related genes. Regulation of calcium concentrations have been linked to multiple functions within brain cells such as neuronal transmission, exci-tatory synapses, cell growth, proliferation and synaptic plasticity [42]. One of the significantly differentiating expressed gene, the adenylate cyclase activation poly-peptide 1 (ADCYAP1, Additional file 1: Table S1), has previously been associated with migration behavior. It has been shown that the length of the 3′ untranslated region (UTR) on ADCYAP1 alleles partly predicts mi-gratory restlessness within some bird species [17, 43]. Because we find ADCYAP1 mRNA levels to be lower during migration, our study suggests that ADCYAP1 expression might inhibit migratory restlessness. But since the breeding birds were adults and the migrat-ing birds were juveniles on their first migration we cannot disentangle the effects of season from any pu-tatively confounding age effect. The gene ADCYAP1 is highly conserved among birds and mammals, and en-codes the protein PACAP that together with its selective receptor PAC1 is integral to anxiety behavior and stress responses in the limbic system of the brain [44].
The gene ontology enrichment analysis identified the terms “positive regulation of gene expression” and“ cal-cium ion transport”as up-regulated in juvenile migrants compared to adult breeding willow warblers. The up-regulation of genes that increase gene expression agrees with our observed pattern the most differentially expressed genes being up-regulated in migrating juve-niles compared to breeding adults.
Our background set included all genes that we could identify as matching the array probes. Since the sample list contains predominantly brain-expressed genes while our background set contains both brain expressed and non-brain expressed genes, one concern might be that typical nervous-tissue related genes become significance just because our samples consisted of brain tissue. How-ever, we only found one of the possible brain-specific GO categories (calcium ion transport) as being signifi-cantly enriched; this would not be expected if we were just generally finding brain GO classes. Our data do not allow us to say why calcium ion transport is up-regulated in the brain during migration, but one po-tential explanation could involve the proliferation of neurons and creation of new synaptic connections needed during migration. Migration flights require the ability to use biological compasses and maps for navi-gation [2, 45–47], which are expected to be associated with high neuronal activity and a capacity to integrate
information from different sensory systems [48, 49]. Another possibility is that the biological processes dif-fering between the two seasons are mainly linked to the breeding period. For example, earlier studies sug-gest that genes involved in ion transport are repressed during singing behavior [48].
Small subspecies-dependent gene expression differences The rawp-value distribution suggests that up to around 1,300 probe sets (6 %) might potentially involve genes differentially expressed in both subspecies, even those that cannot be individually confirmed with statistical confidence. Only 14 genes (0.06 %) were statistically sup-ported (adjusted p< 0.05) to have differential expression between the two subspecies after adjusting for multiple testing. A study investigating subspecies differences be-tween the hooded crow [49], Corvus corone cornix and the carrion crow, Corvus corone corone, that mainly dif-fer in plumage color, found a much higher number of differentially expressed genes (106). Although no gene overlapped with this study, the cellular functions of neural regulation were differentially expressed in both studies.
The strongest supported probe set was similar to ad-enylate kinase isoenzyme 5 (AK5) which had a higher expression in P. t. trochilus than in P. t. acredula (FC 1.52). This protein is predicted to sense cellular energy levels [50]. Another significant gene is PPP3CA (higher expression in P. t. acredula than in P. t. trochilus; FC 1.90), which encodes the catalytic subunit of serine/ threonine-protein phosphatase (alpha isozyme), a cata-lytic subunit of the phosphatase calcineurin. PPP3CA was the only gene with significant expression change in both the seasonal (autumn > summer) and subspe-cies (P. t. trochilus>P. t. acredula) comparisons.
Differentially regulated genes involved in neuronal signaling
play important roles involved in the cognitive/behavioral differences that characterize birds in different seasons, age classes and/or different subspecies. Calcium signal-ing is involved both in neuron firsignal-ing and more long-term plasticity changes in neurons that fire repeatedly, leading to calcium-mediated signaling to the nucleus in cells in which calcium levels are elevated during longer times [51, 52]. Based on the present results, it will be possible to focus future studies on which calcium trans-porter subunits are differentially expressed in different brain regions. In such studies, markers for different clas-ses of neurons should also be studied. Measurements of mRNA levels in different brain regions should also be complemented by in situhybridization studies to deter-mine whether the differentially expressed genes are pre-dominantly expressed in neurons.
Conclusion
Our study suggests that relatively few genes are in-volved in shaping the phenotypic differences in migra-tory strategies between the willow warbler subspecies. However, our snapshot approach (one tissue, summer and autumn) cannot rule out that major differences in gene expression exist in other tissues or at other time points. For example, gene expression differences restricted to small regions of the brain would likely not be detected in analyses of total brain mRNA ex-tracts. Critical expression differences might also be timed to when the birds execute the directed flights, i.e. after sunset, whereas the samples we analyzed were collected in mornings. A tighter coupling of dif-ferential gene expression to migration direction choice will require development of experimental migration-related endpoints that can be measured in controlled experiments using birds in captivity where relevant cues (e.g. magnetic field, polarized light, direction of sun set) can be manipulated [53, 54]. Such studies should of course make use of the advancements in next generation sequencing technologies such as RNA-seq which will be more powerful to detect dif-ferences in gene expression than our microarray approach.
Additional file
Additional file 1:The distribution of positive probes per probe set is shown inFigure S1.The hierarchical clustering including the discarded samples is shown inFigure S2. Gene IDs, fold-change differences and FDRP-values for each of the 22,109 probe sets are available inTable S1. Microarray data are available in the ArrayExpress database (www.ebi.a-c.uk/arrayexpress) under accession number E-MTAB-4102. (ZIP 1810 kb)
Competing interests
The authors declare that they have no competing interests.
Authors’contributions
MG, AW and SB conceived the study. NR collected the brain samples. SN, SB and DH designed the microarray chip, and SN also supervised the preparation of the RNA samples. JB performed the annotation of probes, produced the comparisons analysis as well as the gene ontology. MLi analyzed the expression data. MLu assisted in the annotation procedure. PO handled initial data preparation and statistical analysis. JB wrote the manuscript together with MG, MLi, SB and AW. All authors gave feedback on the final manuscript. All authors read and approved the final manuscript.
Acknowledgements
The sample collection was performed with an ethical permission from Malmö/Lund Committee for Animal Experiment Ethics (no. M22-05). The study was funded by grants from the Swedish research council (SB: 621-2010-5277; SÅ: 621-2007-5930, 621-2010-5584; AW: K2013-66X-14027-10-3; DH: 621-2010-5399) and by The Foundation for Baltic and East European Studies (MG, AW). Support was received from the Centre for Animal Movement Research (CAnMove) financed by a Linnaeus grant (349-2007-8690) from the Swedish Research Council and Lund University.
Author details
1
Karolinska Institute, Department of Laboratory Medicine, Clinical Research Center, Karolinska University Hospital, SE-14186 Huddinge, Sweden.2School
of Natural Sciences, Technology and Environmental Studies, Södertörn University, SE-141 89 Huddinge, Sweden.3Department of Biology, Molecular
Ecology and Evolution Laboratory, Lund University, Ecology Building, SE-22362 Lund, Sweden.4Centre of Environmental and Climate Research,
Lund University, Ecology Building, SE-223 62 Lund, Sweden.5Department of Biology, Centre for Animal Movement Research, Lund University, Ecology Building, SE-22362 Lund, Sweden.6Max Planck Institute for Evolutionary Biology, AG Behavioural Genomics, August-Thienemann-Straße 2, 24306 Plön, Germany.
Received: 8 September 2015 Accepted: 28 January 2016
References
1. Alerstam T, Hedenström A, Åkesson S. Long-distance migration: evolution and determinants. Oikos. 2003;103:247–60.
2. Åkesson S, Hedenström A. How migrants get there: Migratory performance and orientation. Bioscience. 2007;57:123–33.
3. Forschler MI, Bairlein F. Morphological shifts of the external flight apparatus across the range of a passerine (Northern Wheatear) with diverging migratory behaviour. Plos One. 2011;6:9.
4. Pulido F. The genetics and evolution of avian migration. Bioscience. 2007;57: 165–74.
5. Sih A, Bell AM, Johnson JC, Ziemba RE. Behavioral syndromes: an integrative overview. Quart Rev Biol. 2004;79:241–77.
6. Piersma T, Pérez-Tris J, Mouritsen H, Bauchinger U, Bairlein F. Is there a “migratory syndrome”common to all migrant birds? Bird Hormones and Bird Migrations: Analyzing Hormones in Droppings and Egg Yolks and Assessing Adaptations in Long-Distance Migration. 2005;1046:282–93. 7. Dingle H. Animal migration: is there a common migratory syndrome?
J Ornithol. 2006;147:212–20.
8. Helbig AJ. Inheritance of migratory direction in a bird species - a cross-breeding experiment with SE-migrating and SW-migrating blackcaps (Sylvia-Atricapilla). Behav Ecol Sociobiol. 1991;28:9–12.
9. Pulido F, Berthold P, van Noordwijk AJ. Frequency of migrants and migratory activity are genetically correlated in a bird population: Evolutionary implications. Proc Natl Acad Sci USA. 1996;93:14642–7. 10. Paez DJ, Brisson-Bonenfant C, Rossignol O, Guderley HE, Bernatchez L,
Dodson JJ. Alternative developmental pathways and the propensity to migrate: a case study in the Atlantic salmon. J Evol Biol. 2011;24:245–55. 11. Roff DA, Tucker J, Stirling G, Fairbairn DJ. The evolution of threshold traits:
effects of selection on fecundity and correlated response in wing dimorphism in the sand cricket. J EvolBiol. 1999;12:535–46.
13. Tarka M, Åkesson M, Hasselquist D, Hansson B. Intralocus sexual conflict over wing length in a wild migratory bird. Am Nat. 2014;183:62–73. 14. Liedvogel M, Åkesson S, Bensch S. The genetics of migration on the move.
Trends Ecol Evol. 2011;26:561–9.
15. Zhu HS, Gegear RJ, Casselman A, Kanginakudru S, Reppert SM. Defining behavioral and molecular differences between summer and migratory monarch butterflies. BMC Biol. 2009;7. doi:10.1186/1741-7007-7-14. 16. Zhan S, Zhang W, Niitepold K, Hsu J, Haeger JF, Zalucki MP, et al. The
genetics of monarch butterfly migration and warning colouration. Nature. 2014;514:317–21.
17. Mueller JC, Pulido F, Kempenaers B. Identification of a gene associated with avian migratory behaviour. Proc R Soc Lond B. 2011;278:2848–56. 18. Hedenström A, Pettersson J. Migration routes and wintering areas of willow
warblers Phylloscopus trochilus (L) ringed in Fennoscandia. Ornis Fenn. 1987;64:137–43.
19. Chamberlain CP, Bensch S, Feng X, Åkesson S, Andersson T. Stable isotopes examined across a migratory divide in Scandinavian willow warblers (Phylloscopus trochilus trochilus and Phylloscopus trochilus acredula) reflect their African winter quarters. Proc R Soc Lond B. 2000;267:43–8.
20. Bensch S, Bengtsson G, Åkesson S. Patterns of stable isotope signatures in willow warbler Phylloscopus trochilus feathers collected in Africa. J Avian Biol. 2006;37:323–30.
21. Bensch S, Grahn M, Müller N, Gay L, Åkesson S. Genetic, morphological, and feather isotope variation of migratory willow warblers show gradual divergence in a ring. Mol Ecol. 2009;18:3087–96.
22. Bensch S, Andersson T, Åkesson S. Morphological and molecular variation across a migratory divide in willow warblers, Phylloscopus trochilus. Evolution. 1999;53:1925–35.
23. Larson KW, Liedvogel M, Addison B, Kleven O, Laskemoen T, Lifjeld JT, et al. Allelic variation in a willow warbler genomic region is associated with climate clines. PloS ONE. 2014;9(5):e95252.
24. Lundberg M, Boss J, Canbäck B, Liedvogel M, Larson KW, Grahn M, et al. Characterisation of a transcriptome to find sequence differences between two differentially migrating subspecies of the willow warbler Phylloscopus trochilus. BMC Genomics. 2013;14:11.
25. Naurin S, Bensch S, Hansson B, Johansson T, Clayton DF, Albrekt AS, et al. A microarray for large-scale genomic and transcriptional analyses of the zebra finch (Taeniopygia guttata) and other passerines. Mol Ecol Res. 2008;8:275–81.
26. Bensch S, Lindström A. The age of young willow warblers Phylloscopus trochilus estimated from different stages of post-juvenile moult. Ornis Svecica. 1992;2:23–8.
27. Pettersson J, Hasselquist D. Fat deposition and migrationcapacity of robins
Erithacus rubeculaand goldcrests at Ottenby, Sweden. Ring Migr. 1985;6:66–76. 28. Schroeder A, Mueller O, Stocker S, Salowsky R, Leiber M, Gassmann M, et al.
The RIN: an RNA integrity number for assigning integrity values to RNA measurements. BMC Mol Biol. 2006;7:3. doi:10.1186/1471-2199-7-3. 29. Naurin S, Hansson B, Hasselquist D, Kim YH, Bensch S. The sex-biased brain:
sexual dimorphism in gene expression in two species of songbirds. BMC Genomics. 2011;12:37. http://www.biomedcentral.com/1471-2164/12/37. 30. Naurin S, Hasselquist D, Bensch S, Hansson B. Sex-biased gene expression
on the avian Z chromosome: highly expressed genes show higher male-biased expression. Plos One. 2012;7:12.
31. Fridolfsson AK, Ellegren H. A simple and universal method for molecular sexing of non-ratite birds. J Avian Biol. 1999;30:116–21.
32. Larson KW, Liedvogel M, Bensch S, Akesson S, Wassenaar LI, Hobson KA. Inferring the ecology of willow warblers during their winter moult by sequential stable isotope analyses of remiges. J Avian Biol. 2013;44:561–6. 33. Benjamini Y, Hochberg Y. Controlling the false discovery rate - a practical
and powerful approach to multiple testing. J Royal Statist Soc Series B-Method. 1995;57:289–300.
34. Wu X, Watson M. CORNA: testing gene lists for regulation by microRNAs. Bioinformatics. 2009;25:832–3.
35. Schlicker A, Domingues FS, Rahnenfuhrer J, Lengauer T. A new measure for functional similarity of gene products based on Gene Ontology. BMC Bioinformatics. 2006;7:302. doi:10.1186/1471-2105-7-302.
36. Dean C, Dresbach T. Neuroligins and neurexins: linking cell adhesion, synapse formation and cognitive function. Trends Neurosciences. 2006;29:21–9. 37. Hu H, Gan J, Jonas P. Interneurons. Fast-spiking, parvalbumin+GABAergic
interneurons: from cellular design to microcircuit function. Science. 2014; 345:doi: 10.1126/science.1255263.
38. Bensch S, Åkesson S, Irwin DE. The use of AFLP to find an informative SNP: genetic differences across a migratory divide in willow warblers. Mol Ecology. 2002;11:2359–66.
39. De Smet F, Moreau Y, Engelen K, Timmerman D, Vergote I, De Moor B. Balancing false positives and false negatives for the detection of differential expression in malignancies. Br J Cancer. 2004;91:1160–5.
40. Robles JA, Qureshi SE, Stephen SJ, Wilson SR, Burden CJ, Taylor JM. Efficient experimental design and analysis strategies for the detection of differential expression using RNA-Sequencing. BMC Genomics. 2012;13:484. 41. Lein ES, Hawrylycz MJ, Ao N, Ayres M, Bensinger A, Bernard A, et al.
Genome-wide atlas of gene expression in the adult mouse brain. Nature. 2007;445:168–76.
42. Cooper EC, Jan LY. Ion channel genes and human neurological disease: Recent progress, prospects, and challenges. Proc Natl Acad Sci USA. 1999; 96:4759–66.
43. Peterson MP, Abolins-Abols M, Atwell JW, Rice RJ, Mila B, Ketterson ED. Variation in candidate genes CLOCK and ADCYAP1 does not consistently predict differences in migratory behavior in the songbird genus Junco. F1000Research. 2013;2:115.
44. Ressler KJ, Mercer KB, Bradley B, et al. Post-traumatic stress disorder is associated with PACAP and the PAC1 receptor. Nature. 2011;470:492–7. 45. Åkesson S, Boström J, Liedvogel M, Muheim R. Animal Navigation. In:
Akesson S, Hansson L-A, editors. Animal movements across scales. Oxford: Oxford University Press; 2014. p. 151-78.
46. Muheim R, Phillips JB, Åkesson S. Polarized light cues underlie compass calibration in migratory songbirds. Science. 2006;313:837–9.
47. Muheim R, Åkesson S, Boström J, Liedvogel M. Sensory mechanisms of animal orientation and navigation. In: Hansson L-A, Akesson S, editors. Animal Movement Across Scales. Oxford University Press; 2014.
48. Warren WC, Clayton DF, Ellegren H, Arnold AP, Hillier LW, Kunstner A, et al. The genome of a songbird. Nature. 2010;464:757–62.
49. Wolf JBW, Bayer T, Haubold B, Schilhabel M, Rosenstiel P, Tautz D. Nucleotide divergence vs. gene expression differentiation: comparative transcriptome sequencing in natural isolates from the carrion crow and its hybrid zone with the hooded crow. Mol Ecol. 2010;19:162–75.
50. Dzeja P, Terzic A. Adenylate Kinase and AMP Signaling Networks: Metabolic Monitoring, Signal Communication and Body Energy Sensing. Int J Mol Sciences. 2009;10:1729–72.
51. Simms BA, Zamponi GW. Neuronal Voltage-Gated Calcium Channels: Structure, Function, and Dysfunction. Neuron. 2014;82:24–45.
52. Bading H. Nuclear calcium signalling in the regulation of brain function. Nat Rev Neurosci. 2013;14:593–608.
53. Wiltschko W, Wiltschko R. Magnetic compass of European robins. Science. 1972;176:62–4.
54. Åkesson S, Bäckman J. Orientation in pied flycatchers: the relative importance of magnetic and visual information at dusk. Anim Behav. 1999; 57:819–28.
• We accept pre-submission inquiries
• Our selector tool helps you to find the most relevant journal
• We provide round the clock customer support
• Convenient online submission
• Thorough peer review
• Inclusion in PubMed and all major indexing services
• Maximum visibility for your research
Submit your manuscript at www.biomedcentral.com/submit